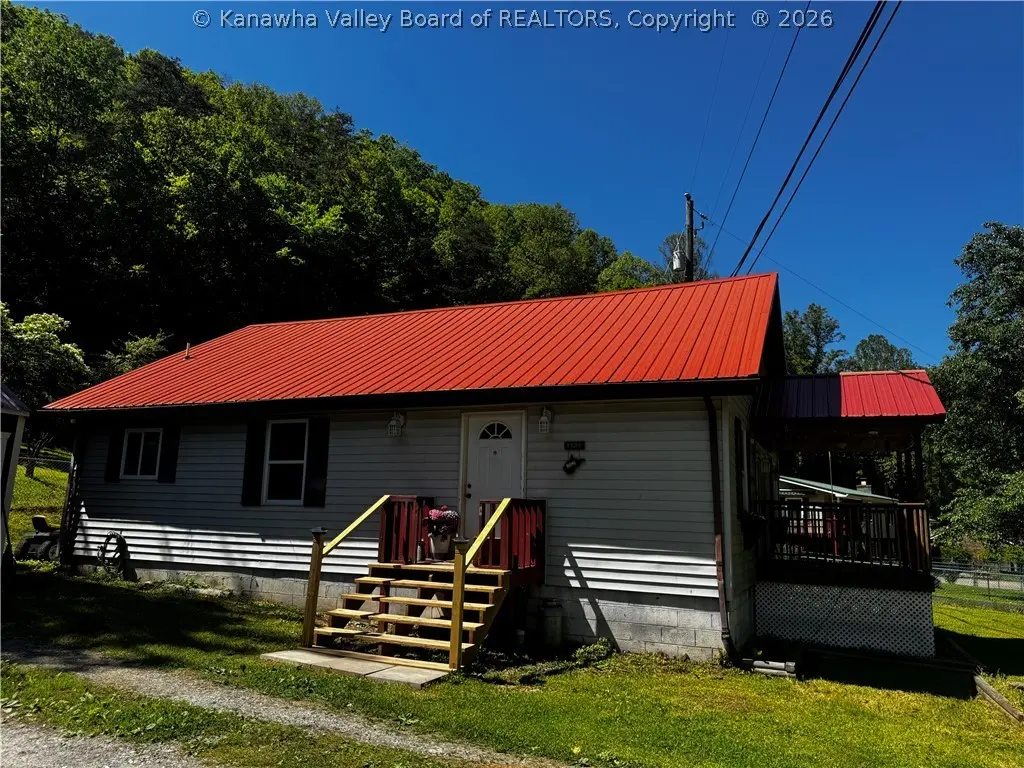
3728 Garrett Fork Rd · Chapmanville, WV
Flood risk 9/10 · Severe
- FEMA flood zone
- X (unshaded)
- Chance of flooding over 30 yrs
- 0.99%
- Est. flood insurance / yr
- $507 – $1,088
Fire risk 5/10 · Moderate
- Est. fire insurance / yr
- $787 – $1,461
Heat risk 5/10 · Moderate
- Hot days now (above 99°F)
- 8 days/yr
- Hot days in 30 yrs
- 21 days/yr
Wind risk 1/10 · Minimal
- Chance of severe wind over 30 yrs
- 1.0%
Air-quality risk 1/10 · Minimal
- Unhealthy air days now
- 0 days/yr
- Unhealthy air days in 30 yrs
- 0 days/yr
Risk factors via First Street. Map © Google.
Why this score? — see what drove the D grade
The composite is a weighted blend of 9 inputs, each scored 0–100. Each bar is that input's sub-score; the figure is the points it added to the 100-point composite (weight × sub-score).
- Cash flow +12.8/30.0
- Appreciation +8.0/10.0
- ARV discount +7.5/15.0
- DSCR +3.8/10.0
- Livability +3.1/5.0
- 1% rule +2.5/10.0
- Rent growth +2.5/5.0
- Condition / age +2.5/5.0
- Schools +2.1/10.0
$135,000
🖨 Deal sheet (PDF) 📄 Offer letter ✓ Due diligence
Listing remarks
Charming and move-in ready home located at 3728 Garrett Fork Road in Chapmanville! Offering approximately 1,410 sq. ft. of living space, this home features 2 bedrooms, 1 full bath, and a spacious 29 x 38 open floor plan combining the living room, dining area, and kitchen with appliances included. Enjoy the nice level fenced-in yard, newer porch, and plenty of parking. Convenient country setting with room to relax and entertain!
Key facts
- Open floor plan
- Country setting
- Newer porch
Tags
Property features AI
Exterior
- Parking: Parking pad
- Security: Smoke detectors
- Utilities: Public water; Septic tank sewer; Cable available
- Home design: Single family residence; Residential property
- Construction: Frame construction with vinyl siding
- Exterior features: Patio; Porch; Fenced yard
Interior
- Kitchen: Electric range; Microwave; Refrigerator
- Flooring: Vinyl flooring
- Bathrooms: 1 full bathroom
- Heating & cooling: Electric forced-air heating; Central electric air conditioning
- Interior features: Eat-in kitchen; Insulated windows; Electric Range, Microwave, Refrigerator
Neighborhood map
What this means for you Summary
Snapshot
- This is a 2-bed/1.0-bath single-family listed at $135k.
Deal economics
- At list price, monthly cash flow is $-79 ($-950/yr) — negative.
- To cash-flow at today's rent, offer at most $121k (10.4% below list).
- To meet the 1% rule (rent ≥ 1% of price), the offer needs to be $102k (24.5% below list).
- Recommended offer: $102k (24.5% below list) — sets the bar for 1% rule.
Location & tenants
- Location reads 62/100 on livability (#178 in WV) — a middle-class / working-renter tenant base. Strengths: crime A+, cost of living A+; Watch: amenities F, commute F, employment F.
- Logan County Schools (rural): math 18% / reading 32% proficiency, ranked #48 of 55 in WV (top 87%) — low school quality limits family demand, transient renter base, plan for 1-2y turnover.
- Zoned schools: Chapmanville Primary School (285 students, 0% FRL); Chapmanville Middle School (math 13% / reading 38%, grade F, #75 of 109 statewide, top 73%, 524 students, 0% FRL); Chapmanville Regional High School (math 12% / reading 42%, grade F, #79 of 110 statewide, top 78%, 721 students, 0% FRL) — zoned schools average 0% FRL vs 49% district-wide (49 pts lower); this property's tenant base skews higher-income than the district average.
- Market conditions: 23 active listings in the ZIP; 1 units permitted in Logan County in 2024 (0 in 5+ unit buildings).
Forward outlook
- In year one you build about $9k of equity ($933 loan paydown + $8k appreciation (6.0% local appreciation)).
- Logan County population projected at -35% by 2050 — secular population decline; favor cash flow + early exit over multi-decade hold.
- At projected returns (6.0% appreciation + 3.0% rent growth), your $38k cash investment doubles in ~5 years — after that, you're playing with house money.
- By year 4, paydown + projected appreciation supports a ~$31k cash-out refi (75% LTV) — recoverable capital for the next deal without selling this one.
Negotiation context
- It's been on market 30 days — a 2% lower offer ($133k) is reasonable based on typical stale-listing flexibility.
- 3 sale attempts since 7y ago with the ask held roughly flat each time — persistent listings suggest the price (not the market) is what's stuck; bring a comps-based counter.
- Current owner paid $96k; 41% above their basis — modest negotiation headroom, anchor on the comps not their cost.
Risks & watch-outs
- Watch-outs: flood insurance adds $66/mo.
- Climate carrying-cost: severe flood risk; moderate wildfire risk; extreme-heat days projected 8→21/yr by 2055 (HVAC capex compounding) — expect insurance premiums to compound above CPI over the hold.
Questions for the listing agent
- What do current leases actually rent for vs. the listed asking? Can we see a recent rent roll and the last 12 months of T-12 income?
- What's the actual annual flood-insurance premium (NFIP or private), and is the property in a SFHA with mandatory coverage?
- Is there a deadline driving the sale (1031 exchange, divorce, estate, relocation)? That informs how much negotiation room exists.
- The area grade is low — what's the realistic commute time and amenity access for the typical tenant pool here? Any planned neighborhood developments (good or bad) we should know about?
- What's the average days-on-market for RENTAL listings here right now (not sales)? A rising rental-DOM trend means longer vacancies and softer asking-rent achievability than the comps imply.
- What's the recent tenant-quality profile in this submarket — average credit score on applications, eviction rate, late-payment / NSF rate, and stable-employment percentage? A property-management company in the area should have these aggregated.
- How much new for-sale + rental construction is in the pipeline within 1–3 miles? Heavy new supply typically softens prices + rents 12–24 months out; constrained supply supports both.
Investment metrics
- 1% rule
- 0.75% ✗
- Cap rate
- 6.18%
- Cash-on-cash
- -0.40%
- DSCR
- 0.98
- GRM
- 11.0
CMA / ARV
No comps found within radius.
Projected returns pro-forma
6.04% appreciation · 3.0% rent growth · sell at horizon
- IRR
- 13.4%
- Equity multiple
- 1.91×
- Total profit
- $34,251
- Equity at exit
- $85,218
- IRR
- 13.9%
- Equity multiple
- 3.77×
- Total profit
- $104,575
- Equity at exit
- $154,842
Cash invested: $37,800 (down + closing). Projections, not guarantees.
Landlord ↔ Tenant lean methodology
- Overall (STATE)
- 83 Strongly Landlord-Friendly
- State West Virginia
- 83 Strongly Landlord-Friendly · R+22
- County
- — inherits STATE
- City
- — inherits STATE
ZIP-level market 25508
- Home prices YoY
- 4.0%
- Active inventory
- 23
- Price-to-rent
- 11.0×
Monthly cashflow live
- Estimated rent
- $1,019 medium interval (Pro) →
- Mortgage (P&I)
- −$708
- Tax from tax record
- −$54 /mo · $644/yr
- Insurance
- −$56
- Flood insurance flood zone
- −$66 /mo · $798/yr
- HOA
- −$0
- Vacancy / Maint / Mgmt
- −$214
- Net cashflow
- $-79
Break-even live
Sensitivity live
| Price | -10% $-3 | -5% $-41 | +0% $-79 | +5% $-117 | +10% $-156 |
|---|---|---|---|---|---|
| Rent | -10% $-160 | -5% $-119 | +0% $-79 | +5% $-39 | +10% $1 |
| Rate | -1.0pp $-11 | -0.5pp $-45 | base $-79 | +0.5pp $-114 | +1.0pp $-150 |
UW: 25.0% down · 7.5% · 30yr · 1.5% tax · 5.0% vac · 8.0% maint · 8.0% mgmt
Financing live
Cash to close
- Down payment
- $33,750
- Closing costs
- $4,050
- Reserves months
- —
- Total cash needed
- —
Loan-product check · same deal, 3 products live
Conventional
25% down · 7.5% · 30yr
- Down + closing
- —
- Monthly P&I
- —
- Monthly cashflow
- —
- DSCR
- —
- Eligible?
- —
Personal DTI + credit; lowest rate.
DSCR
20% down · 8.5% · 30yr
- Down + closing
- —
- Monthly P&I
- —
- Monthly cashflow
- —
- DSCR
- —
- Eligible?
- —
No personal income docs; deal must DSCR.
Hard money
10% down · 12.0% · 12mo
- Down + closing
- —
- Monthly P&I
- —
- Monthly cashflow
- —
- DSCR
- —
- Eligible?
- —
Short-term bridge; refi at stabilization.
Listing history 19 events
-
2026-06-21days on market $135,000 Active 30 DOM
-
2026-06-21days on market $135,000 Active 29 DOM
-
2026-06-18days on market $135,000 Active 27 DOM
-
2026-06-17days on market $135,000 Active 26 DOM
-
2026-06-16days on market $135,000 Active 25 DOM
-
2026-06-15days on market $135,000 Active 24 DOM
-
2026-06-15days on market $135,000 Active 23 DOM
-
2026-06-13days on market $135,000 Active 22 DOM
-
2026-06-12days on market $135,000 Active 21 DOM
-
2026-06-10status $135,000 Active 18 DOM
-
2026-06-02status $135,000 Pending 18 DOM
-
2026-06-01days on market $135,000 Active 18 DOM
-
2026-05-31days on market $135,000 Active 17 DOM
-
2026-05-13$135,000 Active
-
2021-02-01soldstatus $96,000
-
2021-01-29soldstatus $96,000
-
2020-11-11$105,000
-
2019-04-09$99,500
-
1998-12-09soldstatus $65,000
ⓘ Source: listings_history table (triggers on properties + properties_extension) + one-shot
backfill from property_details.listing_events for pre-trigger history.
Tax reassessment forecast WV · Resets to sale price
- Current annual tax
- $644 · $54/mo
- Projected year-2 tax
- $796 · $66/mo
- Expected delta
- +$152/yr (+$13/mo · 23.6%)
ⓘ Screening estimate from a state-policy table — verify with the county assessor before closing.
Climate risk First Street
- Flood 9/10 Extreme FEMA zone X (unshaded) · 99% chance over 30 yrs
- Wildfire 5/10 Major
- Heat 5/10 Major 8 d/yr ≥99°F today · 21 d/yr by 30 yrs out
- Wind 1/10 Low 100% chance of damaging wind over 30 yrs
- Air quality 1/10 Low 0 unhealthy d/yr today · 0 by 30 yrs out
Nearby sold comps map
Loading sold comps map…
Walkable amenities ~0.75 mi
Loading nearby amenities…
Taxation est. · year 1
- Rental income
- $12,231
- − Mortgage interest
- −$7,562
- − Property taxes
- −$644
- − Insurance
- −$1,472
- − Repairs & maintenance
- −$978
- − Management
- −$978
- − Depreciation
- −$3,927
- Taxable loss
- −$3,332
- Est. tax savings @ 24.0%
- +$800
- After-tax cash flow
- $-150/yr
For passive investors: Depreciation is non-cash, so a rental often shows a tax loss while cash-flowing — sheltering income. Rental losses are passive: they offset passive income freely, and up to $25,000/yr can offset ordinary (W-2) income if you actively participate and your MAGI is under $100k (phasing out to $0 by $150k); unused losses carry forward. On sale, claimed depreciation is recaptured at up to 25%, and gains may owe capital-gains tax (a 1031 exchange can defer both). Figures are a year-1 estimate at your 24.0% rate — not tax advice; consult a CPA.
Schools (NCES district)
- District
- Logan County Schools
- NCES district ID
- 5400690
- Math proficiency
- 18% ▼ -15.00%
- Reading proficiency
- 32% ▼ -9.00%
- Median HH income
- $36,127
- Composite
- 20.68/100
- National rank
- #8531
- State rank
- #48 of 55 in WV
Livability — Chapmanville
- Score
- 62/100
- State rank
- #178
- US rank
- #16281
Category grades
Schools grade is shown separately in the Schools card above.
Census & demographics
- Population (ZIP)
- 8,282
Population outlook (Logan County) Hauer SSP2
- Today (2025)
- 30,218 people
- By 2030
- 27,848 · -7.8%
- By 2040
- 23,262 · -23.0%
- By 2050
- 19,582 · -35.2%
- By 2075
- 12,739 · -57.8%
- By 2100
- 7,787 · -74.2%
Race, ethnicity, and origin ACS 2023
- Neighborhood character
- Predominantly White (98%)
- Race & ethnicity
- White 98% Two or more races 2%
- Common ancestry
- Italian 1% Serbian 1% Slovak 1%
Political lean MEDSL · Logan
- 2024 margin
- Solid R (+66.7) · D 16.1% · R 82.8% · Other 1.1%
- 2008→2024 swing
- -55.9pp toward R · 2008: -10.8pp · 2024: -66.7pp
- All cycles
- 2024: R+66.7 2020: R+63.0 2016: R+63.2 2012: R+39.7 2008: R+10.8
Not yet ingested
- Civics
- —
Market trends
- HPI YoY
- ▲ 6.04%
- Current HPI
- 156.5895
- Rent YoY
- —
- Metro
- —
- State GDP YoY
- —
- F500 in state
- 0
Price history
+107.7% since first listed6 events — show timeline
- 2026-05-13 Listed $135,000 KVBOR
- 2021-02-01 Sold (Public Records) $96,000 Public Records
- 2021-01-29 Sold (MLS) $96,000 KVBOR
- 2020-11-11 Listed $105,000 KVBOR
- 2019-04-09 Listed $99,500 KVBOR
- 1998-12-09 Sold (Public Records) $65,000 Public Records
Property tax history
+4.1%/yrLatest (2025): $644 · +1.7% YoY. Source: county tax records.
Cash-flow waterfall
monthlySold comps — $/sqft
last 12 mo · ≤1 miLoading sold comps…