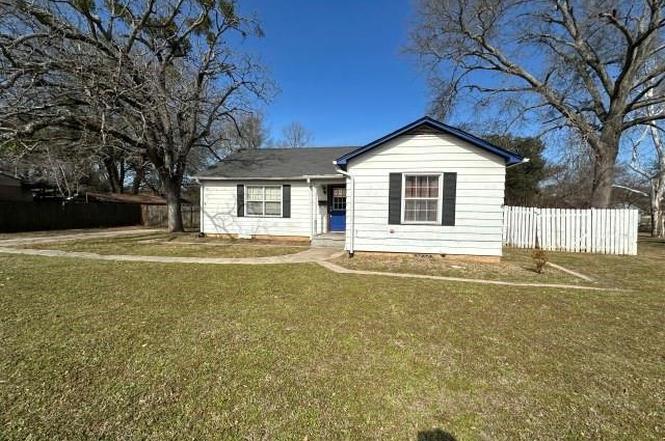
106 Parsons Pkwy · Athens, TX
Flood risk 1/10 · Minimal
- FEMA flood zone
- X (unshaded)
- Chance of flooding over 30 yrs
- 0.0%
- Est. flood insurance / yr
- $507 – $1,088
Fire risk 4/10 · Minor
- Est. fire insurance / yr
- $1,222 – $2,270
Heat risk 7/10 · Major
- Hot days now (above 110°F)
- 7 days/yr
- Hot days in 30 yrs
- 26 days/yr
Wind risk 6/10 · Moderate
- Chance of severe wind over 30 yrs
- 62.0%
Air-quality risk 2/10 · Minimal
- Unhealthy air days now
- 0 days/yr
- Unhealthy air days in 30 yrs
- 1 days/yr
Risk factors via First Street. Map © Google.
Why this score? — see what drove the D+ grade
The composite is a weighted blend of 9 inputs, each scored 0–100. Each bar is that input's sub-score; the figure is the points it added to the 100-point composite (weight × sub-score).
- ARV discount +15.0/15.0
- Cash flow +13.0/30.0
- 1% rule +4.9/10.0
- DSCR +3.9/10.0
- Livability +3.6/5.0
- Schools +2.9/10.0
- Rent growth +2.5/5.0
- Condition / age +2.5/5.0
- Appreciation +0.0/10.0
$149,900
🖨 Deal sheet 📄 Offer letter ✓ Due diligence
Listing remarks MLS
Cute and updated three bedroom, two bath home with classic hardwood floors, two living areas, updated kitchen with gas range top and central air/heat (3 years old). This home has a great location and is on quiet street.
Key facts
- 2 living areas
- Fenced backyard
- 0.32 acre lot
Tags
Neighborhood map
What this means for you Summary
Snapshot
- This is a 3-bed/2.0-bath single-family listed at $150k.
Deal economics
- At list price, monthly cash flow is $-8 ($-92/yr) — negative.
- To cash-flow at today's rent, offer at most $149k (0.9% below list).
- To meet the 1% rule (rent ≥ 1% of price), the offer needs to be $148k (1.0% below list).
- Recommended offer: $145k (3.0% below list) — sets the bar for market timing.
- Cap rate 6.2% vs local median 2.5% in Athens — top-decile yield for the area; either an underpriced asset or a hidden risk that comps aren't pricing in. Stress-test before assuming the spread holds.
Location & tenants
- Location reads 72/100 on livability (#241 in TX) — a middle-class / working-renter tenant base. Strengths: cost of living A+, health & safety A+, housing A; Watch: crime D+, amenities F, commute F.
- Athens ISD (town): math 34% / reading 34% proficiency, ranked #548 of 826 in TX (top 66%) — families likely to look elsewhere, expect single-tenant / working-renter base with shorter leases; 62% free/reduced lunch — lower-income household profile, screen leases tightly.
- Zoned schools: Bel Air El (math 34% / reading 35%, grade F, #1,995 of 4,322 statewide, top 50%, 453 students, 83% FRL) — zoned schools average 83% FRL vs 62% district-wide (21 pts higher); higher-poverty schools than district average — tighter screening recommended.
- Market conditions: 188 active listings in the ZIP; 1 comparable units currently listed for rent nearby; 263 units permitted in Henderson County in 2024 (0 in 5+ unit buildings).
Forward outlook
- Local home prices are declining (-3.0%/yr); year-one equity from $1k of loan paydown is wiped out by about $4k of value loss. Plan a longer hold.
Negotiation context
- It's been on market 37 days — a 3% lower offer ($145k) is reasonable based on typical stale-listing flexibility.
- 6 sale attempts since 8y ago with the ask held roughly flat each time — persistent listings suggest the price (not the market) is what's stuck; bring a comps-based counter.
Risks & watch-outs
- Watch-outs: property tax is 2.7% of price; built in 1948 — expect roof / HVAC / electrical / plumbing capex.
- Climate carrying-cost: major wind risk, 62% chance of damaging wind over 30y; extreme-heat days projected 7→26/yr by 2055 (HVAC capex compounding) — expect insurance premiums to compound above CPI over the hold.
Questions for the listing agent
- What do current leases actually rent for vs. the listed asking? Can we see a recent rent roll and the last 12 months of T-12 income?
- It's been on market 37 days. Have you received any prior offers? Is the seller open to a 3% concession, seller financing, or rate buy-down credit?
- Built in 1948 — when were the roof, HVAC, electrical panel, plumbing, and water heater last replaced?
- Property tax is high relative to price — has the assessment been appealed recently, and will the sale trigger a re-assessment?
- Is there a deadline driving the sale (1031 exchange, divorce, estate, relocation)? That informs how much negotiation room exists.
- Schools are D-rated, which usually means shorter tenancies and higher turnover. Who's the typical renter profile here, and what's been the actual vacancy rate?
- Crime grade is D in this area — have there been break-ins, vandalism, or insurance claims at this property in the last 3 years? What carrier currently insures it and at what premium?
- The area grade is low — what's the realistic commute time and amenity access for the typical tenant pool here? Any planned neighborhood developments (good or bad) we should know about?
- What's the average days-on-market for RENTAL listings here right now (not sales)? A rising rental-DOM trend means longer vacancies and softer asking-rent achievability than the comps imply.
- What's the recent tenant-quality profile in this submarket — average credit score on applications, eviction rate, late-payment / NSF rate, and stable-employment percentage? A property-management company in the area should have these aggregated.
- How much new for-sale + rental construction is in the pipeline within 1–3 miles? Heavy new supply typically softens prices + rents 12–24 months out; constrained supply supports both.
Investment metrics
- 1% rule
- 0.99% ✗
- Cap rate
- 6.23%
- Cash-on-cash
- -0.22%
- DSCR
- 0.99
- GRM
- 8.4
CMA / ARV
- ARV (on-the-fly)
- $282,564
- Comps found
- 12
Show comp detail 12 sales within ~0.75 mi
| Address | Dist | Beds/Ba | Sqft | Sold | Price | $/sf | Match |
|---|---|---|---|---|---|---|---|
| 106 Parsons Pkwy | 0.00mi | 3/2.0 | 2,004 (0%) | 1mo | $149,900 | $75 | 99 |
| 722 Belmont St | 0.25mi | 3/2.0 | 1,867 (-7%) | 1mo | $284,900 | $153 | 76 |
| 704 Park Place Dr | 0.29mi | 3/2.0 | 2,097 (+5%) | 6mo | $499,500 | $238 | 74 |
| 116 Leland Dr | 0.21mi | 3/2.0 | 1,837 (-8%) | 3mo | $259,000 | $141 | 74 |
| 236 La Jolla Dr | 0.35mi | 3/2.0 | 1,915 (-4%) | 8mo | $224,900 | $117 | 70 |
| 1124 Hillside Dr | 0.68mi | 3/2.0 | 2,021 (+1%) | 4mo | $325,000 | $161 | 63 |
| 133 Penny Ln | 0.17mi | 3/2.5 | 1,716 (-14%) | 4mo | $274,500 | $160 | 63 |
| 1111 Hillside Dr | 0.64mi | 3/2.5 | 2,049 (+2%) | 4mo | $305,000 | $149 | 61 |
| 220 Guadalupe Dr | 0.39mi | 3/2.0 | 1,730 (-14%) | 2mo | $219,900 | $127 | 57 |
| 505 Laurel Rd | 0.65mi | 4/2.0 (+1) | 1,789 (-11%) | 0mo | $250,000 | $140 | 47 |
| 508 Highland Dr | 0.64mi | 3/2.0 | 1,716 (-14%) | 6mo | $199,000 | $116 | 41 |
| 509 Davis Dr | 0.68mi | 4/2.0 (+1) | 1,774 (-12%) | 7mo | $232,900 | $131 | 38 |
Match score weights: distance 35% · size 25% · config 20% · recency 20%. Top-matched comps best support the ARV.
Projected returns pro-forma
-3.0% appreciation · 3.0% rent growth · sell at horizon
- IRR
- -16.6%
- Equity multiple
- 0.41×
- Total profit
- $-24,668
- Equity at exit
- $22,351
- IRR
- -8.2%
- Equity multiple
- 0.48×
- Total profit
- $-21,659
- Equity at exit
- $12,961
Cash invested: $41,972 (down + closing). Projections, not guarantees.
Landlord ↔ Tenant lean methodology
- Overall (STATE)
- 87 Strongly Landlord-Friendly
- State Texas
- 87 Strongly Landlord-Friendly · R+5
- County
- — inherits STATE
- City
- — inherits STATE
ZIP-level market 75751
- Home prices YoY
- -33.1%
- Active inventory
- 188
- Price-to-rent
- 8.4×
Monthly cashflow live
- Estimated rent
- $1,484 medium interval (Pro) →
- Mortgage (P&I)
- −$786
- Tax from tax record
- −$331 /mo · $3,976/yr
- Insurance
- −$62
- HOA
- −$0
- Vacancy / Maint / Mgmt
- −$312
- Net cashflow
- $-8
Break-even live
UW: 25.0% down · 7.5% · 30yr · 1.5% tax · 5.0% vac · 8.0% maint · 8.0% mgmt
Financing live
Cash to close
- Down payment
- $37,475
- Closing costs
- $4,497
- Reserves months
- —
- Total cash needed
- —
Loan-product check · same deal, 3 products live
Conventional
25% down · 7.5% · 30yr
- Down + closing
- —
- Monthly P&I
- —
- Monthly cashflow
- —
- DSCR
- —
- Eligible?
- —
Personal DTI + credit; lowest rate.
DSCR
20% down · 8.5% · 30yr
- Down + closing
- —
- Monthly P&I
- —
- Monthly cashflow
- —
- DSCR
- —
- Eligible?
- —
No personal income docs; deal must DSCR.
Hard money
10% down · 12.0% · 12mo
- Down + closing
- —
- Monthly P&I
- —
- Monthly cashflow
- —
- DSCR
- —
- Eligible?
- —
Short-term bridge; refi at stabilization.
Rent comps 1 comps
| Address | Beds | Baths | Sqft | Rent | $/sqft | DOM | Units | Dist |
|---|---|---|---|---|---|---|---|---|
| 1004 W Cayuga Dr Athens, TX | 4.0 | 2.0 | 1495 | $1,500 | $1.00 | 43d | 1 | 0.82mi |
Listing history 18 events
-
2026-03-19status Pending
-
2026-03-17status Active
-
2026-03-13status Pending
-
2026-02-06$149,900 Active
-
2018-07-06soldstatus 219-char remark
Show marketing remark (218 chars)
Cute and updated three bedroom, two bath home with classic hardwood floors, two living areas, updated kitchen with gas range top and central air and heat (3 years old). This home has a great location on a quiet street.
-
2018-07-06soldstatus Sold 218-char remark
Show marketing remark (218 chars)
Cute and updated three bedroom, two bath home with classic hardwood floors, two living areas, updated kitchen with gas range top and central air and heat (3 years old). This home has a great location on a quiet street.
-
2018-07-06soldstatus
Show marketing remark (218 chars)
Cute and updated three bedroom, two bath home with classic hardwood floors, two living areas, updated kitchen with gas range top and central air and heat (3 years old). This home has a great location on a quiet street.
-
2018-07-06soldstatus
Show marketing remark (218 chars)
Cute and updated three bedroom, two bath home with classic hardwood floors, two living areas, updated kitchen with gas range top and central air and heat (3 years old). This home has a great location on a quiet street.
-
2018-07-02soldstatus
-
2018-05-29status Pending 218-char remark
Show marketing remark (218 chars)
Cute and updated three bedroom, two bath home with classic hardwood floors, two living areas, updated kitchen with gas range top and central air and heat (3 years old). This home has a great location on a quiet street.
-
2018-05-25$137,500 219-char remark
Show marketing remark (219 chars)
Cute and updated three bedroom, two bath home with classic hardwood floors, two living areas, updated kitchen with gas range top and central air/heat (3 years old). This home has a great location and is on quiet street.
-
2018-05-10price $137,500 218-char remark
Show marketing remark (218 chars)
Cute and updated three bedroom, two bath home with classic hardwood floors, two living areas, updated kitchen with gas range top and central air and heat (3 years old). This home has a great location on a quiet street.
-
2018-04-12$145,000 Active 218-char remark
Show marketing remark (218 chars)
Cute and updated three bedroom, two bath home with classic hardwood floors, two living areas, updated kitchen with gas range top and central air and heat (3 years old). This home has a great location on a quiet street.
-
2018-04-12$137,500
Show marketing remark (218 chars)
Cute and updated three bedroom, two bath home with classic hardwood floors, two living areas, updated kitchen with gas range top and central air and heat (3 years old). This home has a great location on a quiet street.
-
2018-04-12$137,500
Show marketing remark (218 chars)
Cute and updated three bedroom, two bath home with classic hardwood floors, two living areas, updated kitchen with gas range top and central air and heat (3 years old). This home has a great location on a quiet street.
-
2009-06-25soldstatus
-
2009-06-25soldstatus
-
1989-10-01soldstatus
ⓘ Source: listings_history table (triggers on properties + properties_extension) + one-shot
backfill from property_details.listing_events for pre-trigger history.
Tax reassessment forecast TX · Resets to sale price
- Current annual tax
- $3,976 · $331/mo
- Projected year-2 tax
- $3,976 · $331/mo
- Expected delta
- $0/yr ($0/mo · 0.0%)
ⓘ Screening estimate from a state-policy table — verify with the county assessor before closing.
Climate risk First Street
- Flood 1/10 Low FEMA zone X (unshaded) · 0% chance over 30 yrs
- Wildfire 4/10 Moderate
- Heat 7/10 Severe 7 d/yr ≥110°F today · 26 d/yr by 30 yrs out
- Wind 6/10 Major 62% chance of damaging wind over 30 yrs
- Air quality 2/10 Low 0 unhealthy d/yr today · 1 by 30 yrs out
Nearby sold comps map
Loading sold comps map…
Walkable amenities ~0.75 mi
Loading nearby amenities…
Taxation est. · year 1
- Rental income
- $17,806
- − Mortgage interest
- −$8,397
- − Property taxes
- −$3,976
- − Insurance
- −$750
- − Repairs & maintenance
- −$1,424
- − Management
- −$1,424
- − Depreciation
- −$4,361
- Taxable loss
- −$2,526
- Est. tax savings @ 24.0%
- +$606
- After-tax cash flow
- $514/yr
For passive investors: Depreciation is non-cash, so a rental often shows a tax loss while cash-flowing — sheltering income. Rental losses are passive: they offset passive income freely, and up to $25,000/yr can offset ordinary (W-2) income if you actively participate and your MAGI is under $100k (phasing out to $0 by $150k); unused losses carry forward. On sale, claimed depreciation is recaptured at up to 25%, and gains may owe capital-gains tax (a 1031 exchange can defer both). Figures are a year-1 estimate at your 24.0% rate — not tax advice; consult a CPA.
Schools (NCES district)
- District
- Athens ISD
- NCES district ID
- 4808870
- Math proficiency
- 34% ▼ -9.00%
- Reading proficiency
- 34% ▼ -4.00%
- Median HH income
- $41,617
- Composite
- 28.73/100
- National rank
- #6680
- State rank
- #548 of 826 in TX
Livability — Athens
- Score
- 72/100
- State rank
- #241
- US rank
- #5796
Category grades
Schools grade is shown separately in the Schools card above.
Census & demographics
- Census place
- Athens, TX
- County
- Henderson County · 34,977 people
- City population
- 18,644
- Metro
- Athens, TX
- Population (ZIP)
- 18,644
- Household income
- $70,620
- Rent vs Own
- Severe rent burden
- 535.0
Population outlook (Henderson County) Hauer SSP2
- Today (2025)
- 80,471 people
- By 2030
- 80,608 · +0.2%
- By 2040
- 80,087 · -0.5%
- By 2050
- 78,208 · -2.8%
- By 2075
- 72,423 · -10.0%
- By 2100
- 61,012 · -24.2%
Race, ethnicity, and origin ACS 2023
- Neighborhood character
- Diverse neighborhood (Simpson 0.56)
- Race & ethnicity
- White 60% Hispanic / Latino 24% Two or more races 18% Black 10% Asian 2%
- Hispanic origin (detail)
- Mexican 22%
- Common ancestry
- Slovak 2% Romanian 1% Italian 1%
- Foreign-born
- 8% · Canada
- Languages at home
- 79% English-only · Spanish 19% Other Asian/Pacific 1%
Political lean MEDSL · Henderson
- 2024 margin
- Solid R (+63.5) · D 18.0% · R 81.4%
- 2008→2024 swing
- -18.8pp toward R · 2008: -44.6pp · 2024: -63.5pp
- All cycles
- 2024: R+63.5 2020: R+60.2 2016: R+60.0 2012: R+54.8 2008: R+44.6
Not yet ingested
- Civics
- —
Market trends
- HPI YoY
- ▼ -95.19%
- Current HPI
- 192.3973
- Rent YoY
- —
- Metro
- Athens, TX
- State GDP YoY
- ▲ 3.95%
- F500 in state
- 110
Industry mix (Fortune 500 HQ in TX)
| Industry | F500 HQs | Revenue |
|---|---|---|
| Energy | 16 | $1,198B |
|
||
| Technology | 5 | $198B |
|
||
| Engineering / Construction | 4 | $72B |
|
||
| Energy Services | 3 | $60B |
|
||
| Utilities | 3 | $41B |
|
||
| Healthcare | 2 | $330B |
|
||
Price history
+3.4% since first listed18 events — show timeline
- 2026-03-19 Pending — NTREIS
- 2026-03-17 Relisted — NTREIS
- 2026-03-13 Pending — NTREIS
- 2026-02-06 Listed $149,900 NTREIS
- 2018-07-06 Sold (MLS) — PAOR
- 2018-07-06 Sold (MLS) — HCBOR
- 2018-07-06 Sold (MLS) — NTREIS
- 2018-07-06 Sold (MLS) — GTAR
- 2018-07-02 Sold (Public Records) — Public Records
- 2018-05-29 Pending — NTREIS
- 2018-05-25 Listed $137,500 GTAR
- 2018-05-10 Price Changed $137,500 NTREIS
- 2018-04-12 Listed $137,500 PAOR
- 2018-04-12 Listed $137,500 HCBOR
- 2018-04-12 Listed $145,000 NTREIS
- 2009-06-25 Sold (Public Records) — Public Records
- 2009-06-25 Sold (Public Records) — Public Records
- 1989-10-01 Sold (Public Records) — Public Records
Property tax history
+6.3%/yrLatest (2025): $3,976 · +10.3% YoY. Source: county tax records.
Cash-flow waterfall
monthlySold comps — $/sqft
last 12 mo · ≤1 miLoading sold comps…