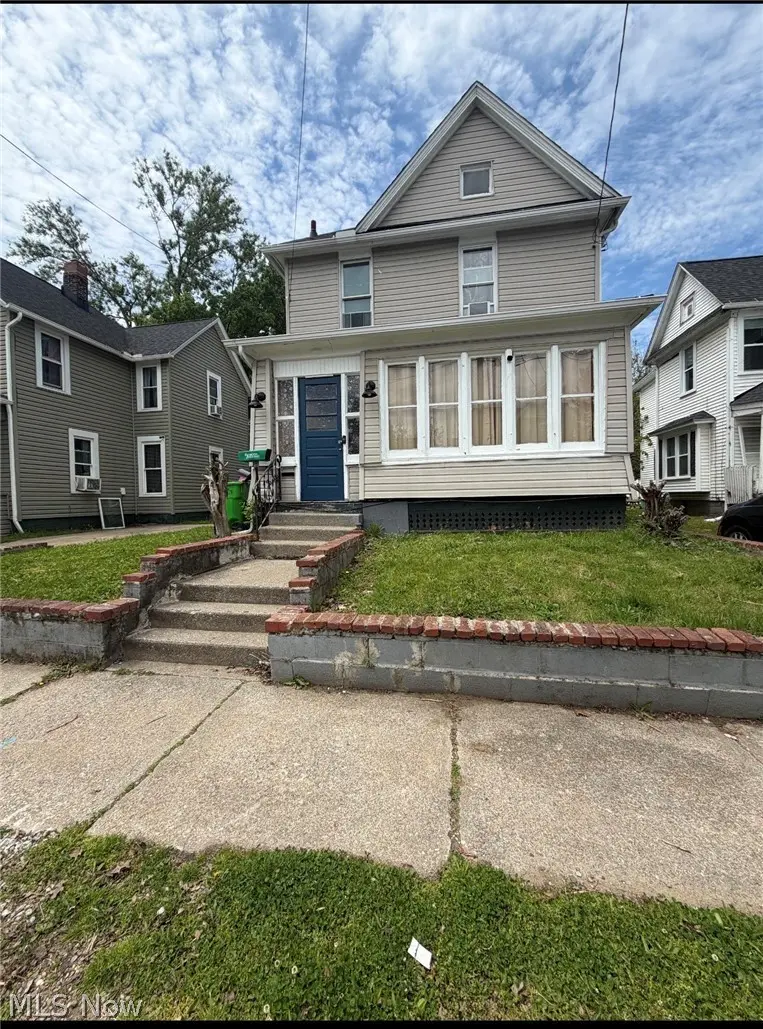
284 3rd St NW · Barberton, OH
Flood risk 4/10 · Minor
- FEMA flood zone
- X (unshaded)
- Chance of flooding over 30 yrs
- 0.2%
- Est. flood insurance / yr
- $473 – $860
Fire risk 1/10 · Minimal
- Est. fire insurance / yr
- $713 – $1,323
Heat risk 3/10 · Minor
- Hot days now (above 96°F)
- 7 days/yr
- Hot days in 30 yrs
- 17 days/yr
Wind risk 1/10 · Minimal
- Chance of severe wind over 30 yrs
- —
Air-quality risk 2/10 · Minimal
- Unhealthy air days now
- 0 days/yr
- Unhealthy air days in 30 yrs
- 1 days/yr
Risk factors via First Street. Map © Google.
Why this score? — see what drove the B- grade
The composite is a weighted blend of 9 inputs, each scored 0–100. Each bar is that input's sub-score; the figure is the points it added to the 100-point composite (weight × sub-score).
- Cash flow +26.3/30.0
- ARV discount +11.3/15.0
- DSCR +8.9/10.0
- 1% rule +6.5/10.0
- Schools +4.1/10.0
- Rent growth +4.0/5.0
- Livability +3.6/5.0
- Condition / age +2.5/5.0
- Appreciation +0.0/10.0
$149,900
🖨 Deal sheet 📄 Offer letter ✓ Due diligence
Listing remarks
Attention Investors! Turnkey cashflow rental property with an immediate, high-yielding income of $1,693/month with an active tenant in place through 12/31/2026. This 5-bedroom, 2-bath home offers a spacious layout featuring a living room, dining room, kitchen, first-floor bedroom, full bathroom, and convenient first-floor laundry. The second floor includes four additional bedrooms and a second full bathroom. A premier opportunity for investors seeking a fully updated, high-performing asset to add to their portfolio. Please allow 48-hour notice for showings. Appointments are available between 11:00 AM and 1:00 PM. Interior photos were taken prior to tenant occupancy and may not reflect the p
Key facts
- 4,917 sq ft lot
- Parking
- Built 1903
Property features AI
Exterior
- Parking: Driveway (unpaved)
- Utilities: Public water; Public sewer
- Home design: Two-story home; Updated/remodeled; Above-grade finished living area approximately 1,928
- Construction: Aluminum and vinyl siding; Asphalt/fiberglass roof; Concrete basement
- Exterior features: Enclosed patio/porch; Patio; Porch
Interior
- Kitchen: Range; Refrigerator
- Bedrooms: One main-level bedroom
- Bathrooms: Two full bathrooms (one on the main level)
- Heating & cooling: Forced air heating
- Interior features: ENERGY STAR qualified windows; Updated/remodeled condition; Has basement with concrete construction
- Laundry & utility: Washer hookup; Electric dryer hookup; Laundry located in kitchen on the main level
Neighborhood map
What this means for you Summary
Snapshot
- This is a 4-bed/2.0-bath single-family listed at $150k.
Deal economics
- At list price, monthly cash flow is $387 ($5k/yr) — positive.
- The deal already cash-flows at list — no discount required.
- Meets the 1% rule at list price ($2k rent vs $150k).
- Recommended offer: $148k (1.5% below list) — sets the bar for market timing.
- Cap rate 9.4% vs local median 6.2% in Barberton — top-decile yield for the area; either an underpriced asset or a hidden risk that comps aren't pricing in. Stress-test before assuming the spread holds.
Location & tenants
- Location reads 71/100 on livability (#428 in OH) — a middle-class / working-renter tenant base. Strengths: cost of living A+, housing A+, health & safety A+; Watch: crime C-, amenities F, commute F.
- Barberton City (suburban): math 47% / reading 51% proficiency, ranked #466 of 656 in OH (top 71%) — families likely to look elsewhere, expect single-tenant / working-renter base with shorter leases; 62% free/reduced lunch — lower-income household profile, screen leases tightly.
- Market conditions: Rents rising fast (+5.9%/yr); 219 active listings in the ZIP; 3 comparable units currently listed for rent nearby; rentals at typical pace (median 24d on market — plan ~3-4 weeks tenant-placement turnaround); 1,114 units permitted in Summit County in 2024 (397 in 5+ unit buildings).
- This rent runs 32% of the median local income ($64k/yr) — at the standard rent-burdened threshold; future hikes will face affordability resistance.
Forward outlook
- Local home prices are declining (-3.0%/yr); year-one equity from $1k of loan paydown is wiped out by about $4k of value loss. Plan a longer hold.
- Summit County population projected to shrink 6% by 2050 — rents likely to lag national; underwrite the cash flow, not the appreciation.
- At projected returns (-3.0% appreciation + 5.9% rent growth), your $42k cash investment doubles in ~8 years — after that, you're playing with house money.
Negotiation context
- It's been on market 17 days — a 2% lower offer ($148k) is reasonable based on typical stale-listing flexibility.
- 7 sale attempts since 33y ago with the ask held roughly flat each time — persistent listings suggest the price (not the market) is what's stuck; bring a comps-based counter.
Risks & watch-outs
- Watch-outs: built in 1903 — expect roof / HVAC / electrical / plumbing capex.
Questions for the listing agent
- Built in 1903 — when were the roof, HVAC, electrical panel, plumbing, and water heater last replaced?
- Is there a deadline driving the sale (1031 exchange, divorce, estate, relocation)? That informs how much negotiation room exists.
- What's the average days-on-market for RENTAL listings here right now (not sales)? A rising rental-DOM trend means longer vacancies and softer asking-rent achievability than the comps imply.
- What's the recent tenant-quality profile in this submarket — average credit score on applications, eviction rate, late-payment / NSF rate, and stable-employment percentage? A property-management company in the area should have these aggregated.
- How much new for-sale + rental construction is in the pipeline within 1–3 miles? Heavy new supply typically softens prices + rents 12–24 months out; constrained supply supports both.
Investment metrics
- 1% rule
- 1.15% ✓
- Cap rate
- 9.39%
- Cash-on-cash
- 11.07%
- DSCR
- 1.49
- GRM
- 7.3
CMA / ARV
- ARV (on-the-fly)
- $163,880
- Comps found
- 8
Show comp detail 8 sales within ~0.75 mi
| Address | Dist | Beds/Ba | Sqft | Sold | Price | $/sf | Match |
|---|---|---|---|---|---|---|---|
| 557 W Hopocan Ave | 0.07mi | 4/2.0 | 1,654 (-14%) | 2mo | $125,000 | $76 | 71 |
| 168 2nd St SE | 0.23mi | 3/2.0 (-1) | 1,782 (-8%) | 4mo | $205,000 | $115 | 69 |
| 672 W Paige Ave | 0.36mi | 4/2.0 | 1,819 (-6%) | 20mo | $126,000 | $69 | 57 |
| 526 Wooster Rd N | 0.63mi | 5/2.0 (+1) | 1,773 (-8%) | 2mo | $149,900 | $85 | 50 |
| 208 7th St NW | 0.30mi | 4/1.5 | 1,739 (-10%) | 22mo | $104,000 | $60 | 49 |
| 523 Harvard Ave | 0.68mi | 3/1.5 (-1) | 2,010 (+4%) | 11mo | $155,555 | $77 | 45 |
| 536 Yale Ave | 0.63mi | 3/2.0 (-1) | 1,670 (-13%) | 5mo | $171,900 | $103 | 39 |
| 280 Ontario St | 0.58mi | 4/1.5 | 1,685 (-13%) | 18mo | $185,000 | $110 | 35 |
Match score weights: distance 35% · size 25% · config 20% · recency 20%. Top-matched comps best support the ARV.
Projected returns pro-forma
-3.0% appreciation · 5.86% rent growth · sell at horizon
- IRR
- 3.3%
- Equity multiple
- 1.13×
- Total profit
- $5,448
- Equity at exit
- $22,351
- IRR
- 15.3%
- Equity multiple
- 2.40×
- Total profit
- $58,627
- Equity at exit
- $12,961
Cash invested: $41,972 (down + closing). Projections, not guarantees.
Landlord ↔ Tenant lean methodology
- Overall (STATE)
- 73 Landlord-Friendly
- State Ohio
- 73 Landlord-Friendly · R+6
- County
- — inherits STATE
- City
- — inherits STATE
ZIP-level market 44203
- Rents YoY
- 5.9%
- Active inventory
- 219
- Price-to-rent
- 7.3×
Monthly cashflow live
- Estimated rent
- $1,723 medium interval (Pro) →
- Mortgage (P&I)
- −$786
- Tax from tax record
- −$125 /mo · $1,504/yr
- Insurance
- −$62
- HOA
- −$0
- Vacancy / Maint / Mgmt
- −$362
- Net cashflow
- $387
Break-even live
UW: 25.0% down · 7.5% · 30yr · 1.5% tax · 5.0% vac · 8.0% maint · 8.0% mgmt
Financing live
Cash to close
- Down payment
- $37,475
- Closing costs
- $4,497
- Reserves months
- —
- Total cash needed
- —
Loan-product check · same deal, 3 products live
Conventional
25% down · 7.5% · 30yr
- Down + closing
- —
- Monthly P&I
- —
- Monthly cashflow
- —
- DSCR
- —
- Eligible?
- —
Personal DTI + credit; lowest rate.
DSCR
20% down · 8.5% · 30yr
- Down + closing
- —
- Monthly P&I
- —
- Monthly cashflow
- —
- DSCR
- —
- Eligible?
- —
No personal income docs; deal must DSCR.
Hard money
10% down · 12.0% · 12mo
- Down + closing
- —
- Monthly P&I
- —
- Monthly cashflow
- —
- DSCR
- —
- Eligible?
- —
Short-term bridge; refi at stabilization.
Rent comps 3 comps
| Address | Beds | Baths | Sqft | Rent | $/sqft | DOM | Units | Dist |
|---|---|---|---|---|---|---|---|---|
| 459 Wooster Rd N Unit 469 Barberton, OH | 3.0 | 1.0 | 1782 | $1,000 | $0.56 | 43d | 1 | 0.54mi |
| 369 E Tuscarawas Ave Barberton, OH | 3.0 | 1.0 | 2162 | $2,900 | $1.34 | 23d | 1 | 0.93mi |
| 653 Washington Ave Barberton, OH | 4.0 | 2.0 | 1360 | $1,600 | $1.18 | 21d | 1 | 1.41mi |
Listing history 12 events
-
2026-06-18days on market $149,900 Active 17 DOM
-
2026-06-17days on market $149,900 Active 16 DOM
-
2026-06-16days on market $149,900 Active 15 DOM
-
2026-06-15days on market $149,900 Active 14 DOM
-
2026-06-14days on market $149,900 Active 12 DOM
-
2026-06-10days on market $149,900 Active 9 DOM
-
2026-06-09days on market $149,900 Active 8 DOM
-
2026-06-08days on market $149,900 Active 7 DOM
-
2026-06-07days on market $149,900 Active 6 DOM
-
2026-06-03days on market $149,900 Active 2 DOM
-
2026-06-02remarks 699-char remark
-
2026-06-02$149,900 Active 1 DOM
ⓘ Source: listings_history table (triggers on properties + properties_extension) + one-shot
backfill from property_details.listing_events for pre-trigger history.
Tax reassessment forecast OH · Partial reset (capped growth)
- Current annual tax
- $1,504 · $125/mo
- Projected year-2 tax
- $1,921 · $160/mo
- Expected delta
- +$417/yr (+$35/mo · 27.7%)
ⓘ Screening estimate from a state-policy table — verify with the county assessor before closing.
Climate risk First Street
- Flood 4/10 Moderate FEMA zone X (unshaded) · 20% chance over 30 yrs
- Wildfire 1/10 Low
- Heat 3/10 Moderate 7 d/yr ≥96°F today · 17 d/yr by 30 yrs out
- Wind 1/10 Low
- Air quality 2/10 Low 0 unhealthy d/yr today · 1 by 30 yrs out
Nearby sold comps map
Loading sold comps map…
Walkable amenities ~0.75 mi
Loading nearby amenities…
Taxation est. · year 1
- Rental income
- $20,673
- − Mortgage interest
- −$8,397
- − Property taxes
- −$1,504
- − Insurance
- −$750
- − Repairs & maintenance
- −$1,654
- − Management
- −$1,654
- − Depreciation
- −$4,361
- Taxable income
- $2,354
- Est. tax owed @ 24.0%
- −$565
- After-tax cash flow
- $4,080/yr
For passive investors: Depreciation is non-cash, so a rental often shows a tax loss while cash-flowing — sheltering income. Rental losses are passive: they offset passive income freely, and up to $25,000/yr can offset ordinary (W-2) income if you actively participate and your MAGI is under $100k (phasing out to $0 by $150k); unused losses carry forward. On sale, claimed depreciation is recaptured at up to 25%, and gains may owe capital-gains tax (a 1031 exchange can defer both). Figures are a year-1 estimate at your 24.0% rate — not tax advice; consult a CPA.
Schools (NCES district)
- District
- Barberton City
- NCES district ID
- 3904353
- Math proficiency
- 47% ▼ -9.00%
- Reading proficiency
- 51% ▼ -9.00%
- Median HH income
- $37,660
- Composite
- 40.77/100
- National rank
- #3646
- State rank
- #466 of 656 in OH
Livability — Barberton
- Score
- 71/100
- State rank
- #428
- US rank
- #7016
Category grades
Schools grade is shown separately in the Schools card above.
Census & demographics
- Census place
- Barberton, OH
- County
- Summit County · 440,783 people
- City population
- 38,701
- Metro
- Akron, OH
- Population (ZIP)
- 38,701
- Household income
- $63,759
- Rent vs Own
- Severe rent burden
- 805.0
Population outlook (Summit County) Hauer SSP2
- Today (2025)
- 546,583 people
- By 2030
- 544,028 · -0.5%
- By 2040
- 531,363 · -2.8%
- By 2050
- 514,923 · -5.8%
- By 2075
- 481,765 · -11.9%
- By 2100
- 432,265 · -20.9%
Race, ethnicity, and origin ACS 2023
- Neighborhood character
- Predominantly White (86%)
- Race & ethnicity
- White 86% Black 7% Two or more races 5% Hispanic / Latino 1%
- Common ancestry
- Romanian 3% Slovak 2% Italian 1%
- Foreign-born
- 2% · Canada
- Languages at home
- 97% English-only · Russian/Polish/Slavic 1% Spanish 1%
Political lean MEDSL · Summit
- 2024 margin
- Lean D (+7.0) · D 53.0% · R 46.0%
- 2008→2024 swing
- -9.6pp toward R · 2008: 16.6pp · 2024: 7.0pp
- All cycles
- 2024: D+7.0 2020: D+9.6 2016: D+8.2 2012: D+14.8 2008: D+16.6
Not yet ingested
- Civics
- —
Market trends
- HPI YoY
- ▼ -224.82%
- Current HPI
- 199.8143
- Rent YoY
- ▲ 5.86%
- Metro
- Akron, OH
- State GDP YoY
- ▲ 1.98%
- F500 in state
- 48
Industry mix (Fortune 500 HQ in OH)
| Industry | F500 HQs | Revenue |
|---|---|---|
| Insurance | 3 | $145B |
|
||
| Industrial Machinery | 3 | $49B |
|
||
| Financial Services | 3 | $24B |
|
||
| Consumer Goods | 2 | $93B |
|
||
| Aerospace / Defense | 2 | $47B |
|
||
| Utilities | 2 | $33B |
|
||
Price history
+252.7% since first listed17 events — show timeline
- 2026-06-01 Listed $149,900 MLSNOW
- 2026-04-26 Listing Removed — MLSNOW
- 2026-04-13 Price Changed $139,900 MLSNOW
- 2026-03-16 Price Changed $149,900 MLSNOW
- 2026-03-10 Price Changed $159,000 MLSNOW
- 2026-02-20 Listed $164,900 MLSNOW
- 2023-11-13 Listing Removed — MLSNOW
- 2023-10-04 Price Changed $156,000 MLSNOW
- 2023-09-12 Listed $158,000 MLSNOW
- 2022-06-02 Sold (Public Records) $154,000 Public Records
- 2005-09-10 Listing Removed — MLSNOW
- 2005-09-10 Listing Removed — MLSNOW
- 2005-02-09 Listed $72,900 MLSNOW
- 2005-02-09 Listed $72,900 MLSNOW
- 2002-03-07 Listed $27,500 MLSNOW
- 1993-12-15 Sold (Public Records) $38,500 Public Records
- 1993-09-24 Listed $42,500 MLSNOW
Property tax history
+2.1%/yrLatest (2025): $1,504 · +23.7% YoY. Source: county tax records.
Cash-flow waterfall
monthlySold comps — $/sqft
last 12 mo · ≤1 miLoading sold comps…