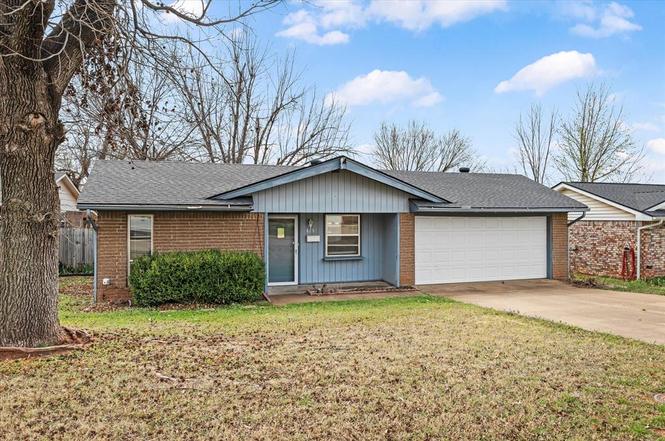
815 E Lamplighter Cir · Guthrie, OK
Flood risk 1/10 · Minimal
- FEMA flood zone
- X (unshaded)
- Chance of flooding over 30 yrs
- 0.0%
- Est. flood insurance / yr
- $507 – $1,088
Fire risk 4/10 · Minor
- Est. fire insurance / yr
- $2,463 – $4,575
Heat risk 6/10 · Moderate
- Hot days now (above 109°F)
- 7 days/yr
- Hot days in 30 yrs
- 19 days/yr
Wind risk 2/10 · Minimal
- Chance of severe wind over 30 yrs
- 4.0%
Air-quality risk 2/10 · Minimal
- Unhealthy air days now
- 2 days/yr
- Unhealthy air days in 30 yrs
- 2 days/yr
Risk factors via First Street. Map © Google.
Why this score? — see what drove the D+ grade
The composite is a weighted blend of 9 inputs, each scored 0–100. Each bar is that input's sub-score; the figure is the points it added to the 100-point composite (weight × sub-score).
- Cash flow +19.2/30.0
- DSCR +6.1/10.0
- Rent growth +5.0/5.0
- 1% rule +4.2/10.0
- Livability +3.7/5.0
- ARV discount +3.2/15.0
- Condition / age +2.5/5.0
- Schools +2.1/10.0
- Appreciation +0.0/10.0
$167,500
🖨 Deal sheet 📄 Offer letter ✓ Due diligence
Listing remarks
Charming 3-Bedroom Home. This cozy 1,027 sq ft home features 3 bedrooms, 1 full bath, and 1 half bath, making it a perfect option for first-time buyers or investors. Nestled in a quiet neighborhood on a cul-de-sac, the property offers both privacy and convenience. Enjoy outdoor living with a 10X10 covered back patio, ideal for relaxing or entertaining. The spacious fenced backyard provides plenty of room for pets, gardening, or gatherings and includes an 8X8 storage shed for extra space. Whether you're looking for your first home or a great investment property, this home offers comfort, functionality, and potential. Offering As-is
Key facts
- Storage shed
- Covered back patio
- Quiet neighborhood
Tags
Property features AI
Finance
- Other: Cul-de-sac lot; Located in Highland Heights #3 addition; Homestead not indicated; Flood insurance not indicated; Occupied: No; Home warranty: No; Listing status: Active; Living area reported as 1,027 (assessor)
- Financial info: Loan qualifying available; Assumable loans not available
- HOA & community: No mandatory association dues
Exterior
- Parking: 1-car garage
- Utilities: Manual geocode source
- Home design: Single family residence; One level; North-facing; Residential property
- Construction: Brick and frame construction; Frame construction; Composition roof; Combination foundation; Built (existing)
- Exterior features: Covered patio; Storage
Interior
- Bedrooms: 3 bedrooms
- Bathrooms: 1 full bath; 1 half bath
- Interior features: No fireplace; No in-law plan
Neighborhood map
What this means for you Summary
Snapshot
- This is a 3-bed/2.0-bath single-family listed at $168k.
Deal economics
- At list price, monthly cash flow is $181 ($2k/yr) — positive.
- The deal already cash-flows at list — no discount required.
- To meet the 1% rule (rent ≥ 1% of price), the offer needs to be $154k (8.2% below list).
- Recommended offer: $154k (8.2% below list) — sets the bar for 1% rule.
- Cap rate 7.6% vs local median 3.0% in Guthrie — top-decile yield for the area; either an underpriced asset or a hidden risk that comps aren't pricing in. Stress-test before assuming the spread holds.
Location & tenants
- Location reads 74/100 on livability (#15 in OK, #4,696 nationally) — a middle-class / working-renter tenant base. Strengths: cost of living A+, housing A+, health & safety A+; Watch: amenities F, commute F.
- Guthrie (town): math 24% / reading 24% proficiency, ranked #119 of 270 in OK (top 44%) — low school quality limits family demand, transient renter base, plan for 1-2y turnover.
- Zoned schools: Fogarty Es (math 47% / reading 37%, grade F, #84 of 845 statewide, top 11%, 438 students, 0% FRL); Guthrie Hs (math 22% / reading 32%, grade F, #125 of 447 statewide, top 31%, 1,025 students, 0% FRL) — zoned schools average 0% FRL vs 55% district-wide (55 pts lower); this property's tenant base skews higher-income than the district average.
- Market conditions: Rents rising fast (+12.2%/yr); 843 active listings in the ZIP; 3 comparable units currently listed for rent nearby; rentals leasing fast (median 11d on market — plan ~1-2 weeks tenant-placement turnaround); 102 units permitted in Logan County in 2024 (0 in 5+ unit buildings).
Forward outlook
- Local home prices are declining (-3.0%/yr); year-one equity from $1k of loan paydown is wiped out by about $5k of value loss. Plan a longer hold.
- Logan County population projected at +36% by 2050 — long-run rental-demand tailwind backs the buy-and-hold thesis.
- At projected returns (-3.0% appreciation + 8.0% rent growth), your $47k cash investment doubles in ~10 years — after that, you're playing with house money.
Negotiation context
- It's been on market 70 days — a 6% lower offer ($157k) is reasonable based on typical stale-listing flexibility.
- Current owner paid $88k; list at $168k implies a 91% gain — meaningful room to come down on a strong offer.
Risks & watch-outs
- Climate carrying-cost: extreme-heat days projected 7→19/yr by 2055 (HVAC capex compounding) — expect insurance premiums to compound above CPI over the hold.
Questions for the listing agent
- It's been on market 70 days. Have you received any prior offers? Is the seller open to a 8% concession, seller financing, or rate buy-down credit?
- Built in 1971 — when were the roof, HVAC, electrical panel, plumbing, and water heater last replaced?
- Why hasn't it sold? Are there any deal-killer items the seller is aware of (foundation, flood, title, zoning, code violations)?
- Is there a deadline driving the sale (1031 exchange, divorce, estate, relocation)? That informs how much negotiation room exists.
- Schools are F-rated, which usually means shorter tenancies and higher turnover. Who's the typical renter profile here, and what's been the actual vacancy rate?
- The area grade is low — what's the realistic commute time and amenity access for the typical tenant pool here? Any planned neighborhood developments (good or bad) we should know about?
- What's the average days-on-market for RENTAL listings here right now (not sales)? A rising rental-DOM trend means longer vacancies and softer asking-rent achievability than the comps imply.
- What's the recent tenant-quality profile in this submarket — average credit score on applications, eviction rate, late-payment / NSF rate, and stable-employment percentage? A property-management company in the area should have these aggregated.
- How much new for-sale + rental construction is in the pipeline within 1–3 miles? Heavy new supply typically softens prices + rents 12–24 months out; constrained supply supports both.
Investment metrics
- 1% rule
- 0.92% ✗
- Cap rate
- 7.59%
- Cash-on-cash
- 4.64%
- DSCR
- 1.21
- GRM
- 9.1
CMA / ARV
- ARV (on-the-fly)
- $153,023
- Comps found
- 11
Show comp detail 11 sales within ~0.75 mi
| Address | Dist | Beds/Ba | Sqft | Sold | Price | $/sf | Match |
|---|---|---|---|---|---|---|---|
| 1408 N Elm St | 0.20mi | 3/2.0 | 902 (-12%) | 10mo | $169,500 | $188 | 62 |
| 716 N Wentz St | 0.58mi | 3/2.0 | 1,033 (+1%) | 12mo | $185,000 | $179 | 62 |
| 406 E Logan Ave | 0.55mi | 2/1.0 (-1) | 1,018 (-1%) | 10mo | $200,000 | $196 | 56 |
| 317 N Cypress St | 0.71mi | 3/1.0 | 1,040 (+1%) | 12mo | $150,000 | $144 | 50 |
| 621 N Wentz St | 0.64mi | 2/1.0 (-1) | 966 (-6%) | 6mo | $115,000 | $119 | 46 |
| 528 E Hill Dr | 0.19mi | 2/1.0 (-1) | 885 (-14%) | 22mo | $147,500 | $167 | 40 |
| 415 N Wentz St | 0.74mi | 2/2.0 (-1) | 1,125 (+10%) | 8mo | $87,500 | $78 | 38 |
| 812 N Wentz St | 0.54mi | 2/2.0 (-1) | 1,139 (+11%) | 18mo | $135,000 | $119 | 37 |
| 808 Pinebrook Dr | 0.66mi | 3/1.5 | 1,156 (+13%) | 14mo | $177,000 | $153 | 34 |
| 316 N Broad St | 0.75mi | 2/1.5 (-1) | 1,140 (+11%) | 8mo | $132,500 | $116 | 34 |
| 1026 Shady Creek Cir | 0.72mi | 3/1.5 | 1,176 (+14%) | 18mo | $175,500 | $149 | 25 |
Match score weights: distance 35% · size 25% · config 20% · recency 20%. Top-matched comps best support the ARV.
Projected returns pro-forma
-3.0% appreciation · 8.0% rent growth · sell at horizon
- IRR
- -4.1%
- Equity multiple
- 0.84×
- Total profit
- $-7,514
- Equity at exit
- $24,975
- IRR
- 10.2%
- Equity multiple
- 1.96×
- Total profit
- $45,096
- Equity at exit
- $14,482
Cash invested: $46,900 (down + closing). Projections, not guarantees.
Landlord ↔ Tenant lean methodology
- Overall (STATE)
- 83 Strongly Landlord-Friendly
- State Oklahoma
- 83 Strongly Landlord-Friendly · R+20
- County
- — inherits STATE
- City
- — inherits STATE
ZIP-level market 73044
- Home prices YoY
- -25.9%
- Rents YoY
- 12.2%
- Active inventory
- 843
- Price-to-rent
- 9.1×
Monthly cashflow live
- Estimated rent
- $1,537 medium interval (Pro) →
- Mortgage (P&I)
- −$878
- Tax from tax record
- −$85 /mo · $1,016/yr
- Insurance
- −$70
- HOA
- −$0
- Vacancy / Maint / Mgmt
- −$323
- Net cashflow
- $181
Break-even live
UW: 25.0% down · 7.5% · 30yr · 1.5% tax · 5.0% vac · 8.0% maint · 8.0% mgmt
Financing live
Cash to close
- Down payment
- $41,875
- Closing costs
- $5,025
- Reserves months
- —
- Total cash needed
- —
Loan-product check · same deal, 3 products live
Conventional
25% down · 7.5% · 30yr
- Down + closing
- —
- Monthly P&I
- —
- Monthly cashflow
- —
- DSCR
- —
- Eligible?
- —
Personal DTI + credit; lowest rate.
DSCR
20% down · 8.5% · 30yr
- Down + closing
- —
- Monthly P&I
- —
- Monthly cashflow
- —
- DSCR
- —
- Eligible?
- —
No personal income docs; deal must DSCR.
Hard money
10% down · 12.0% · 12mo
- Down + closing
- —
- Monthly P&I
- —
- Monthly cashflow
- —
- DSCR
- —
- Eligible?
- —
Short-term bridge; refi at stabilization.
Rent comps 3 comps
| Address | Beds | Baths | Sqft | Rent | $/sqft | DOM | Units | Dist |
|---|---|---|---|---|---|---|---|---|
| 409 E Hill Dr Guthrie, OK | 3.0 | 2.0 | 1305 | $1,445 | $1.11 | 10d | 1 | 0.29mi |
| 520 E Springer Ave Guthrie, OK | 2.0 | 2.0 | 1092 | $1,300 | $1.19 | 24d | 1 | 1.04mi |
| 406 S Pine St Guthrie, OK | 4.0 | 1.0 | 1272 | $1,400 | $1.10 | 2d | 1 | 1.17mi |
Listing history 5 events
-
2026-05-24status Pending
-
2026-03-15$167,500 Active
-
2015-09-03soldstatus $87,500
-
2003-10-26soldstatus $66,000
-
1987-10-07soldstatus $44,500
ⓘ Source: listings_history table (triggers on properties + properties_extension) + one-shot
backfill from property_details.listing_events for pre-trigger history.
Tax reassessment forecast OK · Resets to sale price
- Current annual tax
- $1,016 · $85/mo
- Projected year-2 tax
- $1,507 · $126/mo
- Expected delta
- +$491/yr (+$41/mo · 48.4%)
ⓘ Screening estimate from a state-policy table — verify with the county assessor before closing.
Climate risk First Street
- Flood 1/10 Low FEMA zone X (unshaded) · 0% chance over 30 yrs
- Wildfire 4/10 Moderate
- Heat 6/10 Major 7 d/yr ≥109°F today · 19 d/yr by 30 yrs out
- Wind 2/10 Low 4% chance of damaging wind over 30 yrs
- Air quality 2/10 Low 2 unhealthy d/yr today · 2 by 30 yrs out
Nearby sold comps map
Loading sold comps map…
Walkable amenities ~0.75 mi
Loading nearby amenities…
Taxation est. · year 1
- Rental income
- $18,445
- − Mortgage interest
- −$9,383
- − Property taxes
- −$1,016
- − Insurance
- −$838
- − Repairs & maintenance
- −$1,476
- − Management
- −$1,476
- − Depreciation
- −$4,873
- Taxable loss
- −$615
- Est. tax savings @ 24.0%
- +$148
- After-tax cash flow
- $2,325/yr
For passive investors: Depreciation is non-cash, so a rental often shows a tax loss while cash-flowing — sheltering income. Rental losses are passive: they offset passive income freely, and up to $25,000/yr can offset ordinary (W-2) income if you actively participate and your MAGI is under $100k (phasing out to $0 by $150k); unused losses carry forward. On sale, claimed depreciation is recaptured at up to 25%, and gains may owe capital-gains tax (a 1031 exchange can defer both). Figures are a year-1 estimate at your 24.0% rate — not tax advice; consult a CPA.
Schools (NCES district)
- District
- Guthrie
- NCES district ID
- 4013560
- Math proficiency
- 24% ▼ -7.00%
- Reading proficiency
- 24% ▼ -2.00%
- Median HH income
- $45,370
- Composite
- 20.79/100
- National rank
- #8513
- State rank
- #119 of 270 in OK
Livability — Guthrie
- Score
- 74/100
- State rank
- #15
- US rank
- #4696
Category grades
Schools grade is shown separately in the Schools card above.
Census & demographics
- Census place
- Guthrie, OK
- County
- Logan County · 25,398 people
- City population
- 25,398
- Metro
- Oklahoma City, OK
- Population (ZIP)
- 25,398
- Household income
- $72,288
- Rent vs Own
- Severe rent burden
- 397.0
Population outlook (Logan County) Hauer SSP2
- Today (2025)
- 55,683 people
- By 2030
- 60,011 · +7.8%
- By 2040
- 68,071 · +22.2%
- By 2050
- 75,815 · +36.2%
- By 2075
- 94,749 · +70.2%
- By 2100
- 108,057 · +94.1%
Race, ethnicity, and origin ACS 2023
- Neighborhood character
- Predominantly White (77%)
- Race & ethnicity
- White 77% Two or more races 10% Hispanic / Latino 8% Black 6% Native American 3%
- Hispanic origin (detail)
- Mexican 7%
- Common ancestry
- Slovak 3% Lithuanian 3% Italian 2%
- Foreign-born
- 3% · Canada
- Languages at home
- 94% English-only · Spanish 6%
Political lean MEDSL · Logan
- 2024 margin
- Solid R (+49.0) · D 24.4% · R 73.5% · Other 2.1%
- 2008→2024 swing
- -11.6pp toward R · 2008: -37.4pp · 2024: -49.0pp
- All cycles
- 2024: R+49.0 2020: R+47.1 2016: R+49.5 2012: R+44.8 2008: R+37.4
Not yet ingested
- Civics
- —
Market trends
- HPI YoY
- ▼ -86.90%
- Current HPI
- 247.9481
- Rent YoY
- ▲ 12.22%
- Metro
- Oklahoma City, OK
- State GDP YoY
- ▲ 1.55%
- F500 in state
- 6
Industry mix (Fortune 500 HQ in OK)
| Industry | F500 HQs | Revenue |
|---|---|---|
| Energy | 3 | $48B |
|
||
Price history
+276.4% since first listed5 events — show timeline
- 2026-05-24 Pending — MLSOK
- 2026-03-15 Listed $167,500 MLSOK
- 2015-09-03 Sold (Public Records) $87,500 Public Records
- 2003-10-26 Sold (Public Records) $66,000 Public Records
- 1987-10-07 Sold (Public Records) $44,500 Public Records
Property tax history
+4.7%/yrLatest (2025): $1,016 · +6.6% YoY. Source: county tax records.
Cash-flow waterfall
monthlySold comps — $/sqft
last 12 mo · ≤1 miLoading sold comps…