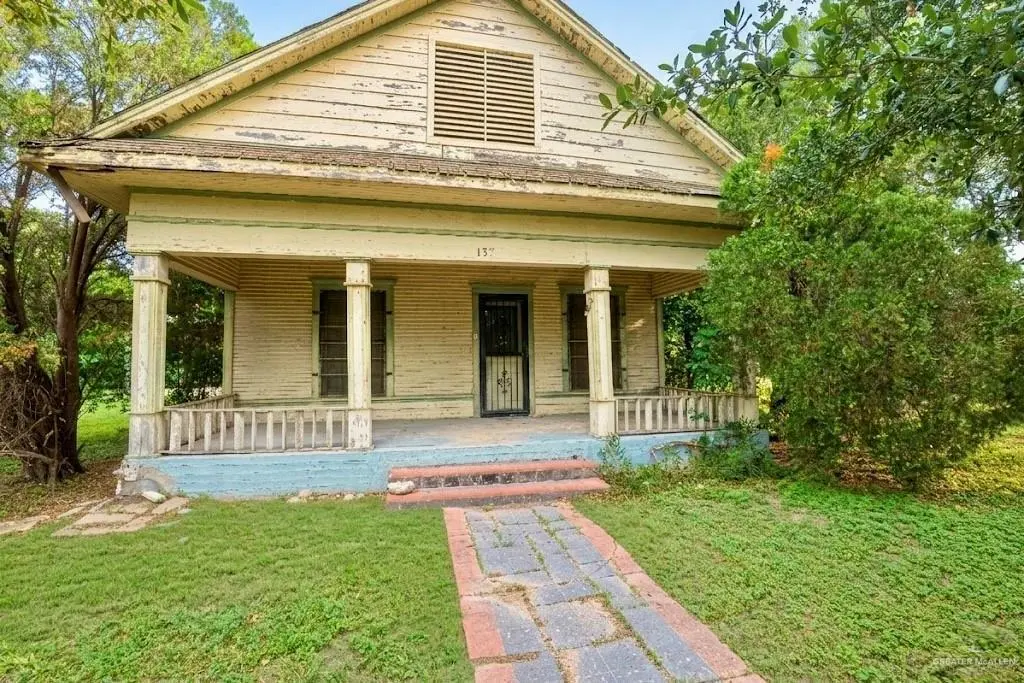
137 Deanna Dr · San Juan, TX
Flood risk 4/10 · Minor
- FEMA flood zone
- X (shaded)
- Chance of flooding over 30 yrs
- 0.24%
- Est. flood insurance / yr
- $507 – $1,088
Fire risk 1/10 · Minimal
- Est. fire insurance / yr
- $1,222 – $2,270
Heat risk 9/10 · Severe
- Hot days now (above 111°F)
- 7 days/yr
- Hot days in 30 yrs
- 23 days/yr
Wind risk 8/10 · Major
- Chance of severe wind over 30 yrs
- 99.0%
Air-quality risk 3/10 · Minor
- Unhealthy air days now
- 1 days/yr
- Unhealthy air days in 30 yrs
- 4 days/yr
Risk factors via First Street. Map © Google.
Why this score? — see what drove the C+ grade
The composite is a weighted blend of 9 inputs, each scored 0–100. Each bar is that input's sub-score; the figure is the points it added to the 100-point composite (weight × sub-score).
- Cash flow +22.8/30.0
- ARV discount +15.0/15.0
- DSCR +7.3/10.0
- 1% rule +6.3/10.0
- Livability +3.6/5.0
- Rent growth +2.5/5.0
- Condition / age +2.5/5.0
- Schools +2.0/10.0
- Appreciation +0.0/10.0
$100,000
🖨 Deal sheet 📄 Offer letter ✓ Due diligence
Listing remarks
ATTENTION INVESTORS & FLIPPERS: CASH ONLY! Rare opportunity to secure a 1940s vintage bungalow on a massive 12,040 sq. ft. lot. Property is being sold strictly AS-IS, CASH ONLY—perfect for a quick close and your next high-margin rehab or flip. This unique pier-and-beam residence features a classic partitioned floor plan, iconic front porch, and carport. Huge value-add potential: the expansive attic boasts enough footprint to convert into two additional bedrooms, instantly maximizing your ROI. Deep, mature lot located with convenient access to local shopping, dining, and main thoroughfares. Properties with this much land and upside are rare. Bring your cash offers today!
Key facts
- Expansive attic
- Carport
- Massive lot
Tags
Property features AI
Finance
- HOA & community: No association
Exterior
- Parking: One covered parking space; Carport (1 space); Detached parking
- Utilities: Public water; City sewer; Electric service
- Home design: Seller-measured living area
- Construction: Frame/wood construction; Wood siding; Wood shingle/shake roof; Crawl space foundation with pillar/post/pier
- Exterior features: Mature trees; Covered patio; Patio slab; Chain link fencing; Paved road access; Irregular lot
Interior
- Kitchen: Electric water heater; No conveying appliances
- Flooring: Carpet; Hardwood; Vinyl
- Bathrooms: Three full bathrooms
- Heating & cooling: Central heating (electric); Central air conditioning (electric); Thermostat
- Interior features: Ceiling fan(s); Countertops (other); Drapes
- Laundry & utility: Laundry area with washer/dryer connection
Neighborhood map
What this means for you Summary
Snapshot
- This is a 2-bed/2.0-bath single-family listed at $100k.
Deal economics
- At list price, monthly cash flow is $174 ($2k/yr) — positive.
- The deal already cash-flows at list — no discount required.
- Meets the 1% rule at list price ($1k rent vs $100k).
- Cap rate 8.4% vs local median 3.4% in San Juan — top-decile yield for the area; either an underpriced asset or a hidden risk that comps aren't pricing in. Stress-test before assuming the spread holds.
Location & tenants
- Location reads 71/100 on livability (#294 in TX) — a middle-class / working-renter tenant base. Strengths: cost of living A+, housing A+, health & safety A+; Watch: amenities F, commute F, employment D-.
- Pharr-San Juan-Alamo ISD (suburban): math 18% / reading 30% proficiency, ranked #740 of 826 in TX (top 90%) — low school quality limits family demand, transient renter base, plan for 1-2y turnover; 72% free/reduced lunch — lower-income household profile, screen leases tightly.
- Zoned schools: John Doedyns El (math 12% / reading 22%, grade F, #3,836 of 4,322 statewide, top 91%, 442 students, 92% FRL) — zoned schools average 92% FRL vs 72% district-wide (21 pts higher); higher-poverty schools than district average — tighter screening recommended.
- Market conditions: 362 active listings in the ZIP; 14 comparable units currently listed for rent nearby; rentals at typical pace (median 24d on market — plan ~3-4 weeks tenant-placement turnaround); 43% of comp listings sitting > 30 days — soft ceiling on asking rent; 7,378 units permitted in Hidalgo County in 2024 (641 in 5+ unit buildings).
Forward outlook
- Local home prices are declining (-3.0%/yr); year-one equity from $691 of loan paydown is wiped out by about $3k of value loss. Plan a longer hold.
- Hidalgo County population projected at +28% by 2050 — long-run rental-demand tailwind backs the buy-and-hold thesis.
Negotiation context
- Only 12 days on market — expect competitive offers; lowballing is unlikely to land.
- 2 sale attempts with the ask held roughly flat each time — persistent listings suggest the price (not the market) is what's stuck; bring a comps-based counter.
Risks & watch-outs
- Watch-outs: built in 1940 — expect roof / HVAC / electrical / plumbing capex.
- Climate carrying-cost: severe wind risk, 99% chance of damaging wind over 30y; extreme-heat days projected 7→23/yr by 2055 (HVAC capex compounding) — expect insurance premiums to compound above CPI over the hold.
Questions for the listing agent
- Built in 1940 — when were the roof, HVAC, electrical panel, plumbing, and water heater last replaced?
- Is there a deadline driving the sale (1031 exchange, divorce, estate, relocation)? That informs how much negotiation room exists.
- Schools are D-rated, which usually means shorter tenancies and higher turnover. Who's the typical renter profile here, and what's been the actual vacancy rate?
- What's the average days-on-market for RENTAL listings here right now (not sales)? A rising rental-DOM trend means longer vacancies and softer asking-rent achievability than the comps imply.
- What's the recent tenant-quality profile in this submarket — average credit score on applications, eviction rate, late-payment / NSF rate, and stable-employment percentage? A property-management company in the area should have these aggregated.
- How much new for-sale + rental construction is in the pipeline within 1–3 miles? Heavy new supply typically softens prices + rents 12–24 months out; constrained supply supports both.
Investment metrics
- 1% rule
- 1.13% ✓
- Cap rate
- 8.39%
- Cash-on-cash
- 7.48%
- DSCR
- 1.33
- GRM
- 7.4
CMA / ARV
- ARV (on-the-fly)
- $123,840
- Comps found
- 4
Show comp detail 4 sales within ~0.75 mi
| Address | Dist | Beds/Ba | Sqft | Sold | Price | $/sf | Match |
|---|---|---|---|---|---|---|---|
| 205 San Diego Cir | 0.24mi | 3/1.0 (+1) | 1,008 (+5%) | 18mo | $130,000 | $129 | 57 |
| 1210 Northpoint Dr | 0.63mi | 3/1.0 (+1) | 914 (-5%) | 2mo | $145,000 | $159 | 52 |
| 609 Alameda St | 0.66mi | 2/1.0 | 1,040 (+8%) | 19mo | $80,000 | $77 | 36 |
| 201 E Merry Way Ave | 0.68mi | 3/2.0 (+1) | 1,092 (+14%) | 14mo | $100,000 | $92 | 29 |
Match score weights: distance 35% · size 25% · config 20% · recency 20%. Top-matched comps best support the ARV.
Projected returns pro-forma
-3.0% appreciation · 3.0% rent growth · sell at horizon
- IRR
- -4.8%
- Equity multiple
- 0.82×
- Total profit
- $-5,060
- Equity at exit
- $14,910
- IRR
- 4.9%
- Equity multiple
- 1.36×
- Total profit
- $10,038
- Equity at exit
- $8,646
Cash invested: $28,000 (down + closing). Projections, not guarantees.
Landlord ↔ Tenant lean methodology
- Overall (STATE)
- 87 Strongly Landlord-Friendly
- State Texas
- 87 Strongly Landlord-Friendly · R+5
- County
- — inherits STATE
- City
- — inherits STATE
ZIP-level market 78589
- Home prices YoY
- -12.1%
- Active inventory
- 362
- Price-to-rent
- 7.4×
Monthly cashflow live
- Estimated rent
- $1,131 high interval (Pro) →
- Mortgage (P&I)
- −$524
- Tax from tax record
- −$153 /mo · $1,833/yr
- Insurance
- −$42
- HOA
- −$0
- Vacancy / Maint / Mgmt
- −$237
- Net cashflow
- $174
Break-even live
UW: 25.0% down · 7.5% · 30yr · 1.5% tax · 5.0% vac · 8.0% maint · 8.0% mgmt
Financing live
Cash to close
- Down payment
- $25,000
- Closing costs
- $3,000
- Reserves months
- —
- Total cash needed
- —
Loan-product check · same deal, 3 products live
Conventional
25% down · 7.5% · 30yr
- Down + closing
- —
- Monthly P&I
- —
- Monthly cashflow
- —
- DSCR
- —
- Eligible?
- —
Personal DTI + credit; lowest rate.
DSCR
20% down · 8.5% · 30yr
- Down + closing
- —
- Monthly P&I
- —
- Monthly cashflow
- —
- DSCR
- —
- Eligible?
- —
No personal income docs; deal must DSCR.
Hard money
10% down · 12.0% · 12mo
- Down + closing
- —
- Monthly P&I
- —
- Monthly cashflow
- —
- DSCR
- —
- Eligible?
- —
Short-term bridge; refi at stabilization.
Rent comps 14 comps
| Address | Beds | Baths | Sqft | Rent | $/sqft | DOM | Units | Dist |
|---|---|---|---|---|---|---|---|---|
| 234 W Jaime St San Juan, TX | 2.0 | 1.0 | 1012 | $1,150 | $1.14 | 23d | 1 | 0.17mi |
| 300 W Amy Dr Unit C San Juan, TX | 2.0 | 2.0 | 958 | $995 | $1.04 | 44d | 1 | 0.44mi |
| 103 E Segment Leonel Trevino Rd Unit C San Juan, TX | 2.0 | 2.0 | 962 | $1,075 | $1.12 | 44d | 1 | 0.69mi |
| 203 Encino Dr San Juan, TX | 3.0 | 2.0 | 969 | $1,500 | $1.55 | 23d | 1 | 0.78mi |
| 1109 Del Monte Dr San Juan, TX | 3.0 | 2.0 | 989 | $1,300 | $1.31 | 44d | 1 | 0.90mi |
| 913 Athol St San Juan, TX | 2.0 | 1.0 | 650 | $800 | $1.23 | 23d | 1 | 1.05mi |
| 913 Athol St San Juan, TX | 2.0 | 1.0 | 650 | $850 | $1.31 | 44d | 1 | 1.05mi |
| 3841 N Mezcal Dr Unit Upstairs Pharr, TX | 3.0 | 2.0 | 1050 | $1,150 | $1.10 | 14d | 1 | 1.19mi |
| 3814 N Mezcal Dr Unit Downstairs Pharr, TX | 3.0 | 2.0 | 1050 | $1,250 | $1.19 | 44d | 1 | 1.19mi |
| 304 S Ridge Ln Unit 1 San Juan, TX | 2.0 | 2.0 | 1120 | $975 | $0.87 | 44d | 1 | 1.24mi |
| 105 Lauryn Dr Unit 3 San Juan, TX | 2.0 | 2.0 | 948 | $1,150 | $1.21 | 23d | 1 | 1.28mi |
| 304 Lauryn Dr Unit 1 San Juan, TX | 2.0 | 2.0 | 948 | $1,195 | $1.26 | 23d | 1 | 1.30mi |
| 200 Lauryn Dr Unit 4 San Juan, TX | 2.0 | 2.0 | 950 | $1,275 | $1.34 | 14d | 1 | 1.31mi |
| 2700 N Birch St Unit B Pharr, TX | 3.0 | 1.5 | 895 | $900 | $1.01 | 23d | 1 | 1.44mi |
Listing history 12 events
-
2026-06-18days on market $100,000 Active 12 DOM
-
2026-06-17days on market $100,000 Active 11 DOM
-
2026-06-16days on market $100,000 Active 10 DOM
-
2026-06-15days on market $100,000 Active 9 DOM
-
2026-06-14days on market $100,000 Active 7 DOM
-
2026-06-13remarks 680-char remark
-
2026-06-13days on market $100,000 Active 6 DOM
-
2026-06-10days on market $100,000 Active 4 DOM
-
2026-06-09days on market $100,000 Active 3 DOM
-
2026-06-08days on market $100,000 Active 2 DOM
-
2026-06-07remarks 631-char remark
-
2026-06-07$100,000 Active 1 DOM
ⓘ Source: listings_history table (triggers on properties + properties_extension) + one-shot
backfill from property_details.listing_events for pre-trigger history.
Tax reassessment forecast TX · Resets to sale price
- Current annual tax
- $1,833 · $153/mo
- Projected year-2 tax
- $1,833 · $153/mo
- Expected delta
- $0/yr ($0/mo · 0.0%)
ⓘ Screening estimate from a state-policy table — verify with the county assessor before closing.
Climate risk First Street
- Flood 4/10 Moderate FEMA zone X (shaded) · 24% chance over 30 yrs
- Wildfire 1/10 Low
- Heat 9/10 Extreme 7 d/yr ≥111°F today · 23 d/yr by 30 yrs out
- Wind 8/10 Severe 99% chance of damaging wind over 30 yrs
- Air quality 3/10 Moderate 1 unhealthy d/yr today · 4 by 30 yrs out
Nearby sold comps map
Loading sold comps map…
Walkable amenities ~0.75 mi
Loading nearby amenities…
Taxation est. · year 1
- Rental income
- $13,569
- − Mortgage interest
- −$5,602
- − Property taxes
- −$1,833
- − Insurance
- −$500
- − Repairs & maintenance
- −$1,086
- − Management
- −$1,086
- − Depreciation
- −$2,909
- Taxable income
- $554
- Est. tax owed @ 24.0%
- −$133
- After-tax cash flow
- $1,960/yr
For passive investors: Depreciation is non-cash, so a rental often shows a tax loss while cash-flowing — sheltering income. Rental losses are passive: they offset passive income freely, and up to $25,000/yr can offset ordinary (W-2) income if you actively participate and your MAGI is under $100k (phasing out to $0 by $150k); unused losses carry forward. On sale, claimed depreciation is recaptured at up to 25%, and gains may owe capital-gains tax (a 1031 exchange can defer both). Figures are a year-1 estimate at your 24.0% rate — not tax advice; consult a CPA.
Schools (NCES district)
- District
- Pharr-San Juan-Alamo ISD
- NCES district ID
- 4834860
- Math proficiency
- 18% ▼ -34.00%
- Reading proficiency
- 30% ▼ -11.00%
- Median HH income
- $33,757
- Composite
- 19.63/100
- National rank
- #8744
- State rank
- #740 of 826 in TX
Livability — San Juan
- Score
- 71/100
- State rank
- #294
- US rank
- #6725
Category grades
Schools grade is shown separately in the Schools card above.
Census & demographics
- Census place
- San Juan, TX
- Population (ZIP)
- 39,958
Population outlook (Hidalgo County) Hauer SSP2
- Today (2025)
- 955,232 people
- By 2030
- 1,009,774 · +5.7%
- By 2040
- 1,120,332 · +17.3%
- By 2050
- 1,225,036 · +28.2%
- By 2075
- 1,439,189 · +50.7%
- By 2100
- 1,533,429 · +60.5%
Race, ethnicity, and origin ACS 2023
- Neighborhood character
- Predominantly Hispanic (97%)
- Race & ethnicity
- Hispanic / Latino 97% Two or more races 43% White 3%
- Hispanic origin (detail)
- Mexican 94%
- Foreign-born
- 26% · Canada
- Languages at home
- 18% English-only · Spanish 82%
Political lean MEDSL · Hidalgo
- 2024 margin
- Toss-up / Even · D 48.1% · R 51.0%
- 2008→2024 swing
- -41.6pp toward R · 2008: 38.7pp · 2024: -2.9pp
- All cycles
- 2024: R+2.9 2020: D+17.1 2016: D+40.5 2012: D+41.8 2008: D+38.7
Not yet ingested
- Civics
- —
Market trends
- HPI YoY
- ▼ -32.82%
- Current HPI
- 239.3829
- Rent YoY
- —
- Metro
- —
- State GDP YoY
- ▲ 3.95%
- F500 in state
- 110
Industry mix (Fortune 500 HQ in TX)
| Industry | F500 HQs | Revenue |
|---|---|---|
| Energy | 16 | $1,198B |
|
||
| Technology | 5 | $198B |
|
||
| Engineering / Construction | 4 | $72B |
|
||
| Energy Services | 3 | $60B |
|
||
| Utilities | 3 | $41B |
|
||
| Healthcare | 2 | $330B |
|
||
Price history
-33.3% since first listed3 events — show timeline
- 2026-06-06 Listed $100,000 MCALLENMLS
- 2025-09-02 Price Changed $120,000 MCALLENMLS
- 2025-04-24 Listed $150,000 MCALLENMLS
Property tax history
+4.6%/yrLatest (2025): $1,833 · +9.8% YoY. Source: county tax records.
Cash-flow waterfall
monthlySold comps — $/sqft
last 12 mo · ≤1 miLoading sold comps…