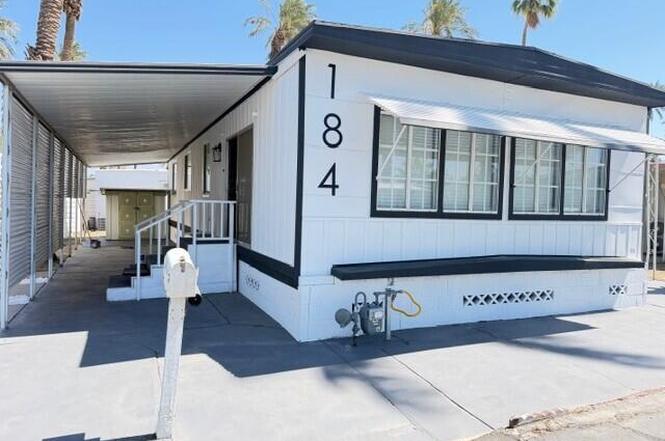
80870 California 111 #184 · Indio, CA
Flood risk 1/10 · Minimal
- FEMA flood zone
- X
- Chance of flooding over 30 yrs
- 0.0%
- Est. flood insurance / yr
- $507 – $1,088
Fire risk 1/10 · Minimal
- Est. fire insurance / yr
- $659 – $1,223
Heat risk 10/10 · Severe
- Hot days now (above 114°F)
- 6 days/yr
- Hot days in 30 yrs
- 17 days/yr
Wind risk 1/10 · Minimal
- Chance of severe wind over 30 yrs
- —
Air-quality risk 4/10 · Minor
- Unhealthy air days now
- 4 days/yr
- Unhealthy air days in 30 yrs
- 5 days/yr
Risk factors via First Street. Map © Google.
Why this score? — see what drove the B+ grade
The composite is a weighted blend of 9 inputs, each scored 0–100. Each bar is that input's sub-score; the figure is the points it added to the 100-point composite (weight × sub-score).
- Cash flow +30.0/30.0
- ARV discount +15.0/15.0
- 1% rule +10.0/10.0
- DSCR +10.0/10.0
- Condition / age +4.0/5.0
- Schools +3.8/10.0
- Rent growth +3.3/5.0
- Livability +2.7/5.0
- Appreciation +0.0/10.0
$75,000
🖨 Deal sheet 📄 Offer letter ✓ Due diligence
Listing remarks
Beautiful manufactured home located in Riverdale Estates 55+ community in Indio. Nicely updated 2 bd, 2 baths, an open floor plan combined with a cozy and clean kitchen and dining area. This gem won't last!
Key facts
- Garage
- Community pool
- Built 1965
Property features AI
Finance
- Other: Park manager approval required; manager: RIVERDALE ESTATES; Park manager phone available
- Financial info: Land is lease type; Land lease annual amount $8,700; Sale terms: cash only; Included in sale: AS IS
- HOA & community: Senior community; Gated community; No monthly association fees listed
Exterior
- Parking: Attached carport; 2 covered spaces; 2 carport spaces; 5 total parking spaces; 1 uncovered/assigned space
- Security: Gated community
- Utilities: Private water; Sewer: unknown; Natural gas available
- Home design: Double wide mobile home; Single story; Ground level entry; Built by builder (year sourced from builder); Senior park (Riverdale Estates)
- Construction: Fleetwood manufacture (model: BROASMORE); Manufacture year 1965; Double wide mobile home; One shed on property
- Exterior features: Gated community; Community pool (heated, in-ground); Community spa (heated, in-ground); Mountain views; Detached property
Interior
- Bedrooms: Ground level (no unit above)
- Flooring: Laminate flooring
- Bathrooms: 2 full bathrooms
- Heating & cooling: Central heating (natural gas); Central air conditioning
- Interior features: Unfurnished; Family room; Living room; No fireplace
- Laundry & utility: Laundry area; Gas water heater
Neighborhood map
What this means for you Summary
Snapshot
- This is a 2-bed/2.0-bath manufactured listed at $75k. Condition is rated good.
Deal economics
- At list price, monthly cash flow is $1k ($15k/yr) — positive.
- The deal already cash-flows at list — no discount required.
- Meets the 1% rule at list price ($2k rent vs $75k).
- Recommended offer: $70k (6.0% below list) — sets the bar for market timing.
- Cap rate 25.7% vs local median 4.3% in Indio — top-decile yield for the area; either an underpriced asset or a hidden risk that comps aren't pricing in. Stress-test before assuming the spread holds.
Location & tenants
- Location reads 53/100 on livability (#927 in CA) — a working-class tenant base; expect higher turnover. Strengths: housing B+; Watch: employment D, schools F, crime F.
- Desert Sands Unified (suburban): math 31% / reading 56% proficiency, ranked #199 of 517 in CA (top 38%) — families likely to look elsewhere, expect single-tenant / working-renter base with shorter leases.
- Market conditions: Rents rising (+3.3%/yr); 514 active listings in the ZIP; 25 comparable units currently listed for rent nearby; rentals at typical pace (median 24d on market — plan ~3-4 weeks tenant-placement turnaround); 40% of comp listings sitting > 30 days — soft ceiling on asking rent; 9,195 units permitted in Riverside County in 2024 (1,512 in 5+ unit buildings).
- This rent runs 39% of the median local income ($67k/yr) — at the standard rent-burdened threshold; future hikes will face affordability resistance.
Forward outlook
- Local home prices are declining (-3.0%/yr); year-one equity from $519 of loan paydown is wiped out by about $2k of value loss. Plan a longer hold.
- Riverside County population projected at +22% by 2050 — long-run rental-demand tailwind backs the buy-and-hold thesis.
- At projected returns (-3.0% appreciation + 3.3% rent growth), your $21k cash investment doubles in ~2 years — after that, you're playing with house money.
Negotiation context
- It's been on market 67 days — a 6% lower offer ($70k) is reasonable based on typical stale-listing flexibility.
- 2 sale attempts with the ask held roughly flat each time — persistent listings suggest the price (not the market) is what's stuck; bring a comps-based counter.
Risks & watch-outs
- Climate carrying-cost: extreme-heat days projected 6→17/yr by 2055 (HVAC capex compounding) — expect insurance premiums to compound above CPI over the hold.
Questions for the listing agent
- It's been on market 67 days. Have you received any prior offers? Is the seller open to a 6% concession, seller financing, or rate buy-down credit?
- Built in 1965 — when were the roof, HVAC, electrical panel, plumbing, and water heater last replaced?
- Why hasn't it sold? Are there any deal-killer items the seller is aware of (foundation, flood, title, zoning, code violations)?
- Is there a deadline driving the sale (1031 exchange, divorce, estate, relocation)? That informs how much negotiation room exists.
- Schools are F-rated, which usually means shorter tenancies and higher turnover. Who's the typical renter profile here, and what's been the actual vacancy rate?
- Crime grade is F in this area — have there been break-ins, vandalism, or insurance claims at this property in the last 3 years? What carrier currently insures it and at what premium?
- What's the average days-on-market for RENTAL listings here right now (not sales)? A rising rental-DOM trend means longer vacancies and softer asking-rent achievability than the comps imply.
- What's the recent tenant-quality profile in this submarket — average credit score on applications, eviction rate, late-payment / NSF rate, and stable-employment percentage? A property-management company in the area should have these aggregated.
- How much new for-sale + rental construction is in the pipeline within 1–3 miles? Heavy new supply typically softens prices + rents 12–24 months out; constrained supply supports both.
Investment metrics
- 1% rule
- 2.92% ✓
- Cap rate
- 25.68%
- Cash-on-cash
- 69.23%
- DSCR
- 4.08
- GRM
- 2.9
CMA / ARV
- ARV (on-the-fly)
- $93,480
- Comps found
- 9
Show comp detail 9 sales within ~0.75 mi
| Address | Dist | Beds/Ba | Sqft | Sold | Price | $/sf | Match |
|---|---|---|---|---|---|---|---|
| 80870 California 111 #184 | 0.00mi | 2/2.0 | 1,140 (0%) | 0mo | $75,000 | $66 | 100 |
| 80870 Highway 111 #95 | 0.12mi | 2/2.0 | 1,152 (+1%) | 2mo | $75,000 | $65 | 91 |
| 80870 Highway 111 #157 | 0.03mi | 2/2.0 | 1,152 (+1%) | 14mo | $189,900 | $165 | 85 |
| 80870 CA-111 #30 | 0.10mi | 2/2.0 | 1,040 (-9%) | 2mo | $69,997 | $67 | 79 |
| 46618 Madison St #153 | 0.26mi | 2/2.0 | 1,056 (-7%) | 3mo | $195,000 | $185 | 74 |
| 80870 Highway 111 #125 | 0.03mi | 2/2.0 | 1,040 (-9%) | 22mo | $85,000 | $82 | 66 |
| 81351 Avenue 46 #64 | 0.60mi | 3/2.0 (+1) | 1,123 (-2%) | 0mo | $142,000 | $126 | 64 |
| 46618 Madison St #8 | 0.20mi | 2/2.0 | 1,272 (+12%) | 11mo | $158,650 | $125 | 62 |
| 80870 Highway 111 Spc 75 | 0.12mi | 2/2.0 | 1,240 (+9%) | 23mo | $75,000 | $60 | 61 |
Match score weights: distance 35% · size 25% · config 20% · recency 20%. Top-matched comps best support the ARV.
Projected returns pro-forma
-3.0% appreciation · 3.34% rent growth · sell at horizon
- IRR
- 69.1%
- Equity multiple
- 4.13×
- Total profit
- $65,795
- Equity at exit
- $11,183
- IRR
- 73.3%
- Equity multiple
- 8.61×
- Total profit
- $159,893
- Equity at exit
- $6,485
Cash invested: $21,000 (down + closing). Projections, not guarantees.
Landlord ↔ Tenant lean methodology
- Overall (STATE)
- 18 Strongly Tenant-Friendly
- State California
- 18 Strongly Tenant-Friendly · D+13
- County
- — inherits STATE
- City
- — inherits STATE
ZIP-level market 92201
- Home prices YoY
- -28.4%
- Rents YoY
- 3.3%
- Active inventory
- 514
- Price-to-rent
- 2.9×
Monthly cashflow live
- Estimated rent
- $2,190 high interval (Pro) →
- Mortgage (P&I)
- −$393
- Tax est. 1.5%
- −$94 /mo · $1,125/yr
- Insurance
- −$31
- HOA
- −$0
- Vacancy / Maint / Mgmt
- −$460
- Net cashflow
- $1,212
Break-even live
UW: 25.0% down · 7.5% · 30yr · 1.5% tax · 5.0% vac · 8.0% maint · 8.0% mgmt
Financing live
Cash to close
- Down payment
- $18,750
- Closing costs
- $2,250
- Reserves months
- —
- Total cash needed
- —
Loan-product check · same deal, 3 products live
Conventional
25% down · 7.5% · 30yr
- Down + closing
- —
- Monthly P&I
- —
- Monthly cashflow
- —
- DSCR
- —
- Eligible?
- —
Personal DTI + credit; lowest rate.
DSCR
20% down · 8.5% · 30yr
- Down + closing
- —
- Monthly P&I
- —
- Monthly cashflow
- —
- DSCR
- —
- Eligible?
- —
No personal income docs; deal must DSCR.
Hard money
10% down · 12.0% · 12mo
- Down + closing
- —
- Monthly P&I
- —
- Monthly cashflow
- —
- DSCR
- —
- Eligible?
- —
Short-term bridge; refi at stabilization.
Rent comps 25 comps
| Address | Beds | Baths | Sqft | Rent | $/sqft | DOM | Units | Dist |
|---|---|---|---|---|---|---|---|---|
| 80870 California 111 Unit 223 Indio, CA | 2.0 | 2.0 | 1400 | $1,550 | $1.11 | 43d | 1 | 0.03mi |
| 80675 Harvard Ct Indio, CA | 3.0 | 2.0 | 1248 | $2,495 | $2.00 | 11d | 1 | 0.49mi |
| 47800 Madison St Indio, CA | 3.0 | 2.0 | 1456 | $2,850 | $1.96 | 43d | 1 | 0.59mi |
| 81272 Palmwood Dr Indio, CA | 3.0 | 2.0 | 1104 | $3,200 | $2.90 | 43d | 1 | 0.73mi |
| 46675 Desert Villa St Indio, CA | 2.0 | 1.0–1.5 | 881 | $1,590 | $1.80 | 43d | 1 | 0.74mi |
| 46896 Jefferson St Indio, CA | 2.0 | 2.0 | 1100 | $2,075 | $1.89 | 3d | 2 | 0.74mi |
| 81153 Francis Ave Indio, CA | 3.0 | 2.0 | 1288 | $2,800 | $2.17 | 5d | 1 | 0.94mi |
| 80208 Royal Birkdale Dr Indio, CA | 2.0 | 2.0 | 1382 | $3,875 | $2.80 | 24d | 1 | 0.96mi |
| 81683 De Plata Ave Indio, CA | 3.0 | 2.0 | 1216 | $3,100 | $2.55 | 18d | 1 | 1.01mi |
| 81641 Avenue 48 Indio, CA | 2.0 | 2.0 | 1440 | $2,500 | $1.74 | 43d | 1 | 1.08mi |
| 47395 Monroe St #286 Indio, CA | 2.0 | 2.0 | 1021 | $2,300 | $2.25 | 24d | 1 | 1.12mi |
| 47395 Monroe St #264 Indio, CA | 3.0 | 2.0 | 1257 | $3,200 | $2.55 | 43d | 1 | 1.12mi |
| 46745 Monroe St Indio, CA | 1.0–2.0 | 1.0–2.0 | 880 | $2,070 | $2.35 | 1d | 11 | 1.14mi |
| 45546 Aladdin St Unit D201 Indio, CA | 2.0 | 1.0 | 907 | $1,549 | $1.71 | 43d | 1 | 1.15mi |
| 81720 Avenue Indio, CA | 2.0 | 2.0 | 1080 | $1,795 | $1.66 | 43d | 1 | 1.16mi |
| 81840 Avenida del Mar Unit A203 Indio, CA | 2.0 | 2.0 | 874 | $1,750 | $2.00 | 24d | 1 | 1.21mi |
| 81777 Avenue 48 Indio, CA | 1.0–2.0 | 1.0 | 820 | $1,950 | $2.38 | 3d | 5 | 1.27mi |
| 82165 Doctor Carreon Blvd Indio, CA | 1.0–2.0 | 1.0–2.0 | 828 | $2,150 | $2.60 | 3d | 11 | 1.33mi |
| 81875 Avenue 48 Indio, CA | 1.0–2.0 | 1.0–2.0 | 804 | $2,185 | $2.72 | 10d | 6 | 1.34mi |
| 81351 Fred Waring Dr Apt 218 Indio, CA | 2.0 | 1.0 | 946 | $1,595 | $1.69 | 43d | 1 | 1.37mi |
| 81351 Fred Waring Dr Unit 215 Indio, CA | 2.0 | 1.0 | 946 | $1,595 | $1.69 | 12d | 1 | 1.37mi |
| 48255 Monroe St #20 Indio, CA | 2.0 | 2.0 | 998 | $2,200 | $2.20 | 24d | 1 | 1.42mi |
| 48255 Monroe St #2 Indio, CA | 1.0 | 1.5 | 867 | $1,899 | $2.19 | 2d | 1 | 1.42mi |
| 48255 Monroe St Indio, CA | 1.0–2.0 | 2.0 | 932 | $2,200 | $2.36 | 43d | 2 | 1.44mi |
| 44313 Larrea St Indio, CA | 3.0 | 2.0 | 1219 | $2,400 | $1.97 | 24d | 1 | 1.44mi |
Listing history 13 events
-
2026-06-16status $75,000 Pending 67 DOM
-
2026-06-15days on market $75,000 Active Under Contract 67 DOM
-
2026-06-13days on market $75,000 Active Under Contract 65 DOM
-
2026-06-09days on market $75,000 Active Under Contract 61 DOM
-
2026-06-08days on market $75,000 Active Under Contract 60 DOM
-
2026-06-07days on market $75,000 Active Under Contract 59 DOM
-
2026-06-04days on market $75,000 Active Under Contract 56 DOM
-
2026-06-03days on market $75,000 Active Under Contract 55 DOM
-
2026-06-02days on market $75,000 Active Under Contract 54 DOM
-
2026-06-01days on market $75,000 Active Under Contract 53 DOM
-
2026-05-31days on market $75,000 Active Under Contract 52 DOM
-
2026-04-10Active Under Contract
-
2026-04-09$75,000
ⓘ Source: listings_history table (triggers on properties + properties_extension) + one-shot
backfill from property_details.listing_events for pre-trigger history.
Climate risk First Street
- Flood 1/10 Low FEMA zone X · 0% chance over 30 yrs
- Wildfire 1/10 Low
- Heat 10/10 Extreme 6 d/yr ≥114°F today · 17 d/yr by 30 yrs out
- Wind 1/10 Low
- Air quality 4/10 Moderate 4 unhealthy d/yr today · 5 by 30 yrs out
Nearby sold comps map
Loading sold comps map…
Walkable amenities ~0.75 mi
Loading nearby amenities…
Taxation est. · year 1
- Rental income
- $26,276
- − Mortgage interest
- −$4,201
- − Property taxes
- −$1,125
- − Insurance
- −$375
- − Repairs & maintenance
- −$2,102
- − Management
- −$2,102
- − Depreciation
- −$2,182
- Taxable income
- $14,189
- Est. tax owed @ 24.0%
- −$3,405
- After-tax cash flow
- $11,133/yr
For passive investors: Depreciation is non-cash, so a rental often shows a tax loss while cash-flowing — sheltering income. Rental losses are passive: they offset passive income freely, and up to $25,000/yr can offset ordinary (W-2) income if you actively participate and your MAGI is under $100k (phasing out to $0 by $150k); unused losses carry forward. On sale, claimed depreciation is recaptured at up to 25%, and gains may owe capital-gains tax (a 1031 exchange can defer both). Figures are a year-1 estimate at your 24.0% rate — not tax advice; consult a CPA.
Condition & rehab AI · 12 photos
This updated manufactured home in Riverdale Estates 55+ community is move-in ready with a good condition score and minimal repairs needed.
Value-add opportunities
- Both Paint the exterior trim black — Enhances curb appeal and modernizes the home
- Both Replace the ceiling fan with a more modern style — Improves aesthetics and functionality
- Both Install a smart thermostat — Saves energy and improves comfort
Renovation cost estimate screening
Value-add ROI direction
- Both Paint the exterior trim black — Enhances curb appeal and modernizes the home ↑
- Both Replace the ceiling fan with a more modern style — Improves aesthetics and functionality ↑
- Both Install a smart thermostat — Saves energy and improves comfort ↑
ⓘ Cost ranges are severity-bucket heuristics (US national rule-of-thumb). Get contractor quotes + a written scope before underwriting a rehab budget.
Schools (NCES district)
- District
- Desert Sands Unified
- NCES district ID
- 0611110
- Math proficiency
- 31% ▼ -4.00%
- Reading proficiency
- 56% ▲ 7.00%
- Median HH income
- $54,957
- Composite
- 37.77/100
- National rank
- #4346
- State rank
- #199 of 517 in CA
Livability — Indio
- Score
- 53/100
- State rank
- #927
- US rank
- #24244
Category grades
Schools grade is shown separately in the Schools card above.
Census & demographics
- Census place
- Indio, CA
- County
- Riverside County · 2,287,001 people
- City population
- 100,560
- Metro
- Riverside-San Bernardino-Ontario, CA
- Population (ZIP)
- 65,825
- Household income
- $66,758
- Rent vs Own
- Severe rent burden
- 2036.0
Population outlook (Riverside County) Hauer SSP2
- Today (2025)
- 2,664,475 people
- By 2030
- 2,802,692 · +5.2%
- By 2040
- 3,050,904 · +14.5%
- By 2050
- 3,256,783 · +22.2%
- By 2075
- 3,655,058 · +37.2%
- By 2100
- 3,766,594 · +41.4%
Race, ethnicity, and origin ACS 2023
- Neighborhood character
- Predominantly Hispanic (74%)
- Race & ethnicity
- Hispanic / Latino 74% Two or more races 39% White 19% Black 3% Asian 3% Native American 1%
- Hispanic origin (detail)
- Mexican 69%
- Common ancestry
- Romanian 1% Iranian 1%
- Foreign-born
- 29% · Canada, Vietnam, Jamaica
- Languages at home
- 41% English-only · Spanish 55% Arabic 1% Tagalog/Filipino 1%
Political lean MEDSL · Riverside
- 2024 margin
- Toss-up / Even · D 48.0% · R 49.3% · Other 2.6%
- 2008→2024 swing
- -3.6pp toward R · 2008: 2.3pp · 2024: -1.3pp
- All cycles
- 2024: R+1.3 2020: D+8.0 2016: D+4.3 2012: R+0.4 2008: D+2.3
Not yet ingested
- Civics
- —
Market trends
- HPI YoY
- ▼ -138.46%
- Current HPI
- 348.6605
- Rent YoY
- ▲ 3.34%
- Metro
- Riverside-San Bernardino-Ontario, CA
- State GDP YoY
- ▲ 3.21%
- F500 in state
- 116
Industry mix (Fortune 500 HQ in CA)
| Industry | F500 HQs | Revenue |
|---|---|---|
| Technology | 27 | $1,492B |
|
||
| Financial Services | 3 | $174B |
|
||
| Retail | 3 | $44B |
|
||
| Insurance | 3 | $26B |
|
||
| Media / Entertainment | 2 | $115B |
|
||
| Pharmaceuticals / Biotech | 2 | $62B |
|
||
Price history
2 events — show timeline
- 2026-04-10 Listed — GPSMLS
- 2026-04-09 Listed $75,000 GPSMLS
Cash-flow waterfall
monthlySold comps — $/sqft
last 12 mo · ≤1 miLoading sold comps…