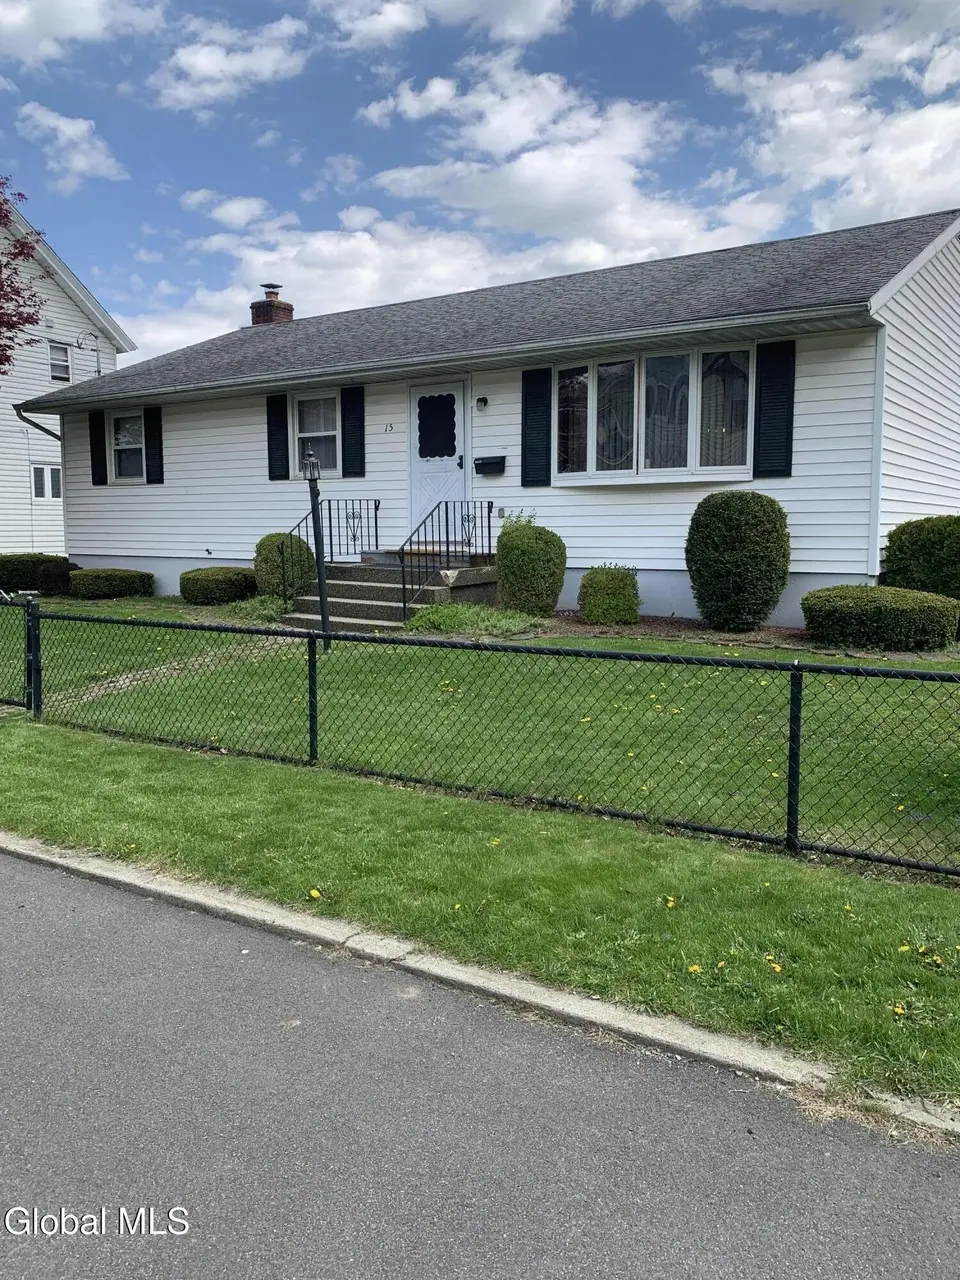
15 Wright St · Amsterdam, NY
Flood risk 9/10 · Severe
- FEMA flood zone
- X (unshaded)
- Chance of flooding over 30 yrs
- 0.99%
- Est. flood insurance / yr
- $473 – $860
Fire risk 1/10 · Minimal
- Est. fire insurance / yr
- $691 – $1,283
Heat risk 3/10 · Minor
- Hot days now (above 94°F)
- 7 days/yr
- Hot days in 30 yrs
- 17 days/yr
Wind risk 3/10 · Minor
- Chance of severe wind over 30 yrs
- 4.0%
Air-quality risk 1/10 · Minimal
- Unhealthy air days now
- 0 days/yr
- Unhealthy air days in 30 yrs
- 0 days/yr
Risk factors via First Street. Map © Google.
Why this score? — see what drove the D+ grade
The composite is a weighted blend of 9 inputs, each scored 0–100. Each bar is that input's sub-score; the figure is the points it added to the 100-point composite (weight × sub-score).
- ARV discount +11.5/15.0
- Appreciation +10.0/10.0
- Cash flow +8.1/30.0
- Livability +3.8/5.0
- Schools +3.2/10.0
- Rent growth +2.5/5.0
- Condition / age +2.5/5.0
- 1% rule +2.1/10.0
- DSCR +2.1/10.0
$198,000
🖨 Deal sheet 📄 Offer letter ✓ Due diligence
Listing remarks
Charming and quaint 3 bedroom, 1 bath home located on the south side of Amsterdam. This beauty is first floor living at its finest. There are 3 nice sized bedrooms with hardwood floors under carpet, a large bathroom with walk-in shower, and washer/dryer hookups. A spacious living room with newer carpet which borders an eat in kitchen. The basement is the perfect layout for bonus space. Outside you will find a fenced in yard and a lovely patio space. There are (2) 2 car garages and storage spaces attached. This home is located on a dead end street, and is walking distance to restaurants as well as the Riverlink Park over the Mohawk River.
Key facts
- First floor living
- Bonus space
- Hardwood floors
Tags
Property features AI
Exterior
- Parking: Detached garage; Second garage/garage(s); Total of 6 parking spaces, including 5 garage spaces; Off-street paved driveway parking
- Utilities: Public water; Public sewer
- Home design: Single family residence; Below-grade finished area present
- Construction: Vinyl siding; Shingle roof
- Exterior features: Patio; Paved driveway; Front yard fencing with gate; Drive-paved exterior
Interior
- Kitchen: Dishwasher; Oven; Range; Refrigerator
- Bedrooms: Three first-floor bedrooms
- Flooring: Carpet; Hardwood
- Bathrooms: One full bathroom on the first floor
- Heating & cooling: Hot water heating
- Interior features: Chair rail; Full basement with interior entry; 5 total rooms
- Laundry & utility: Laundry located in the basement and in a bathroom
Neighborhood map
What this means for you Summary
Snapshot
- This is a 3-bed/1.0-bath single-family listed at $198k.
Deal economics
- At list price, monthly cash flow is $-252 ($-3k/yr) — negative.
- To cash-flow at today's rent, offer at most $153k (22.5% below list).
- To meet the 1% rule (rent ≥ 1% of price), the offer needs to be $141k (28.9% below list).
- Recommended offer: $141k (28.9% below list) — sets the bar for 1% rule.
Location & tenants
- Location reads 75/100 on livability (#247 in NY, #3,884 nationally) — a middle-class / working-renter tenant base. Strengths: cost of living A+, housing A+, health & safety A+; Watch: crime F, employment F.
- Amsterdam City School District (town): math 35% / reading 41% proficiency, ranked #546 of 590 in NY (top 92%) — families likely to look elsewhere, expect single-tenant / working-renter base with shorter leases.
- Zoned schools: Amsterdam High School (math 75% / reading 82%, grade A-, #563 of 1,100 statewide, top 52%, 1,179 students, 68% FRL) — zoned schools average 68% FRL vs 40% district-wide (28 pts higher); higher-poverty schools than district average — tighter screening recommended.
- Zoned-school proficiency averages 78% at this address vs 38% district-wide (+40 pts) — the actual schools serving this property are materially stronger than the Amsterdam City School District average implies; a family-tenant draw the district grade alone would hide.
- Market conditions: 164 active listings in the ZIP; 11 comparable units currently listed for rent nearby; rentals at typical pace (median 19d on market — plan ~3-4 weeks tenant-placement turnaround); 210 units permitted in Montgomery County in 2024 (168 in 5+ unit buildings).
Forward outlook
- In year one you build about $21k of equity ($1k loan paydown + $20k appreciation (10.0% local appreciation)).
- Montgomery County population projected at -11% by 2050 — secular population decline; favor cash flow + early exit over multi-decade hold.
- By year 2, paydown + projected appreciation supports a ~$34k cash-out refi (75% LTV) — recoverable capital for the next deal without selling this one.
Negotiation context
- Only 2 days on market — expect competitive offers; lowballing is unlikely to land.
Risks & watch-outs
- Watch-outs: flood insurance adds $56/mo.
- Climate carrying-cost: severe flood risk — expect insurance premiums to compound above CPI over the hold.
Questions for the listing agent
- What do current leases actually rent for vs. the listed asking? Can we see a recent rent roll and the last 12 months of T-12 income?
- Built in 1976 — when were the roof, HVAC, electrical panel, plumbing, and water heater last replaced?
- What's the actual annual flood-insurance premium (NFIP or private), and is the property in a SFHA with mandatory coverage?
- Is there a deadline driving the sale (1031 exchange, divorce, estate, relocation)? That informs how much negotiation room exists.
- Schools are D-rated, which usually means shorter tenancies and higher turnover. Who's the typical renter profile here, and what's been the actual vacancy rate?
- Crime grade is F in this area — have there been break-ins, vandalism, or insurance claims at this property in the last 3 years? What carrier currently insures it and at what premium?
- The area grade is low — what's the realistic commute time and amenity access for the typical tenant pool here? Any planned neighborhood developments (good or bad) we should know about?
- What's the average days-on-market for RENTAL listings here right now (not sales)? A rising rental-DOM trend means longer vacancies and softer asking-rent achievability than the comps imply.
- What's the recent tenant-quality profile in this submarket — average credit score on applications, eviction rate, late-payment / NSF rate, and stable-employment percentage? A property-management company in the area should have these aggregated.
- How much new for-sale + rental construction is in the pipeline within 1–3 miles? Heavy new supply typically softens prices + rents 12–24 months out; constrained supply supports both.
Investment metrics
- 1% rule
- 0.71% ✗
- Cap rate
- 5.10%
- Cash-on-cash
- -4.26%
- DSCR
- 0.81
- GRM
- 11.7
CMA / ARV
- ARV (on-the-fly)
- $217,560
- Comps found
- 5
Show comp detail 5 sales within ~0.75 mi
| Address | Dist | Beds/Ba | Sqft | Sold | Price | $/sf | Match |
|---|---|---|---|---|---|---|---|
| 33 Dewitt St | 0.20mi | 2/1.0 (-1) | 1,209 (+3%) | 8mo | $65,000 | $54 | 75 |
| 106 Perkins St | 0.06mi | 4/1.5 (+1) | 1,310 (+11%) | 9mo | $260,000 | $198 | 64 |
| 239 Florida Ave | 0.29mi | 4/1.5 (+1) | 1,056 (-10%) | 8mo | $195,000 | $185 | 56 |
| 252 Florida Ave | 0.38mi | 3/1.5 | 1,040 (-12%) | 10mo | $79,537 | $76 | 53 |
| 34 Broadway | 0.71mi | 3/1.5 | 1,028 (-13%) | 23mo | $280,000 | $272 | 25 |
Match score weights: distance 35% · size 25% · config 20% · recency 20%. Top-matched comps best support the ARV.
Projected returns pro-forma
10.0% appreciation · 3.0% rent growth · sell at horizon
- IRR
- 20.4%
- Equity multiple
- 2.66×
- Total profit
- $91,789
- Equity at exit
- $178,374
- IRR
- 18.6%
- Equity multiple
- 6.10×
- Total profit
- $282,975
- Equity at exit
- $384,670
Cash invested: $55,440 (down + closing). Projections, not guarantees.
Landlord ↔ Tenant lean methodology
- Overall (STATE)
- 15 Strongly Tenant-Friendly
- State New York
- 15 Strongly Tenant-Friendly · D+10
- County
- — inherits STATE
- City
- — inherits STATE
ZIP-level market 12010
- Home prices YoY
- 4.0%
- Active inventory
- 164
- Price-to-rent
- 11.7×
Monthly cashflow live
- Estimated rent
- $1,408 high interval (Pro) →
- Mortgage (P&I)
- −$1,038
- Tax from tax record
- −$188 /mo · $2,256/yr
- Insurance
- −$82
- Flood insurance flood zone
- −$56 /mo · $666/yr
- HOA
- −$0
- Vacancy / Maint / Mgmt
- −$296
- Net cashflow
- $-252
Break-even live
UW: 25.0% down · 7.5% · 30yr · 1.5% tax · 5.0% vac · 8.0% maint · 8.0% mgmt
Financing live
Cash to close
- Down payment
- $49,500
- Closing costs
- $5,940
- Reserves months
- —
- Total cash needed
- —
Loan-product check · same deal, 3 products live
Conventional
25% down · 7.5% · 30yr
- Down + closing
- —
- Monthly P&I
- —
- Monthly cashflow
- —
- DSCR
- —
- Eligible?
- —
Personal DTI + credit; lowest rate.
DSCR
20% down · 8.5% · 30yr
- Down + closing
- —
- Monthly P&I
- —
- Monthly cashflow
- —
- DSCR
- —
- Eligible?
- —
No personal income docs; deal must DSCR.
Hard money
10% down · 12.0% · 12mo
- Down + closing
- —
- Monthly P&I
- —
- Monthly cashflow
- —
- DSCR
- —
- Eligible?
- —
Short-term bridge; refi at stabilization.
Rent comps 11 comps
| Address | Beds | Baths | Sqft | Rent | $/sqft | DOM | Units | Dist |
|---|---|---|---|---|---|---|---|---|
| 21 Dewitt St Unit 2nd floor Amsterdam, NY | 3.0 | 1.0 | 1000 | $1,450 | $1.45 | 14d | 1 | 0.19mi |
| 70 Wall St Amsterdam, NY | 3.0 | 1.0 | 1098 | $1,300 | $1.18 | 19d | 1 | 0.71mi |
| 18 Garden St Amsterdam, NY | 3.0 | 1.0 | 1180 | $1,300 | $1.10 | 19d | 1 | 0.71mi |
| 265 W Main St Unit 1 Amsterdam, NY | 3.0 | 1.0 | 1200 | $1,450 | $1.21 | 14d | 1 | 0.79mi |
| 255 Main St Amsterdam, NY | 2.0 | 1.0 | 800 | $1,400 | $1.75 | 14d | 1 | 0.98mi |
| 62 Glen Ave Amsterdam, NY | 3.0 | 1.0 | 1115 | $1,550 | $1.39 | 23d | 1 | 0.99mi |
| 30 Kline St Amsterdam, NY | 2.0 | 1.0 | 800 | $1,300 | $1.62 | 19d | 1 | 1.04mi |
| 49 Elizabeth St Amsterdam, NY | 3.0 | 1.0 | 1300 | $1,450 | $1.12 | 21d | 1 | 1.05mi |
| 17 Grand St Amsterdam, NY | 4.0 | 1.0 | 1098 | $1,400 | $1.28 | 23d | 1 | 1.06mi |
| 214 Market St Amsterdam, NY | 3.0 | 1.5 | 1500 | $1,300 | $0.87 | 23d | 1 | 1.28mi |
| 214 Market St Amsterdam, NY | 3.0 | 1.5 | 1500 | $1,450 | $0.97 | 43d | 1 | 1.28mi |
Listing history 2 events
-
2026-05-06status Pending
-
2026-05-04$198,000 Active
ⓘ Source: listings_history table (triggers on properties + properties_extension) + one-shot
backfill from property_details.listing_events for pre-trigger history.
Tax reassessment forecast NY · Partial reset (capped growth)
- Current annual tax
- $2,256 · $188/mo
- Projected year-2 tax
- $2,801 · $233/mo
- Expected delta
- +$545/yr (+$45/mo · 24.2%)
ⓘ Screening estimate from a state-policy table — verify with the county assessor before closing.
Climate risk First Street
- Flood 9/10 Extreme FEMA zone X (unshaded) · 99% chance over 30 yrs
- Wildfire 1/10 Low
- Heat 3/10 Moderate 7 d/yr ≥94°F today · 17 d/yr by 30 yrs out
- Wind 3/10 Moderate 4% chance of damaging wind over 30 yrs
- Air quality 1/10 Low 0 unhealthy d/yr today · 0 by 30 yrs out
Nearby sold comps map
Loading sold comps map…
Walkable amenities ~0.75 mi
Loading nearby amenities…
Taxation est. · year 1
- Rental income
- $16,893
- − Mortgage interest
- −$11,091
- − Property taxes
- −$2,256
- − Insurance
- −$1,656
- − Repairs & maintenance
- −$1,351
- − Management
- −$1,351
- − Depreciation
- −$5,760
- Taxable loss
- −$6,573
- Est. tax savings @ 24.0%
- +$1,578
- After-tax cash flow
- $-1,449/yr
For passive investors: Depreciation is non-cash, so a rental often shows a tax loss while cash-flowing — sheltering income. Rental losses are passive: they offset passive income freely, and up to $25,000/yr can offset ordinary (W-2) income if you actively participate and your MAGI is under $100k (phasing out to $0 by $150k); unused losses carry forward. On sale, claimed depreciation is recaptured at up to 25%, and gains may owe capital-gains tax (a 1031 exchange can defer both). Figures are a year-1 estimate at your 24.0% rate — not tax advice; consult a CPA.
Schools (NCES district)
- District
- Amsterdam City School District
- NCES district ID
- 3602970
- Math proficiency
- 35% ▲ 5.00%
- Reading proficiency
- 41% ▲ 10.00%
- Median HH income
- $41,735
- Composite
- 32.03/100
- National rank
- #5824
- State rank
- #546 of 590 in NY
Livability — Amsterdam
- Score
- 75/100
- State rank
- #247
- US rank
- #3884
Category grades
Schools grade is shown separately in the Schools card above.
Census & demographics
- Census place
- Amsterdam, NY
- City population
- 27,339
- Population (ZIP)
- 27,339
Population outlook (Montgomery County) Hauer SSP2
- Today (2025)
- 48,683 people
- By 2030
- 47,785 · -1.8%
- By 2040
- 45,492 · -6.6%
- By 2050
- 43,161 · -11.3%
- By 2075
- 38,134 · -21.7%
- By 2100
- 32,337 · -33.6%
Race, ethnicity, and origin ACS 2023
- Neighborhood character
- Predominantly White (68%)
- Race & ethnicity
- White 68% Hispanic / Latino 23% Two or more races 9% Black 4% Asian 1%
- Hispanic origin (detail)
- Mexican 2% Puerto Rican 18%
- Common ancestry
- Romanian 12% Lithuanian 2% Iranian 2%
- Foreign-born
- 5% · Canada
- Languages at home
- 86% English-only · Spanish 11% Russian/Polish/Slavic 1% Other Indo-European 1%
Political lean MEDSL · Montgomery
- 2024 margin
- Strong R (+28.7) · D 35.6% · R 64.4%
- 2008→2024 swing
- -20.6pp toward R · 2008: -8.1pp · 2024: -28.7pp
- All cycles
- 2024: R+28.7 2020: R+22.6 2016: R+26.5 2012: R+4.4 2008: R+8.1
Not yet ingested
- Civics
- —
Market trends
- HPI YoY
- ▲ 12.12%
- Current HPI
- 312.4966
- Rent YoY
- —
- Metro
- —
- State GDP YoY
- ▲ 2.60%
- F500 in state
- 92
Industry mix (Fortune 500 HQ in NY)
| Industry | F500 HQs | Revenue |
|---|---|---|
| Financial Services | 10 | $950B |
|
||
| Consumer Goods | 9 | $162B |
|
||
| Insurance | 4 | $225B |
|
||
| Telecommunications | 2 | $144B |
|
||
| Pharmaceuticals | 2 | $112B |
|
||
| Media / Entertainment | 2 | $69B |
|
||
Price history
2 events — show timeline
- 2026-05-06 Pending — Global MLS
- 2026-05-04 Listed $198,000 Global MLS
Property tax history
+2.2%/yrLatest (2025): $2,256 · +2.6% YoY. Source: county tax records.
Cash-flow waterfall
monthlySold comps — $/sqft
last 12 mo · ≤1 miLoading sold comps…