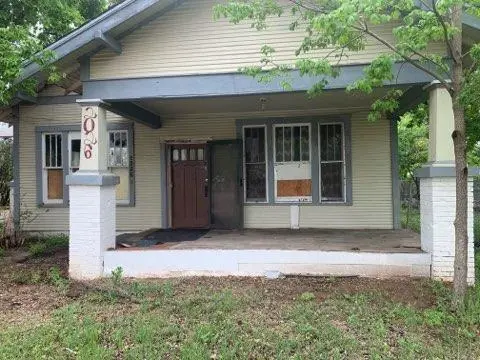
2026 Grape St · Abilene, TX
Flood risk 1/10 · Minimal
- FEMA flood zone
- X (unshaded)
- Chance of flooding over 30 yrs
- 0.0%
- Est. flood insurance / yr
- $507 – $1,088
Fire risk 2/10 · Minimal
- Est. fire insurance / yr
- $1,222 – $2,270
Heat risk 7/10 · Major
- Hot days now (above 104°F)
- 7 days/yr
- Hot days in 30 yrs
- 23 days/yr
Wind risk 4/10 · Minor
- Chance of severe wind over 30 yrs
- 11.0%
Air-quality risk 1/10 · Minimal
- Unhealthy air days now
- 0 days/yr
- Unhealthy air days in 30 yrs
- 0 days/yr
Risk factors via First Street. Map © Google.
Why this score? — see what drove the B+ grade
The composite is a weighted blend of 9 inputs, each scored 0–100. Each bar is that input's sub-score; the figure is the points it added to the 100-point composite (weight × sub-score).
- Cash flow +30.0/30.0
- ARV discount +15.0/15.0
- 1% rule +10.0/10.0
- DSCR +10.0/10.0
- Rent growth +5.0/5.0
- Livability +3.8/5.0
- Schools +2.8/10.0
- Condition / age +2.5/5.0
- Appreciation +0.0/10.0
$77,500
🖨 Deal sheet (PDF) 📄 Offer letter ✓ Due diligence
Listing remarks MLS
Calling all investors. Here’s a great flip investment ready property in a good area of Abilene TX. property needs a full rehab. Check it out for yourself. Don’t miss out.
Key facts
- 0.24 acre lot
- Parking
- Built 1923
Property features AI
Finance
- Other: Property is residential, single-family; Lot is just under 0.25 acre
- Financial info: Listing is for cash offers; No second mortgage reported
- HOA & community: No association
Exterior
- Parking: Carport (covered) with space for 1 vehicle; No garage
- Utilities: City water; City sewer; Electric service (standard municipal utility not indicated as MUD)
- Home design: Single-family residence; One story; Built in 1923; Located in the College Heights subdivision
- Construction: Pillar/post/pier foundation
- Exterior features: Asphalt surface (driveway/streets); City water; City sewer
Interior
- Kitchen: Kitchen (14 x 16); Appliances: Other
- Bedrooms: Three bedrooms (all on the main level)
- Bathrooms: Two full bathrooms
- Heating & cooling: No central heating listed; No cooling listed
- Interior features: Five total rooms; One living area; One dining area; Brick fireplace
Neighborhood map
What this means for you Summary
Snapshot
- This is a 3-bed/1.0-bath single-family listed at $78k.
Deal economics
- At list price, monthly cash flow is $1k ($18k/yr) — positive.
- The deal already cash-flows at list — no discount required.
- Meets the 1% rule at list price ($3k rent vs $78k).
- Recommended offer: $75k (3.0% below list) — sets the bar for market timing.
- Cap rate 29.0% vs local median 6.8% in Abilene — top-decile yield for the area; either an underpriced asset or a hidden risk that comps aren't pricing in. Stress-test before assuming the spread holds.
Location & tenants
- Location reads 75/100 on livability (#142 in TX, #4,037 nationally) — a middle-class / working-renter tenant base. Strengths: cost of living A+, housing A+, health & safety A+; Watch: schools D+, crime D, commute F.
- Abilene ISD (urban): math 32% / reading 34% proficiency, ranked #575 of 826 in TX (top 70%) — families likely to look elsewhere, expect single-tenant / working-renter base with shorter leases.
- Market conditions: Rents rising fast (+43.4%/yr); 198 active listings in the ZIP; 11 comparable units currently listed for rent nearby; rentals at typical pace (median 24d on market — plan ~3-4 weeks tenant-placement turnaround); 508 units permitted in Taylor County in 2024 (0 in 5+ unit buildings).
- At $2,516/mo this rent would consume 56% of the median local household income ($54k/yr) (locally 1240% of renters already pay >50% of income on rent) — very limited rent-growth headroom before tenants either downsize or default.
Forward outlook
- Local home prices are declining (-3.0%/yr); year-one equity from $536 of loan paydown is wiped out by about $2k of value loss. Plan a longer hold.
- Taylor County population projected at +16% by 2050 — long-run rental-demand tailwind backs the buy-and-hold thesis.
- At projected returns (-3.0% appreciation + 8.0% rent growth), your $22k cash investment doubles in ~2 years — after that, you're playing with house money.
Negotiation context
- It's been on market 39 days — a 3% lower offer ($75k) is reasonable based on typical stale-listing flexibility.
- 2 sale attempts since 5y ago with the ask held roughly flat each time — persistent listings suggest the price (not the market) is what's stuck; bring a comps-based counter.
Risks & watch-outs
- Watch-outs: built in 1923 — expect roof / HVAC / electrical / plumbing capex.
- Climate carrying-cost: extreme-heat days projected 7→23/yr by 2055 (HVAC capex compounding) — expect insurance premiums to compound above CPI over the hold.
Questions for the listing agent
- It's been on market 39 days. Have you received any prior offers? Is the seller open to a 3% concession, seller financing, or rate buy-down credit?
- Built in 1923 — when were the roof, HVAC, electrical panel, plumbing, and water heater last replaced?
- Is there a deadline driving the sale (1031 exchange, divorce, estate, relocation)? That informs how much negotiation room exists.
- Schools are D-rated, which usually means shorter tenancies and higher turnover. Who's the typical renter profile here, and what's been the actual vacancy rate?
- Crime grade is D in this area — have there been break-ins, vandalism, or insurance claims at this property in the last 3 years? What carrier currently insures it and at what premium?
- What's the average days-on-market for RENTAL listings here right now (not sales)? A rising rental-DOM trend means longer vacancies and softer asking-rent achievability than the comps imply.
- What's the recent tenant-quality profile in this submarket — average credit score on applications, eviction rate, late-payment / NSF rate, and stable-employment percentage? A property-management company in the area should have these aggregated.
- How much new for-sale + rental construction is in the pipeline within 1–3 miles? Heavy new supply typically softens prices + rents 12–24 months out; constrained supply supports both.
Investment metrics
- 1% rule
- 3.25% ✓
- Cap rate
- 28.99%
- Cash-on-cash
- 81.04%
- DSCR
- 4.61
- GRM
- 2.6
CMA / ARV
- ARV (median comp)
- $141,126
- List price
- $77,500
- Delta
- -45.08%
- Verdict
- UNDERPRICED
- Comps
- 20 within 1.0 mi
Show comp detail 12 sales within ~0.75 mi
| Address | Dist | Beds/Ba | Sqft | Sold | Price | $/sf | Match |
|---|---|---|---|---|---|---|---|
| 2425 Swenson St | 0.32mi | 3/1.0 | 1,579 (-0%) | 13mo | $165,000 | $104 | 74 |
| 1634 Sandefer St | 0.23mi | 3/2.0 | 1,647 (+4%) | 6mo | $199,000 | $121 | 73 |
| 1741 Clinton St | 0.26mi | 3/2.0 | 1,568 (-1%) | 15mo | $175,000 | $112 | 70 |
| 1510 N 18th St | 0.18mi | 3/2.0 | 1,492 (-6%) | 15mo | $160,000 | $107 | 66 |
| 1818 Grape St | 0.15mi | 3/2.0 | 1,760 (+11%) | 10mo | $80,000 | $45 | 62 |
| 2018 Victoria St | 0.27mi | 3/1.0 | 1,408 (-11%) | 14mo | $17,000 | $12 | 58 |
| 1417 N 19th St | 0.19mi | 3/2.0 | 1,350 (-15%) | 16mo | $139,000 | $103 | 50 |
| 1425 Clinton St | 0.50mi | 3/2.0 | 1,377 (-13%) | 8mo | $52,500 | $38 | 45 |
| 1418 Cedar St | 0.57mi | 3/1.0 | 1,408 (-11%) | 14mo | $167,500 | $119 | 43 |
| 2205 Ambler Ave Unit A & B | 0.49mi | 2/2.0 (-1) | 1,724 (+9%) | 12mo | $310,000 | $180 | 43 |
| 2641 Old Anson Rd | 0.75mi | 2/1.0 (-1) | 1,472 (-7%) | 11mo | $47,000 | $32 | 40 |
| 1617 Park Ave | 0.68mi | 4/2.0 (+1) | 1,380 (-13%) | 0mo | $189,900 | $138 | 38 |
Match score weights: distance 35% · size 25% · config 20% · recency 20%. Top-matched comps best support the ARV.
Projected returns pro-forma
-3.0% appreciation · 8.0% rent growth · sell at horizon
- IRR
- 86.8%
- Equity multiple
- 5.34×
- Total profit
- $94,111
- Equity at exit
- $11,556
- IRR
- 91.1%
- Equity multiple
- 13.11×
- Total profit
- $262,791
- Equity at exit
- $6,701
Cash invested: $21,700 (down + closing). Projections, not guarantees.
Landlord ↔ Tenant lean methodology
- Overall (STATE)
- 87 Strongly Landlord-Friendly
- State Texas
- 87 Strongly Landlord-Friendly · R+5
- County
- — inherits STATE
- City
- — inherits STATE
ZIP-level market 79601
- Home prices YoY
- -22.8%
- Rents YoY
- 43.4%
- Active inventory
- 198
- Price-to-rent
- 2.6×
Monthly cashflow live
- Estimated rent
- $2,516 high interval (Pro) →
- Mortgage (P&I)
- −$406
- Tax from tax record
- −$84 /mo · $1,005/yr
- Insurance
- −$32
- HOA
- −$0
- Lot rent
- −$0
- Vacancy / Maint / Mgmt
- −$528
- Net cashflow
- $1,466
Break-even live
Sensitivity live
| Price | -10% $1,509 | -5% $1,487 | +0% $1,466 | +5% $1,444 | +10% $1,422 |
|---|---|---|---|---|---|
| Rent | -10% $1,267 | -5% $1,366 | +0% $1,466 | +5% $1,565 | +10% $1,664 |
| Rate | -1.0pp $1,505 | -0.5pp $1,485 | base $1,466 | +0.5pp $1,445 | +1.0pp $1,425 |
UW: 25.0% down · 7.5% · 30yr · 1.5% tax · 5.0% vac · 8.0% maint · 8.0% mgmt
Financing live
Cash to close
- Down payment
- $19,375
- Closing costs
- $2,325
- Reserves months
- —
- Total cash needed
- —
Loan-product check · same deal, 3 products live
Conventional
25% down · 7.5% · 30yr
- Down + closing
- —
- Monthly P&I
- —
- Monthly cashflow
- —
- DSCR
- —
- Eligible?
- —
Personal DTI + credit; lowest rate.
DSCR
20% down · 8.5% · 30yr
- Down + closing
- —
- Monthly P&I
- —
- Monthly cashflow
- —
- DSCR
- —
- Eligible?
- —
No personal income docs; deal must DSCR.
Hard money
10% down · 12.0% · 12mo
- Down + closing
- —
- Monthly P&I
- —
- Monthly cashflow
- —
- DSCR
- —
- Eligible?
- —
Short-term bridge; refi at stabilization.
Rent comps 11 comps
| Address | Beds | Baths | Sqft | Rent | $/sqft | DOM | Units | Dist |
|---|---|---|---|---|---|---|---|---|
| 1638 Merchant St Abilene, TX | 3.0 | 2.0 | 1328 | $2,895 | $2.18 | 16d | 1 | 0.32mi |
| 1209 Kirkwood St Abilene, TX | 3.0 | 2.0 | 1674 | $2,500 | $1.49 | 23d | 1 | 0.84mi |
| 1426 Plum St Abilene, TX | 3.0 | 2.0 | 1090 | $2,014 | $1.85 | 16d | 1 | 0.89mi |
| 702 N 13th St Abilene, TX | 3.0 | 2.0 | 1334 | $2,200 | $1.65 | 16d | 1 | 0.96mi |
| 1481 Burger St Abilene, TX | 3.0 | 2.0 | 1330 | $2,400 | $1.80 | 23d | 1 | 0.99mi |
| 2934 Old Anson Rd Unit 321 Abilene, TX | 3.0 | 2.0 | 1190 | $1,437 | $1.21 | 23d | 1 | 1.02mi |
| 1732 Jameson St Abilene, TX | 3.0 | 1.5 | 1241 | $2,200 | $1.77 | 46d | 1 | 1.11mi |
| 1710 Jameson St Abilene, TX | 3.0 | 3.0 | 1885 | $3,300 | $1.75 | 46d | 1 | 1.11mi |
| 3296 Sandefer St Abilene, TX | 4.0 | 1.0 | 1360 | $1,950 | $1.43 | 16d | 1 | 1.31mi |
| 1685 N Willis St Abilene, TX | 3.0 | 2.0 | 1349 | $1,800 | $1.33 | 23d | 1 | 1.41mi |
| 2609 Madison Ave Abilene, TX | 3.0 | 2.0 | 1788 | $4,000 | $2.24 | 16d | 1 | 1.49mi |
Listing history 19 events
-
2026-06-10days on market $77,500 Active 39 DOM
-
2026-06-09days on market $77,500 Active 38 DOM
-
2026-06-08days on market $77,500 Active 37 DOM
-
2026-06-07days on market $77,500 Active 36 DOM
-
2026-06-03days on market $77,500 Active 32 DOM
-
2026-06-02days on market $77,500 Active 31 DOM
-
2026-06-01days on market $77,500 Active 30 DOM
-
2026-05-31days on market $77,500 Active 29 DOM
-
2026-05-30days on market $77,500 Active 28 DOM
-
2026-05-02$79,900 Active 12-char remark
-
2022-03-15soldstatus Closed 182-char remark
Show marketing remark (182 chars)
Calling all investors. Here’s a great flip investment ready property in a good area of Abilene TX. property needs a full rehab. Check it out for yourself. Don’t miss out.
-
2022-03-02status Pending 182-char remark
Show marketing remark (182 chars)
Calling all investors. Here’s a great flip investment ready property in a good area of Abilene TX. property needs a full rehab. Check it out for yourself. Don’t miss out.
-
2022-01-25soldstatus
-
2022-01-25soldstatus
-
2022-01-11status Pending 182-char remark
Show marketing remark (182 chars)
Calling all investors. Here’s a great flip investment ready property in a good area of Abilene TX. property needs a full rehab. Check it out for yourself. Don’t miss out.
-
2021-12-18$55,000 Active 182-char remark
Show marketing remark (182 chars)
Calling all investors. Here’s a great flip investment ready property in a good area of Abilene TX. property needs a full rehab. Check it out for yourself. Don’t miss out.
-
2005-10-04soldstatus
-
2005-09-09soldstatus
-
1986-06-02soldstatus
ⓘ Source: listings_history table (triggers on properties + properties_extension) + one-shot
backfill from property_details.listing_events for pre-trigger history.
Tax reassessment forecast TX · Resets to sale price
- Current annual tax
- $1,005 · $84/mo
- Projected year-2 tax
- $1,418 · $118/mo
- Expected delta
- +$413/yr (+$34/mo · 41.1%)
ⓘ Screening estimate from a state-policy table — verify with the county assessor before closing.
Climate risk First Street
- Flood 1/10 Low FEMA zone X (unshaded) · 0% chance over 30 yrs
- Wildfire 2/10 Low
- Heat 7/10 Severe 7 d/yr ≥104°F today · 23 d/yr by 30 yrs out
- Wind 4/10 Moderate 11% chance of damaging wind over 30 yrs
- Air quality 1/10 Low 0 unhealthy d/yr today · 0 by 30 yrs out
Nearby sold comps map
Loading sold comps map…
Walkable amenities ~0.75 mi
Loading nearby amenities…
Taxation est. · year 1
- Rental income
- $30,197
- − Mortgage interest
- −$4,341
- − Property taxes
- −$1,005
- − Insurance
- −$388
- − Repairs & maintenance
- −$2,416
- − Management
- −$2,416
- − Depreciation
- −$2,255
- Taxable income
- $17,378
- Est. tax owed @ 24.0%
- −$4,171
- After-tax cash flow
- $13,416/yr
For passive investors: Depreciation is non-cash, so a rental often shows a tax loss while cash-flowing — sheltering income. Rental losses are passive: they offset passive income freely, and up to $25,000/yr can offset ordinary (W-2) income if you actively participate and your MAGI is under $100k (phasing out to $0 by $150k); unused losses carry forward. On sale, claimed depreciation is recaptured at up to 25%, and gains may owe capital-gains tax (a 1031 exchange can defer both). Figures are a year-1 estimate at your 24.0% rate — not tax advice; consult a CPA.
Schools (NCES district)
- District
- Abilene ISD
- NCES district ID
- 4807440
- Math proficiency
- 32% ▼ -11.00%
- Reading proficiency
- 34% ▼ -5.00%
- Median HH income
- $39,782
- Composite
- 27.71/100
- National rank
- #6909
- State rank
- #575 of 826 in TX
Livability — Abilene
- Score
- 75/100
- State rank
- #142
- US rank
- #4037
Category grades
Schools grade is shown separately in the Schools card above.
Census & demographics
- Census place
- Abilene, TX
- County
- Taylor County · 136,672 people
- City population
- 136,672
- Metro
- Abilene, TX
- Population (ZIP)
- 28,050
- Household income
- $53,631
- Rent vs Own
- Severe rent burden
- 1240.0
Population outlook (Taylor County) Hauer SSP2
- Today (2025)
- 145,270 people
- By 2030
- 150,050 · +3.3%
- By 2040
- 159,417 · +9.7%
- By 2050
- 168,883 · +16.3%
- By 2075
- 194,436 · +33.8%
- By 2100
- 203,163 · +39.9%
Race, ethnicity, and origin ACS 2023
- Neighborhood character
- Diverse neighborhood (Simpson 0.61)
- Race & ethnicity
- White 55% Hispanic / Latino 25% Black 13% Two or more races 13% Asian 3%
- Hispanic origin (detail)
- Mexican 21%
- Common ancestry
- Italian 2% Lithuanian 2% Serbian 1%
- Foreign-born
- 7% · Canada, Vietnam
- Languages at home
- 81% English-only · Spanish 15% French/Haitian/Cajun 1% Vietnamese 1%
Political lean MEDSL · Taylor
- 2024 margin
- Solid R (+49.8) · D 24.6% · R 74.4% · Other 1.0%
- 2008→2024 swing
- -4.2pp toward R · 2008: -45.6pp · 2024: -49.8pp
- All cycles
- 2024: R+49.8 2020: R+45.3 2016: R+51.1 2012: R+53.6 2008: R+45.6
Not yet ingested
- Civics
- —
Market trends
- HPI YoY
- ▼ -63.17%
- Current HPI
- 214.4372
- Rent YoY
- ▲ 43.38%
- Metro
- Abilene, TX
- State GDP YoY
- ▲ 3.95%
- F500 in state
- 110
Industry mix (Fortune 500 HQ in TX)
| Industry | F500 HQs | Revenue |
|---|---|---|
| Energy | 16 | $1,198B |
|
||
| Technology | 5 | $198B |
|
||
| Engineering / Construction | 4 | $72B |
|
||
| Energy Services | 3 | $60B |
|
||
| Utilities | 3 | $41B |
|
||
| Healthcare | 2 | $330B |
|
||
Price history
+40.9% since first listed12 events — show timeline
- 2026-06-10 Listing Removed — NTREIS
- 2026-05-19 Price Changed $77,500 NTREIS
- 2026-05-02 Listed $79,900 NTREIS
- 2022-03-15 Sold (MLS) — NTREIS
- 2022-03-02 Pending — NTREIS
- 2022-01-25 Sold (Public Records) — Public Records
- 2022-01-25 Sold (Public Records) — Public Records
- 2022-01-11 Pending — NTREIS
- 2021-12-18 Listed $55,000 NTREIS
- 2005-10-04 Sold (Public Records) — Public Records
- 2005-09-09 Sold (Public Records) — Public Records
- 1986-06-02 Sold (Public Records) — Public Records
Property tax history
+5.5%/yrLatest (2025): $1,005 · +18.2% YoY. Source: county tax records.
Cash-flow waterfall
monthlySold comps — $/sqft
last 12 mo · ≤1 miLoading sold comps…