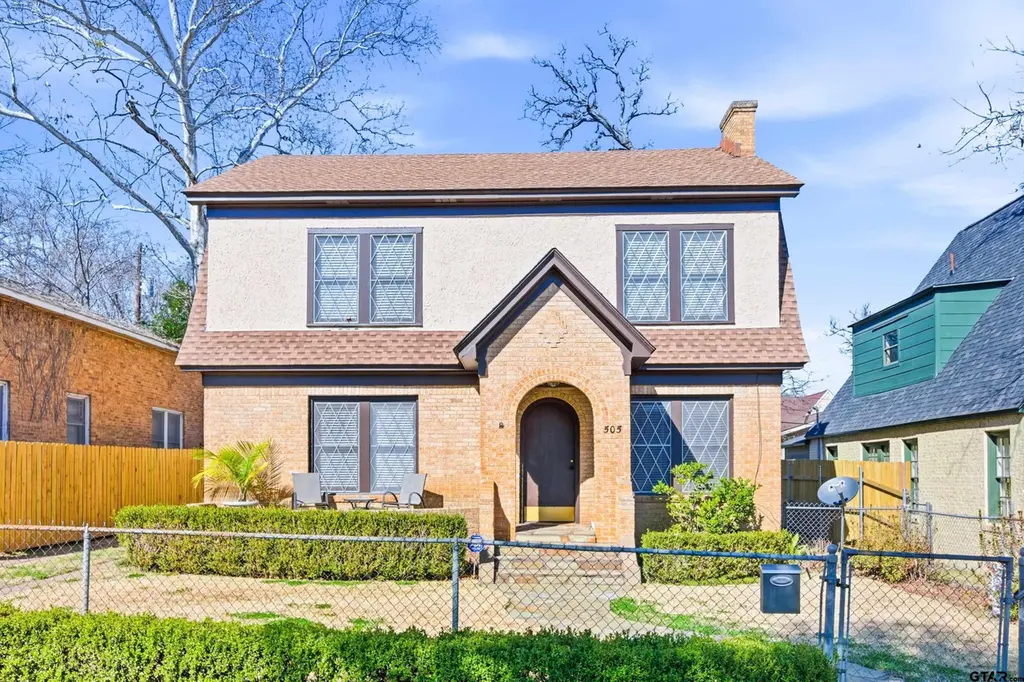
505 Williams Ct · Tyler, TX
Flood risk 1/10 · Minimal
- FEMA flood zone
- X (unshaded)
- Chance of flooding over 30 yrs
- 0.0%
- Est. flood insurance / yr
- $507 – $1,088
Fire risk 1/10 · Minimal
- Est. fire insurance / yr
- $1,222 – $2,270
Heat risk 6/10 · Moderate
- Hot days now (above 109°F)
- 7 days/yr
- Hot days in 30 yrs
- 26 days/yr
Wind risk 6/10 · Moderate
- Chance of severe wind over 30 yrs
- 59.0%
Air-quality risk 2/10 · Minimal
- Unhealthy air days now
- 0 days/yr
- Unhealthy air days in 30 yrs
- 1 days/yr
Risk factors via First Street. Map © Google.
Why this score? — see what drove the C- grade
The composite is a weighted blend of 9 inputs, each scored 0–100. Each bar is that input's sub-score; the figure is the points it added to the 100-point composite (weight × sub-score).
- Cash flow +16.0/30.0
- ARV discount +15.0/15.0
- DSCR +4.9/10.0
- Livability +3.8/5.0
- 1% rule +3.7/10.0
- Schools +3.3/10.0
- Rent growth +3.1/5.0
- Condition / age +2.5/5.0
- Appreciation +0.0/10.0
$249,900
🖨 Deal sheet 📄 Offer letter ✓ Due diligence
Listing remarks MLS
Come see this charming classic 1930s brick home offering 2,064 square feet with distinctive period architecture and modern updates. An arched brick entry with a stone walkway leads you through a lovely arched doorway into a spacious living room with hardwood floors throughout the main level. The living room features a large white brick fireplace. The formal dining room, with abundant natural light, opens to a built-in breakfast nook. The kitchen offers wood cabinetry and extra dining space. The den featuring wood paneling is ideal for a home office. Three bedrooms and two bathrooms include an upstairs bath with a vaulted ceiling and a walk-in shower. There is a separate laundry room with full-size washer and dryer hookups. Central heat and air downstairs with window units upstairs. Beautiful stone front patio and fenced yard with rear parking area. Located 0.1 mi from The Foundry Coffee House, Crema Coffee Co. , and Prime 102 Steakhouse in downtown Tyler. 0.7 mi from Bergfeld Park, with a playground, splash pad, and walking trails.
Key facts
- Arched brick entry
- Stone walkway
- Wood cabinetry
Tags
Neighborhood map
What this means for you Summary
Snapshot
- This is a 3-bed/1.0-bath single-family listed at $250k.
Deal economics
- At list price, monthly cash flow is $121 ($1k/yr) — positive.
- The deal already cash-flows at list — no discount required.
- To meet the 1% rule (rent ≥ 1% of price), the offer needs to be $217k (13.1% below list).
- Recommended offer: $217k (13.1% below list) — sets the bar for 1% rule.
- Cap rate 6.9% vs local median 3.6% in Tyler — top-decile yield for the area; either an underpriced asset or a hidden risk that comps aren't pricing in. Stress-test before assuming the spread holds.
Location & tenants
- Location reads 75/100 on livability (#147 in TX, #4,181 nationally) — a middle-class / working-renter tenant base. Strengths: cost of living A+, housing A+, health & safety A+; Watch: employment C-, schools D+, crime D+.
- Tyler ISD (urban): math 39% / reading 38% proficiency, ranked #449 of 826 in TX (top 54%) — families likely to look elsewhere, expect single-tenant / working-renter base with shorter leases; 66% free/reduced lunch — lower-income household profile, screen leases tightly.
- Market conditions: Rents rising (+2.3%/yr); 155 active listings in the ZIP; 13 comparable units currently listed for rent nearby; rentals lingering (median 44d on market — plan ~5-8 weeks vacancy on turnover, expect pricing pressure); 54% of comp listings sitting > 30 days — soft ceiling on asking rent; 595 units permitted in Smith County in 2024 (45 in 5+ unit buildings).
- At $2,172/mo this rent would consume 51% of the median local household income ($52k/yr) (locally 803% of renters already pay >50% of income on rent) — very limited rent-growth headroom before tenants either downsize or default.
Forward outlook
- Local home prices are declining (-3.0%/yr); year-one equity from $2k of loan paydown is wiped out by about $7k of value loss. Plan a longer hold.
- Smith County population projected at +24% by 2050 — long-run rental-demand tailwind backs the buy-and-hold thesis.
Negotiation context
- It's been on market 112 days — a 9% lower offer ($227k) is reasonable based on typical stale-listing flexibility.
Risks & watch-outs
- Watch-outs: built in 1930 — expect roof / HVAC / electrical / plumbing capex.
- Climate carrying-cost: major wind risk, 59% chance of damaging wind over 30y; extreme-heat days projected 7→26/yr by 2055 (HVAC capex compounding) — expect insurance premiums to compound above CPI over the hold.
Questions for the listing agent
- It's been on market 112 days. Have you received any prior offers? Is the seller open to a 13% concession, seller financing, or rate buy-down credit?
- Built in 1930 — when were the roof, HVAC, electrical panel, plumbing, and water heater last replaced?
- Why hasn't it sold? Are there any deal-killer items the seller is aware of (foundation, flood, title, zoning, code violations)?
- Is there a deadline driving the sale (1031 exchange, divorce, estate, relocation)? That informs how much negotiation room exists.
- Schools are D-rated, which usually means shorter tenancies and higher turnover. Who's the typical renter profile here, and what's been the actual vacancy rate?
- Crime grade is D in this area — have there been break-ins, vandalism, or insurance claims at this property in the last 3 years? What carrier currently insures it and at what premium?
- What's the average days-on-market for RENTAL listings here right now (not sales)? A rising rental-DOM trend means longer vacancies and softer asking-rent achievability than the comps imply.
- What's the recent tenant-quality profile in this submarket — average credit score on applications, eviction rate, late-payment / NSF rate, and stable-employment percentage? A property-management company in the area should have these aggregated.
- How much new for-sale + rental construction is in the pipeline within 1–3 miles? Heavy new supply typically softens prices + rents 12–24 months out; constrained supply supports both.
Investment metrics
- 1% rule
- 0.87% ✗
- Cap rate
- 6.88%
- Cash-on-cash
- 2.08%
- DSCR
- 1.09
- GRM
- 9.6
CMA / ARV
- ARV (median comp)
- $322,270
- List price
- $249,900
- Delta
- -22.46%
- Verdict
- UNDERPRICED
- Comps
- 8 within 1.0 mi
Projected returns pro-forma
-3.0% appreciation · 2.27% rent growth · sell at horizon
- IRR
- -13.8%
- Equity multiple
- 0.51×
- Total profit
- $-34,405
- Equity at exit
- $37,261
- IRR
- -6.1%
- Equity multiple
- 0.62×
- Total profit
- $-26,617
- Equity at exit
- $21,607
Cash invested: $69,972 (down + closing). Projections, not guarantees.
Landlord ↔ Tenant lean methodology
- Overall (STATE)
- 87 Strongly Landlord-Friendly
- State Texas
- 87 Strongly Landlord-Friendly · R+5
- County
- — inherits STATE
- City
- — inherits STATE
ZIP-level market 75702
- Home prices YoY
- -5.8%
- Rents YoY
- 2.3%
- Active inventory
- 155
- Price-to-rent
- 9.6×
Monthly cashflow live
- Estimated rent
- $2,172 high interval (Pro) →
- Mortgage (P&I)
- −$1,311
- Tax from tax record
- −$180 /mo · $2,155/yr
- Insurance
- −$104
- HOA
- −$0
- Vacancy / Maint / Mgmt
- −$456
- Net cashflow
- $121
Break-even live
UW: 25.0% down · 7.5% · 30yr · 1.5% tax · 5.0% vac · 8.0% maint · 8.0% mgmt
Financing live
Cash to close
- Down payment
- $62,475
- Closing costs
- $7,497
- Reserves months
- —
- Total cash needed
- —
Loan-product check · same deal, 3 products live
Conventional
25% down · 7.5% · 30yr
- Down + closing
- —
- Monthly P&I
- —
- Monthly cashflow
- —
- DSCR
- —
- Eligible?
- —
Personal DTI + credit; lowest rate.
DSCR
20% down · 8.5% · 30yr
- Down + closing
- —
- Monthly P&I
- —
- Monthly cashflow
- —
- DSCR
- —
- Eligible?
- —
No personal income docs; deal must DSCR.
Hard money
10% down · 12.0% · 12mo
- Down + closing
- —
- Monthly P&I
- —
- Monthly cashflow
- —
- DSCR
- —
- Eligible?
- —
Short-term bridge; refi at stabilization.
Rent comps 13 comps
| Address | Beds | Baths | Sqft | Rent | $/sqft | DOM | Units | Dist |
|---|---|---|---|---|---|---|---|---|
| 1104 W Park St Tyler, TX | 3.0 | 2.0 | 1440 | $1,650 | $1.15 | 21d | 1 | 0.26mi |
| 556 W Erwin St Tyler, TX | 3.0 | 3.5 | 1956 | $2,550 | $1.30 | 21d | 1 | 0.39mi |
| 548 W Erwin St Tyler, TX | 3.0 | 3.5 | 1956 | $2,495 | $1.28 | 43d | 1 | 0.40mi |
| 548 W Erwin St Tyler, TX | 3.0 | 3.5 | 1956 | $2,295 | $1.17 | 21d | 1 | 0.40mi |
| 540 W Erwin St Tyler, TX | 3.0 | 3.5 | 1956 | $4,000 | $2.04 | 43d | 1 | 0.40mi |
| 720 N Englewood Ave Tyler, TX | 3.0 | 1.0 | 1856 | $1,650 | $0.89 | 43d | 1 | 0.99mi |
| 1403 S Donnybrook Ave Tyler, TX | 3.0 | 3.0 | 1834 | $2,150 | $1.17 | 43d | 1 | 1.01mi |
| 711 W 6th St Tyler, TX | 3.0 | 2.0 | 1854 | $1,850 | $1.00 | 13d | 1 | 1.03mi |
| 324 S Saunders Ave Tyler, TX | 3.0 | 2.0 | 1650 | $2,100 | $1.27 | 43d | 1 | 1.14mi |
| 2002 S Robertson Ave Tyler, TX | 3.0 | 2.5 | 1992 | $1,800 | $0.90 | 43d | 1 | 1.19mi |
| 1118 S Fleishel Ave Tyler, TX | 3.0 | 2.0 | 1425 | $1,495 | $1.05 | 13d | 1 | 1.34mi |
| 1523 N Englewood Ave Tyler, TX | 3.0 | 2.0 | 1542 | $1,650 | $1.07 | 43d | 1 | 1.48mi |
| 1107 Dogwood St Tyler, TX | 3.0 | 1.5 | 1620 | $1,475 | $0.91 | 21d | 1 | 1.48mi |
Listing history 20 events
-
2026-06-19days on market $249,900 Active 112 DOM
-
2026-06-18days on market $249,900 Active 111 DOM
-
2026-06-17days on market $249,900 Active 110 DOM
-
2026-06-16days on market $249,900 Active 109 DOM
-
2026-06-15days on market $249,900 Active 108 DOM
-
2026-06-14days on market $249,900 Active 106 DOM
-
2026-06-13days on market $249,900 Active 105 DOM
-
2026-06-10days on market $249,900 Active 103 DOM
-
2026-06-09days on market $249,900 Active 102 DOM
-
2026-06-08days on market $249,900 Active 101 DOM
-
2026-06-07days on market $249,900 Active 100 DOM
-
2026-06-05days on market $249,900 Active 97 DOM
-
2026-06-02days on market $249,900 Active 95 DOM
-
2026-06-01days on market $249,900 Active 94 DOM
-
2026-05-31days on market $249,900 Active 93 DOM
-
2026-05-30days on market $249,900 Active 92 DOM
-
2026-03-30price $269,900 1047-char remark
Show marketing remark (1047 chars)
Come see this charming classic 1930s brick home offering 2,064 square feet with distinctive period architecture and modern updates. An arched brick entry with a stone walkway leads you through a lovely arched doorway into a spacious living room with hardwood floors throughout the main level. The living room features a large white brick fireplace. The formal dining room, with abundant natural light, opens to a built-in breakfast nook. The kitchen offers wood cabinetry and extra dining space. The den featuring wood paneling is ideal for a home office. Three bedrooms and two bathrooms include an upstairs bath with a vaulted ceiling and a walk-in shower. There is a separate laundry room with full-size washer and dryer hookups. Central heat and air downstairs with window units upstairs. Beautiful stone front patio and fenced yard with rear parking area. Located 0.1 mi from The Foundry Coffee House, Crema Coffee Co. , and Prime 102 Steakhouse in downtown Tyler. 0.7 mi from Bergfeld Park, with a playground, splash pad, and walking trails.
-
2026-02-27$279,900 Active 1047-char remark
Show marketing remark (1047 chars)
Come see this charming classic 1930s brick home offering 2,064 square feet with distinctive period architecture and modern updates. An arched brick entry with a stone walkway leads you through a lovely arched doorway into a spacious living room with hardwood floors throughout the main level. The living room features a large white brick fireplace. The formal dining room, with abundant natural light, opens to a built-in breakfast nook. The kitchen offers wood cabinetry and extra dining space. The den featuring wood paneling is ideal for a home office. Three bedrooms and two bathrooms include an upstairs bath with a vaulted ceiling and a walk-in shower. There is a separate laundry room with full-size washer and dryer hookups. Central heat and air downstairs with window units upstairs. Beautiful stone front patio and fenced yard with rear parking area. Located 0.1 mi from The Foundry Coffee House, Crema Coffee Co. , and Prime 102 Steakhouse in downtown Tyler. 0.7 mi from Bergfeld Park, with a playground, splash pad, and walking trails.
-
2007-06-28soldstatus
-
1985-07-02soldstatus
ⓘ Source: listings_history table (triggers on properties + properties_extension) + one-shot
backfill from property_details.listing_events for pre-trigger history.
Tax reassessment forecast TX · Resets to sale price
- Current annual tax
- $2,155 · $180/mo
- Projected year-2 tax
- $4,573 · $381/mo
- Expected delta
- +$2,418/yr (+$201/mo · 112.2%)
ⓘ Screening estimate from a state-policy table — verify with the county assessor before closing.
Climate risk First Street
- Flood 1/10 Low FEMA zone X (unshaded) · 0% chance over 30 yrs
- Wildfire 1/10 Low
- Heat 6/10 Major 7 d/yr ≥109°F today · 26 d/yr by 30 yrs out
- Wind 6/10 Major 59% chance of damaging wind over 30 yrs
- Air quality 2/10 Low 0 unhealthy d/yr today · 1 by 30 yrs out
Nearby sold comps map
Loading sold comps map…
Walkable amenities ~0.75 mi
Loading nearby amenities…
Taxation est. · year 1
- Rental income
- $26,058
- − Mortgage interest
- −$13,998
- − Property taxes
- −$2,155
- − Insurance
- −$1,250
- − Repairs & maintenance
- −$2,085
- − Management
- −$2,085
- − Depreciation
- −$7,270
- Taxable loss
- −$2,784
- Est. tax savings @ 24.0%
- +$668
- After-tax cash flow
- $2,123/yr
For passive investors: Depreciation is non-cash, so a rental often shows a tax loss while cash-flowing — sheltering income. Rental losses are passive: they offset passive income freely, and up to $25,000/yr can offset ordinary (W-2) income if you actively participate and your MAGI is under $100k (phasing out to $0 by $150k); unused losses carry forward. On sale, claimed depreciation is recaptured at up to 25%, and gains may owe capital-gains tax (a 1031 exchange can defer both). Figures are a year-1 estimate at your 24.0% rate — not tax advice; consult a CPA.
Schools (NCES district)
- District
- Tyler ISD
- NCES district ID
- 4843470
- Math proficiency
- 39% ▼ -4.00%
- Reading proficiency
- 38% ▼ -1.00%
- Median HH income
- $44,090
- Composite
- 32.69/100
- National rank
- #5650
- State rank
- #449 of 826 in TX
Livability — Tyler
- Score
- 75/100
- State rank
- #147
- US rank
- #4181
Category grades
Schools grade is shown separately in the Schools card above.
Census & demographics
- Census place
- Tyler, TX
- County
- Smith County · 180,570 people
- City population
- 127,842
- Metro
- Tyler, TX
- Population (ZIP)
- 27,927
- Household income
- $51,564
- Rent vs Own
- Severe rent burden
- 803.0
Population outlook (Smith County) Hauer SSP2
- Today (2025)
- 248,890 people
- By 2030
- 261,665 · +5.1%
- By 2040
- 286,114 · +15.0%
- By 2050
- 308,006 · +23.8%
- By 2075
- 354,171 · +42.3%
- By 2100
- 372,828 · +49.8%
Race, ethnicity, and origin ACS 2023
- Neighborhood character
- Diverse neighborhood (Simpson 0.61)
- Race & ethnicity
- Hispanic / Latino 49% Black 37% White 12% Two or more races 11% Native American 1%
- Hispanic origin (detail)
- Mexican 47%
- Common ancestry
- Lithuanian 1%
- Foreign-born
- 20% · Canada
- Languages at home
- 56% English-only · Spanish 44%
Political lean MEDSL · Smith
- 2024 margin
- Solid R (+45.1) · D 27.0% · R 72.1%
- 2008→2024 swing
- -5.6pp toward R · 2008: -39.5pp · 2024: -45.1pp
- All cycles
- 2024: R+45.1 2020: R+39.4 2016: R+43.9 2012: R+46.9 2008: R+39.5
Not yet ingested
- Civics
- —
Market trends
- HPI YoY
- ▼ -12.63%
- Current HPI
- 207.1573
- Rent YoY
- ▲ 2.27%
- Metro
- Tyler, TX
- State GDP YoY
- ▲ 3.95%
- F500 in state
- 110
Industry mix (Fortune 500 HQ in TX)
| Industry | F500 HQs | Revenue |
|---|---|---|
| Energy | 16 | $1,198B |
|
||
| Technology | 5 | $198B |
|
||
| Engineering / Construction | 4 | $72B |
|
||
| Energy Services | 3 | $60B |
|
||
| Utilities | 3 | $41B |
|
||
| Healthcare | 2 | $330B |
|
||
Price history
-3.6% since first listed4 events — show timeline
- 2026-03-30 Price Changed $269,900 GTAR
- 2026-02-27 Listed $279,900 GTAR
- 2007-06-28 Sold (Public Records) — Public Records
- 1985-07-02 Sold (Public Records) — Public Records
Property tax history
+3.5%/yrLatest (2024): $2,155 · +7.4% YoY. Source: county tax records.
Cash-flow waterfall
monthlySold comps — $/sqft
last 12 mo · ≤1 miLoading sold comps…