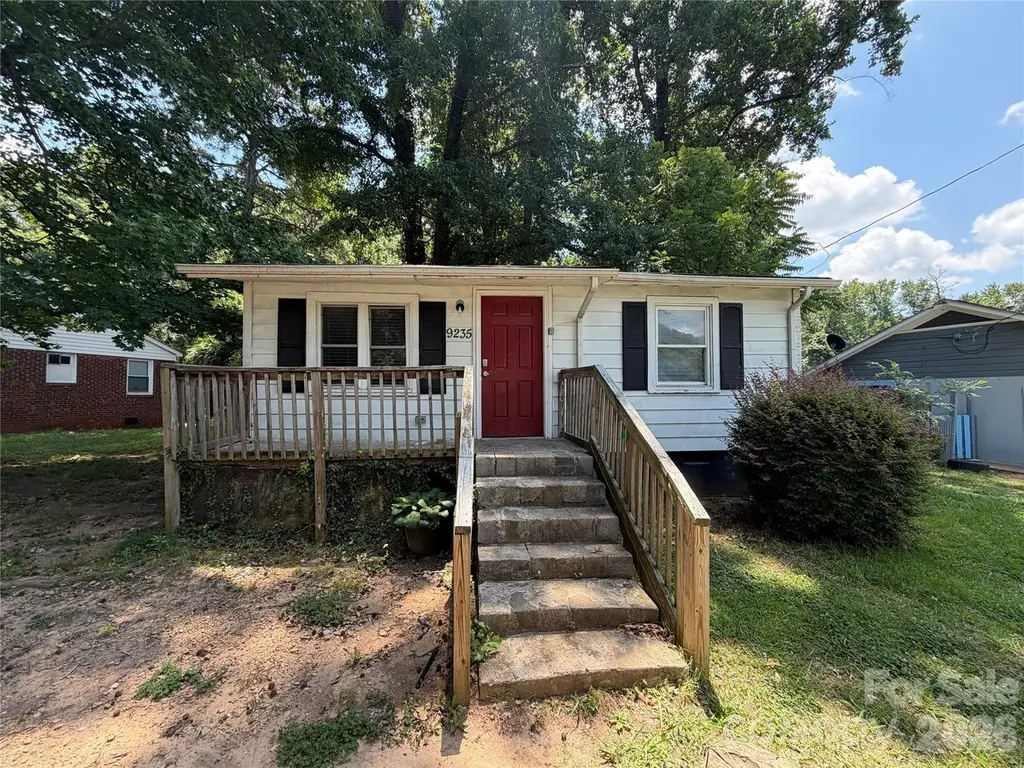
9235 Kendall Dr · Charlotte, NC
Flood risk 1/10 · Minimal
- FEMA flood zone
- X (unshaded)
- Chance of flooding over 30 yrs
- 0.0%
- Est. flood insurance / yr
- $507 – $1,088
Fire risk 3/10 · Minor
- Est. fire insurance / yr
- $906 – $1,684
Heat risk 6/10 · Moderate
- Hot days now (above 103°F)
- 7 days/yr
- Hot days in 30 yrs
- 17 days/yr
Wind risk 5/10 · Moderate
- Chance of severe wind over 30 yrs
- 25.0%
Air-quality risk 3/10 · Minor
- Unhealthy air days now
- 3 days/yr
- Unhealthy air days in 30 yrs
- 4 days/yr
Risk factors via First Street. Map © Google.
Why this score? — see what drove the B grade
The composite is a weighted blend of 9 inputs, each scored 0–100. Each bar is that input's sub-score; the figure is the points it added to the 100-point composite (weight × sub-score).
- Cash flow +27.8/30.0
- ARV discount +15.0/15.0
- DSCR +9.8/10.0
- 1% rule +6.5/10.0
- Livability +3.9/5.0
- Schools +3.8/10.0
- Rent growth +3.3/5.0
- Condition / age +2.5/5.0
- Appreciation +0.0/10.0
$160,000
🖨 Deal sheet 📄 Offer letter ✓ Due diligence
Listing remarks
Multiple offers received! Seller has set an offer deadline of 1 PM on Wednesday, 6/17. Prime Investment or Move-In Opportunity: 3-Bed, 2-Bath with Great Location Location, convenience, and proven potential—this property delivers it all. Whether you are an investor searching for a seamless, turn-key addition to your portfolio or a homebuyer looking to build quick equity through minimal updates, this 3-bedroom, 2-bathroom home is ready for its next chapter. Proven Return History: For investors, this is a rare find. It features a reliable track record of strong rental returns, making it a true turn-key asset from day one. Blank Canvas for Buyers: If you are looking for a primary residen
Key facts
- 0.23 acre lot
- Built 1958
- Listed 4 days
Property features AI
Finance
- Other: Zoning: N1-B
- HOA & community: No HOA
Exterior
- Parking: Driveway
- Utilities: City water; Public sewer
- Home design: Single-family residence; One story; Site-built construction
- Construction: Vinyl exterior; Crawl space foundation
- Exterior features: Dirt and paved road access; Publicly maintained road
Interior
- Kitchen: Electric oven; Electric range
- Bedrooms: 3 bedrooms on the main level
- Bathrooms: 2 full bathrooms on the main level
- Interior features: 7 total rooms; Central heating; Central air
- Laundry & utility: Washer hookup; Electric dryer hookup
Neighborhood map
What this means for you Summary
Snapshot
- This is a 2-bed/1.0-bath single-family listed at $160k.
Deal economics
- At list price, monthly cash flow is $486 ($6k/yr) — positive.
- The deal already cash-flows at list — no discount required.
- Meets the 1% rule at list price ($2k rent vs $160k).
- Cap rate 9.9% vs local median 3.1% in Charlotte — top-decile yield for the area; either an underpriced asset or a hidden risk that comps aren't pricing in. Stress-test before assuming the spread holds.
Location & tenants
- Location reads 78/100 on livability (#26 in NC, #2,502 nationally) — a middle-class / working-renter tenant base. Strengths: amenities A+, commute A+, housing A+; Watch: schools D+, crime F.
- Charlotte-Mecklenburg Schools (urban): math 42% / reading 46% proficiency, ranked #85 of 178 in NC (top 48%) — families likely to look elsewhere, expect single-tenant / working-renter base with shorter leases.
- Market conditions: Rents rising (+3.4%/yr); 363 active listings in the ZIP; 23 comparable units currently listed for rent nearby; rentals leasing fast (median 14d on market — plan ~1-2 weeks tenant-placement turnaround); solid renter incomes; 11,969 units permitted in Mecklenburg County in 2024 (5,377 in 5+ unit buildings).
Forward outlook
- Local home prices are declining (-3.0%/yr); year-one equity from $1k of loan paydown is wiped out by about $5k of value loss. Plan a longer hold.
- Mecklenburg County population projected at +53% by 2050 — long-run rental-demand tailwind backs the buy-and-hold thesis.
- At projected returns (-3.0% appreciation + 3.4% rent growth), your $45k cash investment doubles in ~9 years — after that, you're playing with house money.
Negotiation context
- Only 4 days on market — expect competitive offers; lowballing is unlikely to land.
- Current owner paid $80k; list at $160k implies a 100% gain — meaningful room to come down on a strong offer.
Risks & watch-outs
- Watch-outs: built in 1958 — expect roof / HVAC / electrical / plumbing capex.
- Climate carrying-cost: moderate wind risk, 25% chance of damaging wind over 30y; extreme-heat days projected 7→17/yr by 2055 (HVAC capex compounding) — expect insurance premiums to compound above CPI over the hold.
Questions for the listing agent
- Built in 1958 — when were the roof, HVAC, electrical panel, plumbing, and water heater last replaced?
- Is there a deadline driving the sale (1031 exchange, divorce, estate, relocation)? That informs how much negotiation room exists.
- Schools are D-rated, which usually means shorter tenancies and higher turnover. Who's the typical renter profile here, and what's been the actual vacancy rate?
- Crime grade is F in this area — have there been break-ins, vandalism, or insurance claims at this property in the last 3 years? What carrier currently insures it and at what premium?
- What's the average days-on-market for RENTAL listings here right now (not sales)? A rising rental-DOM trend means longer vacancies and softer asking-rent achievability than the comps imply.
- What's the recent tenant-quality profile in this submarket — average credit score on applications, eviction rate, late-payment / NSF rate, and stable-employment percentage? A property-management company in the area should have these aggregated.
- How much new for-sale + rental construction is in the pipeline within 1–3 miles? Heavy new supply typically softens prices + rents 12–24 months out; constrained supply supports both.
Investment metrics
- 1% rule
- 1.15% ✓
- Cap rate
- 9.93%
- Cash-on-cash
- 13.01%
- DSCR
- 1.58
- GRM
- 7.2
CMA / ARV
- ARV (on-the-fly)
- $264,696
- Comps found
- 12
Show comp detail 12 sales within ~0.75 mi
| Address | Dist | Beds/Ba | Sqft | Sold | Price | $/sf | Match |
|---|---|---|---|---|---|---|---|
| 9215 Old Moores Chapel Rd | 0.14mi | 2/1.5 | 1,007 (-6%) | 2mo | $230,000 | $228 | 79 |
| 8905 Moores Chapel Rd | 0.27mi | 3/2.0 (+1) | 1,106 (+3%) | 8mo | $279,900 | $253 | 67 |
| 9212 Moores Chapel Rd | 0.07mi | 3/2.0 (+1) | 1,206 (+12%) | 1mo | $299,000 | $248 | 67 |
| 9208 Moores Chapel Rd | 0.08mi | 3/2.0 (+1) | 1,210 (+12%) | 0mo | $299,000 | $247 | 66 |
| 6607 Sullins Rd #13 | 0.49mi | 3/2.0 (+1) | 1,056 (-2%) | 5mo | $215,000 | $204 | 61 |
| 224 Rhyne Station Rd | 0.38mi | 3/2.0 (+1) | 1,213 (+13%) | 1mo | $299,000 | $246 | 51 |
| 835 Carrington Dr | 0.45mi | 3/1.5 (+1) | 997 (-7%) | 11mo | $255,000 | $256 | 51 |
| 2012 Pheasant Glen Rd | 0.69mi | 3/2.0 (+1) | 1,228 (+14%) | 1mo | $309,000 | $252 | 35 |
| 6517 Paleface Pl | 0.54mi | 3/1.5 (+1) | 1,228 (+14%) | 12mo | $260,000 | $212 | 34 |
| 708 Claremont Rd | 0.69mi | 3/1.0 (+1) | 975 (-9%) | 18mo | $210,000 | $215 | 32 |
| 8522 Stonehurst Dr | 0.64mi | 3/1.5 (+1) | 1,213 (+13%) | 15mo | $225,000 | $185 | 30 |
| 807 Claremont Rd | 0.74mi | 3/1.5 (+1) | 1,229 (+14%) | 10mo | $217,500 | $177 | 26 |
Match score weights: distance 35% · size 25% · config 20% · recency 20%. Top-matched comps best support the ARV.
Projected returns pro-forma
-3.0% appreciation · 3.35% rent growth · sell at horizon
- IRR
- 3.2%
- Equity multiple
- 1.12×
- Total profit
- $5,598
- Equity at exit
- $23,857
- IRR
- 13.1%
- Equity multiple
- 2.05×
- Total profit
- $47,179
- Equity at exit
- $13,834
Cash invested: $44,800 (down + closing). Projections, not guarantees.
Landlord ↔ Tenant lean methodology
- Overall (STATE)
- 85 Strongly Landlord-Friendly
- State North Carolina
- 85 Strongly Landlord-Friendly · R+3
- County
- — inherits STATE
- City
- — inherits STATE
ZIP-level market 28214
- Home prices YoY
- -26.7%
- Rents YoY
- 3.4%
- Active inventory
- 363
- Price-to-rent
- 7.2×
Monthly cashflow live
- Estimated rent
- $1,848 high interval (Pro) →
- Mortgage (P&I)
- −$839
- Tax from tax record
- −$69 /mo · $822/yr
- Insurance
- −$67
- HOA
- −$0
- Vacancy / Maint / Mgmt
- −$388
- Net cashflow
- $486
Break-even live
UW: 25.0% down · 7.5% · 30yr · 1.5% tax · 5.0% vac · 8.0% maint · 8.0% mgmt
Financing live
Cash to close
- Down payment
- $40,000
- Closing costs
- $4,800
- Reserves months
- —
- Total cash needed
- —
Loan-product check · same deal, 3 products live
Conventional
25% down · 7.5% · 30yr
- Down + closing
- —
- Monthly P&I
- —
- Monthly cashflow
- —
- DSCR
- —
- Eligible?
- —
Personal DTI + credit; lowest rate.
DSCR
20% down · 8.5% · 30yr
- Down + closing
- —
- Monthly P&I
- —
- Monthly cashflow
- —
- DSCR
- —
- Eligible?
- —
No personal income docs; deal must DSCR.
Hard money
10% down · 12.0% · 12mo
- Down + closing
- —
- Monthly P&I
- —
- Monthly cashflow
- —
- DSCR
- —
- Eligible?
- —
Short-term bridge; refi at stabilization.
Rent comps 23 comps
| Address | Beds | Baths | Sqft | Rent | $/sqft | DOM | Units | Dist |
|---|---|---|---|---|---|---|---|---|
| 9242 Eleanor Dr Charlotte, NC | 3.0 | 2.0 | 1070 | $1,800 | $1.68 | 1d | 1 | 0.10mi |
| 841 Carrington Dr Charlotte, NC | 3.0 | 2.0 | 1300 | $1,650 | $1.27 | 23d | 1 | 0.46mi |
| 4008 Fire Creek RD Charlotte, NC | 1.0–3.0 | 1.0–2.0 | 968 | $1,884 | $1.95 | 3d | 34 | 0.47mi |
| 7229 Kavan Hunter Dr Charlotte, NC | 3.0 | 2.0 | 1202 | $1,870 | $1.56 | 4d | 1 | 0.51mi |
| 6248 Lowe Ln Charlotte, NC | 3.0 | 2.5 | 1434 | $2,130 | $1.49 | 4d | 1 | 0.52mi |
| 6316 Lowe Ln Charlotte, NC | 3.0 | 2.5 | 1434 | $2,160 | $1.51 | 23d | 1 | 0.54mi |
| 7116 Galway City St Charlotte, NC | 3.0 | 2.5 | 1434 | $2,255 | $1.57 | 23d | 1 | 0.57mi |
| 2012 Pheasant Glen Rd Charlotte, NC | 3.0 | 2.0 | 1228 | $1,895 | $1.54 | 2d | 1 | 0.69mi |
| 4717 Opus Ln Charlotte, NC | 3.0 | 2.5 | 1441 | $1,849 | $1.28 | 2d | 1 | 0.73mi |
| 2872 Oasis Ln Charlotte, NC | 3.0 | 2.0 | 1206 | $1,790 | $1.48 | 14d | 1 | 0.75mi |
| 2856 Oasis Ln Charlotte, NC | 3.0 | 2.0 | 1283 | $1,799 | $1.40 | 13d | 1 | 0.78mi |
| 9127 Spyglass Pl Charlotte, NC | 2.0 | 2.0 | 950 | $1,450 | $1.53 | 23d | 1 | 0.78mi |
| 9123 Spyglass Pl Unit C Charlotte, NC | 2.0 | 2.0 | 936 | $1,300 | $1.39 | 7d | 1 | 0.80mi |
| 1000 Claremont Rd Charlotte, NC | 3.0 | 1.5 | 1275 | $1,200 | $0.94 | 13d | 1 | 0.91mi |
| 717 Aberdeen Glen Pl Charlotte, NC | 3.0 | 2.5 | 1478 | $1,965 | $1.33 | 16d | 1 | 1.02mi |
| 6537 Hoover Cir Charlotte, NC | 3.0 | 3.0 | 1430 | $2,095 | $1.47 | 7d | 1 | 1.06mi |
| 1325 Bells Knox Rd Charlotte, NC | 1.0 | 1.0 | 1044 | $690 | $0.66 | 23d | 1 | 1.07mi |
| 5923 Running Deer Rd Charlotte, NC | 3.0 | 2.0 | 1087 | $1,649 | $1.52 | 16d | 1 | 1.07mi |
| 907 Rucker Cliff Dr Charlotte, NC | 1.0 | 1.0 | 1100 | $685 | $0.62 | 23d | 1 | 1.10mi |
| 225 Rhyne Rd Charlotte, NC | 1.0–2.0 | 1.0–2.0 | 996 | $1,877 | $1.88 | 2d | 24 | 1.18mi |
| 1820 Gum Branch Rd Charlotte, NC | 3.0 | 1.0 | 1114 | $1,895 | $1.70 | 7d | 1 | 1.21mi |
| 935 Tom Sadler Rd Unit A Charlotte, NC | 3.0 | 2.0 | 1008 | $1,395 | $1.38 | 23d | 1 | 1.23mi |
| 3145 Prado Ln Charlotte, NC | 1.0–2.0 | 1.0–2.0 | 970 | $1,865 | $1.92 | 1d | 23 | 1.41mi |
Listing history 6 events
-
2026-06-18status $160,000 Pending 4 DOM
-
2026-06-17days on market $160,000 Active 4 DOM
-
2026-06-16days on market $160,000 Active 3 DOM
-
2026-06-15days on market $160,000 Active 2 DOM
-
2026-06-13remarks 693-char remark
-
2026-06-13$160,000 Active 1 DOM
ⓘ Source: listings_history table (triggers on properties + properties_extension) + one-shot
backfill from property_details.listing_events for pre-trigger history.
Tax reassessment forecast NC · Resets to sale price
- Current annual tax
- $822 · $69/mo
- Projected year-2 tax
- $1,312 · $109/mo
- Expected delta
- +$490/yr (+$41/mo · 59.6%)
ⓘ Screening estimate from a state-policy table — verify with the county assessor before closing.
Climate risk First Street
- Flood 1/10 Low FEMA zone X (unshaded) · 0% chance over 30 yrs
- Wildfire 3/10 Moderate
- Heat 6/10 Major 7 d/yr ≥103°F today · 17 d/yr by 30 yrs out
- Wind 5/10 Major 25% chance of damaging wind over 30 yrs
- Air quality 3/10 Moderate 3 unhealthy d/yr today · 4 by 30 yrs out
Nearby sold comps map
Loading sold comps map…
Walkable amenities ~0.75 mi
Loading nearby amenities…
Taxation est. · year 1
- Rental income
- $22,174
- − Mortgage interest
- −$8,962
- − Property taxes
- −$822
- − Insurance
- −$800
- − Repairs & maintenance
- −$1,774
- − Management
- −$1,774
- − Depreciation
- −$4,655
- Taxable income
- $3,387
- Est. tax owed @ 24.0%
- −$813
- After-tax cash flow
- $5,014/yr
For passive investors: Depreciation is non-cash, so a rental often shows a tax loss while cash-flowing — sheltering income. Rental losses are passive: they offset passive income freely, and up to $25,000/yr can offset ordinary (W-2) income if you actively participate and your MAGI is under $100k (phasing out to $0 by $150k); unused losses carry forward. On sale, claimed depreciation is recaptured at up to 25%, and gains may owe capital-gains tax (a 1031 exchange can defer both). Figures are a year-1 estimate at your 24.0% rate — not tax advice; consult a CPA.
Schools (NCES district)
- District
- Charlotte-Mecklenburg Schools
- NCES district ID
- 3702970
- Math proficiency
- 42% ▼ -6.00%
- Reading proficiency
- 46% ▲ 1.00%
- Median HH income
- $57,175
- Composite
- 38.49/100
- National rank
- #4183
- State rank
- #85 of 178 in NC
Livability — Charlotte
- Score
- 78/100
- State rank
- #26
- US rank
- #2502
Category grades
Schools grade is shown separately in the Schools card above.
Census & demographics
- Census place
- Charlotte, NC
- County
- Mecklenburg County · 1,167,319 people
- City population
- 920,422
- Metro
- Charlotte-Concord-Gastonia, NC-SC
- Population (ZIP)
- 43,837
- Household income
- $86,447
- Rent vs Own
- Severe rent burden
- 671.0
Population outlook (Mecklenburg County) Hauer SSP2
- Today (2025)
- 1,305,740 people
- By 2030
- 1,442,752 · +10.5%
- By 2040
- 1,722,441 · +31.9%
- By 2050
- 1,999,450 · +53.1%
- By 2075
- 2,642,495 · +102.4%
- By 2100
- 3,106,755 · +137.9%
Race, ethnicity, and origin ACS 2023
- Neighborhood character
- Highly diverse neighborhood (Simpson 0.71)
- Race & ethnicity
- Black 40% White 30% Hispanic / Latino 18% Two or more races 9% Asian 6%
- Hispanic origin (detail)
- Mexican 9% Puerto Rican 1% Dominican 1%
- Common ancestry
- Serbian 1% Italian 1% Slovak 1%
- Foreign-born
- 15% · Canada, Vietnam, China
- Languages at home
- 77% English-only · Spanish 15% Vietnamese 2% Other Asian/Pacific 2%
Political lean MEDSL · Mecklenburg
- 2024 margin
- Solid D (+32.9) · D 65.6% · R 32.7% · Other 1.6%
- 2008→2024 swing
- +8.5pp toward D · 2008: 24.4pp · 2024: 32.9pp
- All cycles
- 2024: D+32.9 2020: D+35.1 2016: D+29.9 2012: D+22.5 2008: D+24.4
Not yet ingested
- Civics
- —
Market trends
- HPI YoY
- ▼ -100.82%
- Current HPI
- 277.2903
- Rent YoY
- ▲ 3.35%
- Metro
- Charlotte-Concord-Gastonia, NC-SC
- State GDP YoY
- ▲ 3.28%
- F500 in state
- 26
Industry mix (Fortune 500 HQ in NC)
| Industry | F500 HQs | Revenue |
|---|---|---|
| Financial Services | 2 | $213B |
|
||
| Retail | 2 | $95B |
|
||
| Industrial Conglomerate | 1 | $38B |
|
||
| Metals / Steel | 1 | $35B |
|
||
| Utilities | 1 | $30B |
|
||
| Industrial Machinery | 1 | $19B |
|
||
Price history
+100.0% since first listed3 events — show timeline
- 2026-06-13 Price Changed $160,000 CANOPYMLS as Distributed by MLS Grid
- 2026-06-13 Listed $150,000 CANOPYMLS as Distributed by MLS Grid
- 2017-11-02 Sold (Public Records) $80,000 Public Records
Property tax history
+8.5%/yrLatest (2020): $822 · +1.9% YoY. Source: county tax records.
Cash-flow waterfall
monthlySold comps — $/sqft
last 12 mo · ≤1 miLoading sold comps…