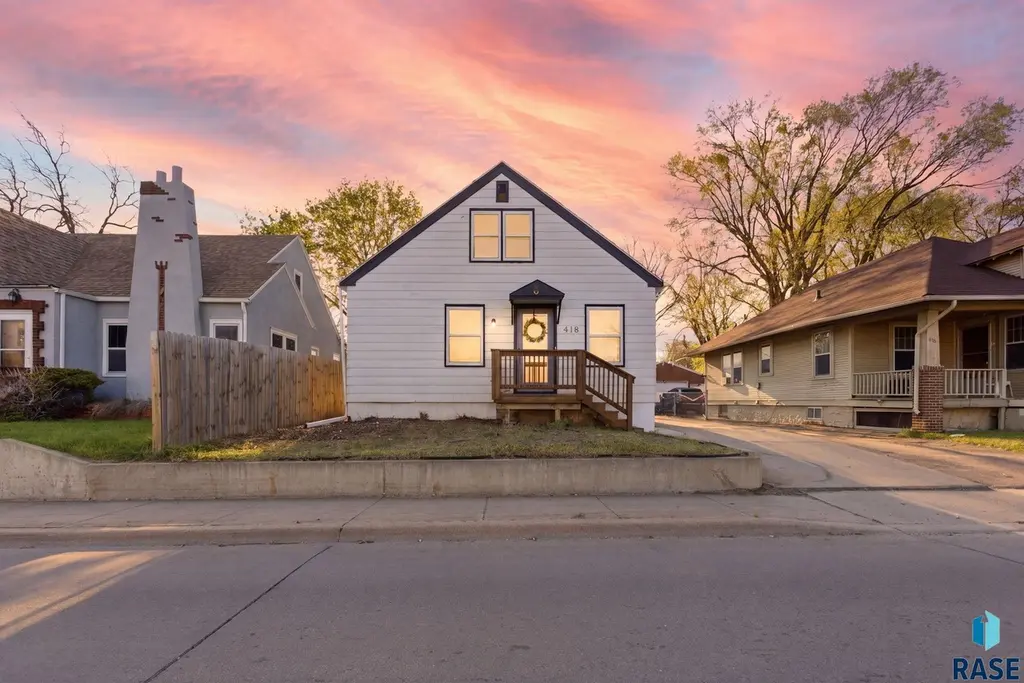
418 N Cliff Ave Ave · Sioux Falls, SD
Flood risk 1/10 · Minimal
- FEMA flood zone
- X (unshaded)
- Chance of flooding over 30 yrs
- 0.0%
- Est. flood insurance / yr
- $473 – $860
Fire risk 1/10 · Minimal
- Est. fire insurance / yr
- $1,342 – $2,492
Heat risk 2/10 · Minimal
- Hot days now (above 99°F)
- 7 days/yr
- Hot days in 30 yrs
- 14 days/yr
Wind risk 2/10 · Minimal
- Chance of severe wind over 30 yrs
- —
Air-quality risk 2/10 · Minimal
- Unhealthy air days now
- 1 days/yr
- Unhealthy air days in 30 yrs
- 1 days/yr
Risk factors via First Street. Map © Google.
Why this score? — see what drove the C+ grade
The composite is a weighted blend of 9 inputs, each scored 0–100. Each bar is that input's sub-score; the figure is the points it added to the 100-point composite (weight × sub-score).
- Cash flow +20.4/30.0
- ARV discount +15.0/15.0
- DSCR +6.5/10.0
- 1% rule +5.0/10.0
- Livability +4.2/5.0
- Schools +3.7/10.0
- Rent growth +3.3/5.0
- Condition / age +2.5/5.0
- Appreciation +0.0/10.0
$189,900
🖨 Deal sheet (PDF) 📄 Offer letter ✓ Due diligence
Key facts
- Move-in-ready home
- Updated flooring
- Built-in shelving
Tags
Property features AI
Exterior
- Parking: Concrete parking; No garage
- Utilities: Public water; Public sewer; Property utilities on public maintained roads with curb and gutter
- Home design: Single-family residence; 1.5-story style; Main entry level: Main
- Construction: Metal exterior construction; Block foundation; Composition roof; Above-grade finished area reported; additional below-grade finished area
- Exterior features: Irregular city lot (approx. 40 x 120)
Interior
- Kitchen: Electric range; Dishwasher; Garbage disposal; Refrigerator; Kitchen located on the main level
- Bedrooms: Main-level master bedroom (approx. 12 x 12); Second bedroom on main level (approx. 11 x 12); Third bedroom on upper level (approx. 12 x 15); Fourth bedroom in basement (approx. 8 x 11)
- Flooring: Carpet; Vinyl
- Bathrooms: One full bathroom on the main level; One half bathroom in the basement
- Heating & cooling: Natural gas heating; Central air conditioning
- Interior features: Master bedroom located on the main level; Full finished basement
- Laundry & utility: Electric water heater
Neighborhood map
What this means for you Summary
Snapshot
- This is a 3-bed/3.0-bath single-family listed at $190k.
Deal economics
- At list price, monthly cash flow is $248 ($3k/yr) — positive.
- The deal already cash-flows at list — no discount required.
- Meets the 1% rule at list price ($2k rent vs $190k).
- Cap rate 7.9% vs local median 2.6% in Sioux Falls — top-decile yield for the area; either an underpriced asset or a hidden risk that comps aren't pricing in. Stress-test before assuming the spread holds.
Location & tenants
- Location reads 85/100 on livability (#3 in SD, #610 nationally) — a professional / high-income tenant draw. Strengths: amenities A+, commute A+, cost of living A+; Watch: crime F.
- Sioux Falls School District 49-5 (urban): math 39% / reading 48% proficiency, ranked #45 of 59 in SD (top 76%) — families likely to look elsewhere, expect single-tenant / working-renter base with shorter leases.
- Zoned schools: Terry Redlin Elementary - 11 (math 17% / reading 27%, grade F, #228 of 253 statewide, top 92%, 473 students, 77% FRL); Whittier Middle School - 08 (math 14% / reading 26%, grade F, #133 of 143 statewide, top 93%, 704 students, 70% FRL); Washington High School - 01 (math 33% / reading 57%, grade D-, #110 of 151 statewide, top 73%, 1,910 students, 39% FRL) — zoned schools average 62% FRL vs 36% district-wide (26 pts higher); higher-poverty schools than district average — tighter screening recommended.
- Zoned-school proficiency averages 29% at this address vs 44% district-wide (-14 pts) — the specific schools serving this property underperform the Sioux Falls School District 49-5 average; the district grade overstates school quality for this exact location.
- Market conditions: Rents rising (+3.2%/yr); 163 active listings in the ZIP; 7 comparable units currently listed for rent nearby; rentals at typical pace (median 24d on market — plan ~3-4 weeks tenant-placement turnaround); 2,425 units permitted in Minnehaha County in 2024 (1,367 in 5+ unit buildings).
- This rent runs 31% of the median local income ($73k/yr) — at the standard rent-burdened threshold; future hikes will face affordability resistance.
Forward outlook
- Local home prices are declining (-3.0%/yr); year-one equity from $1k of loan paydown is wiped out by about $6k of value loss. Plan a longer hold.
- Minnehaha County population projected at +46% by 2050 — long-run rental-demand tailwind backs the buy-and-hold thesis.
Negotiation context
- Only 3 days on market — expect competitive offers; lowballing is unlikely to land.
- 11 sale attempts since 16y ago with the ask held roughly flat each time — persistent listings suggest the price (not the market) is what's stuck; bring a comps-based counter.
- Current owner paid $100k; list at $190k implies a 90% gain — meaningful room to come down on a strong offer.
Risks & watch-outs
- Watch-outs: built in 1948 — expect roof / HVAC / electrical / plumbing capex.
Questions for the listing agent
- Built in 1948 — when were the roof, HVAC, electrical panel, plumbing, and water heater last replaced?
- Is there a deadline driving the sale (1031 exchange, divorce, estate, relocation)? That informs how much negotiation room exists.
- Schools are B-rated — typically a magnet for longer-tenancy family renters. What's the average tenant stay here, and is there a school-zone premium baked into asking?
- Crime grade is F in this area — have there been break-ins, vandalism, or insurance claims at this property in the last 3 years? What carrier currently insures it and at what premium?
- What's the average days-on-market for RENTAL listings here right now (not sales)? A rising rental-DOM trend means longer vacancies and softer asking-rent achievability than the comps imply.
- What's the recent tenant-quality profile in this submarket — average credit score on applications, eviction rate, late-payment / NSF rate, and stable-employment percentage? A property-management company in the area should have these aggregated.
- How much new for-sale + rental construction is in the pipeline within 1–3 miles? Heavy new supply typically softens prices + rents 12–24 months out; constrained supply supports both.
Investment metrics
- 1% rule
- 1.00% ✓
- Cap rate
- 7.86%
- Cash-on-cash
- 5.59%
- DSCR
- 1.25
- GRM
- 8.3
CMA / ARV
- ARV (on-the-fly)
- $278,208
- Comps found
- 12
Show comp detail 12 sales within ~0.75 mi
| Address | Dist | Beds/Ba | Sqft | Sold | Price | $/sf | Match |
|---|---|---|---|---|---|---|---|
| 418 N Cliff Ave Ave | 0.00mi | 4/1.5 (+1) | 2,016 (0%) | 1mo | $189,000 | $94 | 88 |
| 1309 E 5th St | 0.08mi | 3/2.0 | 2,035 (+1%) | 14mo | $257,000 | $126 | 79 |
| 1601 E Tracy Ln Ln | 0.50mi | 4/2.5 (+1) | 2,001 (-1%) | 8mo | $335,000 | $167 | 62 |
| 703 N Van Eps Ave | 0.24mi | 4/2.0 (+1) | 2,152 (+7%) | 11mo | $263,000 | $122 | 59 |
| 1716 E Tracy Ln | 0.55mi | 3/2.0 | 1,988 (-1%) | 11mo | $366,000 | $184 | 59 |
| 1028 N Mable Cir Cir | 0.62mi | 4/2.0 (+1) | 2,120 (+5%) | 0mo | $371,500 | $175 | 53 |
| 1415 E 4th St | 0.23mi | 2/2.0 (-1) | 1,847 (-8%) | 16mo | $244,000 | $132 | 53 |
| 743 N Leadale Ave Ave | 0.61mi | 3/2.0 | 1,772 (-12%) | 4mo | $197,000 | $111 | 45 |
| 1624 E 5th St | 0.41mi | 4/2.5 (+1) | 2,230 (+11%) | 16mo | $230,500 | $103 | 43 |
| 2001 E 1st St | 0.63mi | 3/2.0 | 1,770 (-12%) | 13mo | $266,000 | $150 | 36 |
| 330 S Chicago Ave Ave | 0.74mi | 4/2.0 (+1) | 1,780 (-12%) | 2mo | $246,000 | $138 | 35 |
| 2004 E Madison St | 0.72mi | 4/2.0 (+1) | 1,756 (-13%) | 10mo | $272,004 | $155 | 28 |
Match score weights: distance 35% · size 25% · config 20% · recency 20%. Top-matched comps best support the ARV.
Projected returns pro-forma
-3.0% appreciation · 3.23% rent growth · sell at horizon
- IRR
- -7.4%
- Equity multiple
- 0.73×
- Total profit
- $-14,571
- Equity at exit
- $28,315
- IRR
- 2.4%
- Equity multiple
- 1.18×
- Total profit
- $9,400
- Equity at exit
- $16,419
Cash invested: $53,172 (down + closing). Projections, not guarantees.
Landlord ↔ Tenant lean methodology
- Overall (STATE)
- 83 Strongly Landlord-Friendly
- State South Dakota
- 83 Strongly Landlord-Friendly · R+16
- County
- — inherits STATE
- City
- — inherits STATE
ZIP-level market 57103
- Rents YoY
- 3.2%
- Active inventory
- 163
- Price-to-rent
- 8.3×
Monthly cashflow live
- Estimated rent
- $1,899 high interval (Pro) →
- Mortgage (P&I)
- −$996
- Tax from tax record
- −$178 /mo · $2,134/yr
- Insurance
- −$79
- HOA
- −$0
- Lot rent
- −$0
- Vacancy / Maint / Mgmt
- −$399
- Net cashflow
- $248
Break-even live
Sensitivity live
| Price | -10% $355 | -5% $301 | +0% $248 | +5% $194 | +10% $140 |
|---|---|---|---|---|---|
| Rent | -10% $98 | -5% $173 | +0% $248 | +5% $323 | +10% $398 |
| Rate | -1.0pp $343 | -0.5pp $296 | base $248 | +0.5pp $198 | +1.0pp $148 |
UW: 25.0% down · 7.5% · 30yr · 1.5% tax · 5.0% vac · 8.0% maint · 8.0% mgmt
Financing live
Cash to close
- Down payment
- $47,475
- Closing costs
- $5,697
- Reserves months
- —
- Total cash needed
- —
Loan-product check · same deal, 3 products live
Conventional
25% down · 7.5% · 30yr
- Down + closing
- —
- Monthly P&I
- —
- Monthly cashflow
- —
- DSCR
- —
- Eligible?
- —
Personal DTI + credit; lowest rate.
DSCR
20% down · 8.5% · 30yr
- Down + closing
- —
- Monthly P&I
- —
- Monthly cashflow
- —
- DSCR
- —
- Eligible?
- —
No personal income docs; deal must DSCR.
Hard money
10% down · 12.0% · 12mo
- Down + closing
- —
- Monthly P&I
- —
- Monthly cashflow
- —
- DSCR
- —
- Eligible?
- —
Short-term bridge; refi at stabilization.
Rent comps 7 comps
| Address | Beds | Baths | Sqft | Rent | $/sqft | DOM | Units | Dist |
|---|---|---|---|---|---|---|---|---|
| 440 E 8th St Sioux Falls, SD | 3.0 | 3.0 | 1900 | $4,800 | $2.53 | 23d | 1 | 0.57mi |
| 310 N Reid Pl Sioux Falls, SD | 3.0 | 1.0–3.0 | 1251 | $5,000 | $4.00 | 15d | 7 | 0.59mi |
| 101 S Main Ave Sioux Falls, SD | 1.0–2.0 | 1.0–2.0 | 1143 | $2,450 | $2.14 | 46d | 2 | 0.95mi |
| 3210 E 3rd St Unit 3210 Sioux Falls, SD | 3.0 | 2.0 | 2100 | $1,895 | $0.90 | 23d | 1 | 1.29mi |
| 1318 S 4th Ave Sioux Falls, SD | 2.0 | 1.0 | 1550 | $1,850 | $1.19 | 46d | 1 | 1.45mi |
| 633 N Menlo Ave Sioux Falls, SD | 4.0 | 1.5 | 1450 | $1,750 | $1.21 | 23d | 1 | 1.48mi |
| 807 W 13th St Sioux Falls, SD | 4.0 | 2.0 | 1708 | $1,799 | $1.05 | 23d | 1 | 1.50mi |
Listing history 25 events
-
2026-05-10status Pending
-
2026-05-07$189,900 Active
-
2026-04-14$130,000 Active
-
2022-10-01historical
-
2022-09-28status Active
-
2022-09-08historical Active - Contingent Misc
-
2022-08-18$162,400 Active - New
-
2022-08-18historical
-
2022-08-12$174,900 Active - New
-
2022-08-12historical
-
2022-08-01price $182,000
-
2022-07-28price $189,900
-
2022-07-22$197,500 Active - New
-
2020-06-19soldstatus $100,000
-
2020-05-01$100,000
-
2020-05-01historical
-
2020-01-16$100,000
-
2020-01-16historical
-
2020-01-03$107,000
-
2020-01-01historical
-
2019-09-27$107,000
-
2011-02-04soldstatus $76,900
-
2011-01-07historical
-
2010-09-02$76,900
-
2004-03-23soldstatus $52,900
ⓘ Source: listings_history table (triggers on properties + properties_extension) + one-shot
backfill from property_details.listing_events for pre-trigger history.
Tax reassessment forecast SD · Resets to sale price
- Current annual tax
- $2,134 · $178/mo
- Projected year-2 tax
- $2,488 · $207/mo
- Expected delta
- +$354/yr (+$29/mo · 16.6%)
ⓘ Screening estimate from a state-policy table — verify with the county assessor before closing.
Climate risk First Street
- Flood 1/10 Low FEMA zone X (unshaded) · 0% chance over 30 yrs
- Wildfire 1/10 Low
- Heat 2/10 Low 7 d/yr ≥99°F today · 14 d/yr by 30 yrs out
- Wind 2/10 Low
- Air quality 2/10 Low 1 unhealthy d/yr today · 1 by 30 yrs out
Nearby sold comps map
Loading sold comps map…
Walkable amenities ~0.75 mi
Loading nearby amenities…
Taxation est. · year 1
- Rental income
- $22,791
- − Mortgage interest
- −$10,637
- − Property taxes
- −$2,134
- − Insurance
- −$950
- − Repairs & maintenance
- −$1,823
- − Management
- −$1,823
- − Depreciation
- −$5,524
- Taxable loss
- −$101
- Est. tax savings @ 24.0%
- +$24
- After-tax cash flow
- $2,995/yr
For passive investors: Depreciation is non-cash, so a rental often shows a tax loss while cash-flowing — sheltering income. Rental losses are passive: they offset passive income freely, and up to $25,000/yr can offset ordinary (W-2) income if you actively participate and your MAGI is under $100k (phasing out to $0 by $150k); unused losses carry forward. On sale, claimed depreciation is recaptured at up to 25%, and gains may owe capital-gains tax (a 1031 exchange can defer both). Figures are a year-1 estimate at your 24.0% rate — not tax advice; consult a CPA.
Schools (NCES district)
- District
- Sioux Falls School District 49-5
- NCES district ID
- 4666270
- Math proficiency
- 39% ▼ -4.00%
- Reading proficiency
- 48% ▼ -2.00%
- Median HH income
- $51,093
- Composite
- 37.47/100
- National rank
- #4407
- State rank
- #45 of 59 in SD
Livability — Sioux Falls
- Score
- 85/100
- State rank
- #3
- US rank
- #610
Category grades
Schools grade is shown separately in the Schools card above.
Census & demographics
- Census place
- Sioux Falls, SD
- County
- Minnehaha County · 191,523 people
- City population
- 207,623
- Metro
- Sioux Falls, SD
- Population (ZIP)
- 35,582
- Household income
- $72,831
- Rent vs Own
- Severe rent burden
- 867.0
Population outlook (Minnehaha County) Hauer SSP2
- Today (2025)
- 222,323 people
- By 2030
- 241,430 · +8.6%
- By 2040
- 281,643 · +26.7%
- By 2050
- 325,574 · +46.4%
- By 2075
- 469,313 · +111.1%
- By 2100
- 664,763 · +199.0%
Race, ethnicity, and origin ACS 2023
- Neighborhood character
- Predominantly White (73%)
- Race & ethnicity
- White 73% Black 10% Two or more races 9% Hispanic / Latino 7% Asian 2% Native American 2%
- Hispanic origin (detail)
- Mexican 3%
- Common ancestry
- Portuguese 11% Iranian 5% Italian 2%
- Foreign-born
- 10% · Canada, India
- Languages at home
- 86% English-only · Spanish 5% Other Indo-European 2% Other Asian/Pacific 1%
Political lean MEDSL · Minnehaha
- 2024 margin
- R (+12.7) · D 42.5% · R 55.2% · Other 2.4%
- 2008→2024 swing
- -13.4pp toward R · 2008: 0.7pp · 2024: -12.7pp
- All cycles
- 2024: R+12.7 2020: R+9.5 2016: R+14.6 2012: R+7.4 2008: D+0.7
Not yet ingested
- Civics
- —
Market trends
- HPI YoY
- ▼ -163.45%
- Current HPI
- 221.5758
- Rent YoY
- ▲ 3.23%
- Metro
- Sioux Falls, SD
- State GDP YoY
- ▲ 0.70%
- F500 in state
- 2
Industry mix (Fortune 500 HQ in SD)
| Industry | F500 HQs | Revenue |
|---|---|---|
| Utilities | 1 | $1B |
|
||
Price history
+259.0% since first listed25 events — show timeline
- 2026-05-10 Pending — REALTOR® Association of the Sioux Empire
- 2026-05-07 Listed $189,900 REALTOR® Association of the Sioux Empire
- 2026-04-14 Listed $130,000 REALTOR® Association of the Sioux Empire
- 2022-10-01 Listing Removed — REALTOR® Association of the Sioux Empire
- 2022-09-28 Relisted — REALTOR® Association of the Sioux Empire
- 2022-09-08 Contingent — REALTOR® Association of the Sioux Empire
- 2022-08-18 Listing Removed — REALTOR® Association of the Sioux Empire
- 2022-08-18 Listed $162,400 REALTOR® Association of the Sioux Empire
- 2022-08-12 Listing Removed — REALTOR® Association of the Sioux Empire
- 2022-08-12 Listed $174,900 REALTOR® Association of the Sioux Empire
- 2022-08-01 Price Changed $182,000 REALTOR® Association of the Sioux Empire
- 2022-07-28 Price Changed $189,900 REALTOR® Association of the Sioux Empire
- 2022-07-22 Listed $197,500 REALTOR® Association of the Sioux Empire
- 2020-06-19 Sold (Public Records) $100,000 Public Records
- 2020-05-01 Listing Removed — REALTOR® Association of the Sioux Empire
- 2020-05-01 Listed $100,000 REALTOR® Association of the Sioux Empire
- 2020-01-16 Listing Removed — REALTOR® Association of the Sioux Empire
- 2020-01-16 Listed $100,000 REALTOR® Association of the Sioux Empire
- 2020-01-03 Listed $107,000 REALTOR® Association of the Sioux Empire
- 2020-01-01 Listing Removed — REALTOR® Association of the Sioux Empire
- 2019-09-27 Listed $107,000 REALTOR® Association of the Sioux Empire
- 2011-02-04 Sold (Public Records) $76,900 Public Records
- 2011-01-07 Listing Removed — REALTOR® Association of the Sioux Empire
- 2010-09-02 Listed $76,900 REALTOR® Association of the Sioux Empire
- 2004-03-23 Sold (Public Records) $52,900 Public Records
Property tax history
+4.1%/yrLatest (2024): $2,134 · -12.0% YoY. Source: county tax records.
Cash-flow waterfall
monthlySold comps — $/sqft
last 12 mo · ≤1 miLoading sold comps…