 🏗️ New Construction
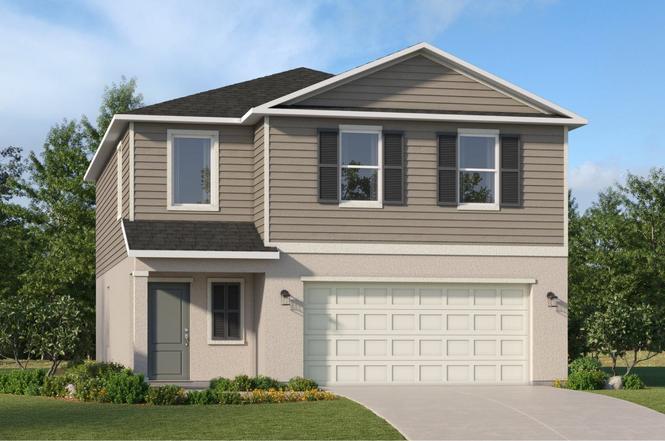
Columbus Plan · Dade City, FL
Flood risk No data
- FEMA flood zone
- —
- Chance of flooding over 30 yrs
- —
- Est. flood insurance / yr
- —
Fire risk No data
- Est. fire insurance / yr
- —
Heat risk No data
- Hot days now (above threshold)
- —
- Hot days in 30 yrs
- —
Wind risk No data
- Chance of severe wind over 30 yrs
- —
Air-quality risk No data
- Unhealthy air days now
- —
- Unhealthy air days in 30 yrs
- —
Risk factors via First Street. Map © Google.
Why this score? — see what drove the D grade
The composite is a weighted blend of 9 inputs, each scored 0–100. Each bar is that input's sub-score; the figure is the points it added to the 100-point composite (weight × sub-score).
- Cash flow +12.1/30.0
- ARV discount +7.5/15.0
- Schools +4.3/10.0
- Livability +3.7/5.0
- DSCR +3.6/10.0
- 1% rule +3.5/10.0
- Rent growth +3.3/5.0
- Condition / age +2.5/5.0
- Appreciation +0.0/10.0
$317,900
🖨 Deal sheet (PDF) 📄 Offer letter ✓ Due diligence
Key facts
- Serene owner's suite
- Open concept design
- Spacious loft
Tags
Property features AI
Finance
- Other:
- Financial info:
- HOA & community:
Exterior
- Parking: 2 garage spaces (2 total parking spaces)
- Security:
- Utilities:
- Home design: Single-family new construction (Columbus plan)
- Construction:
- Exterior features: Living area approximately 1874 (provided)
Interior
- Kitchen:
- Bedrooms: 4 bedrooms
- Flooring:
- Bathrooms: 2 full bathrooms and 1 half bathroom (2.5 total)
- Heating & cooling:
- Interior features: Open floor plan (model: Columbus, new construction plan)
- Laundry & utility:
Neighborhood map
What this means for you Summary
Snapshot
- This is a 4-bed/2.5-bath single-family listed at $318k.
Deal economics
- At list price, monthly cash flow is $-68 ($-814/yr) — negative.
- To cash-flow at today's rent, offer at most $309k (2.9% below list).
- To meet the 1% rule (rent ≥ 1% of price), the offer needs to be $270k (15.0% below list).
- Recommended offer: $270k (15.0% below list) — sets the bar for 1% rule.
- Cap rate 6.0% vs local median 4.6% in Dade City — top-decile yield for the area; either an underpriced asset or a hidden risk that comps aren't pricing in. Stress-test before assuming the spread holds.
Location & tenants
- Location reads 73/100 on livability (#307 in FL) — a middle-class / working-renter tenant base. Strengths: cost of living A+, housing A+, health & safety A+; Watch: employment C-, amenities F, commute F.
- Pasco (suburban): math 50% / reading 52% proficiency, ranked #32 of 73 in FL (top 44%) — acceptable for families but not a draw, mixed tenant base, ~2y average lease.
- Zoned schools: San Antonio Elementary School (math 49% / reading 52%, grade D+, #1,055 of 2,144 statewide, top 50%, 573 students, 50% FRL); Pasco Middle School (math 38% / reading 38%, grade F, #388 of 571 statewide, top 69%, 903 students, 73% FRL); Pasco High School (math 40% / reading 40%, grade F, #296 of 667 statewide, top 45%, 1,639 students, 66% FRL).
- Market conditions: Rents rising (+3.0%/yr); 674 active listings in the ZIP; 4 comparable units currently listed for rent nearby; rentals leasing fast (median 1d on market — plan ~1-2 weeks tenant-placement turnaround); 6,765 units permitted in Pasco County in 2024 (1,250 in 5+ unit buildings).
- At $2,701/mo this rent would consume 47% of the median local household income ($69k/yr) (locally 322% of renters already pay >50% of income on rent) — very limited rent-growth headroom before tenants either downsize or default.
Forward outlook
- Local home prices are declining (-3.0%/yr); year-one equity from $2k of loan paydown is wiped out by about $10k of value loss. Plan a longer hold.
- Pasco County population projected at +29% by 2050 — long-run rental-demand tailwind backs the buy-and-hold thesis.
Negotiation context
- It's been on market 454 days — a 12% lower offer ($280k) is reasonable based on typical stale-listing flexibility.
Questions for the listing agent
- What do current leases actually rent for vs. the listed asking? Can we see a recent rent roll and the last 12 months of T-12 income?
- It's been on market 454 days. Have you received any prior offers? Is the seller open to a 15% concession, seller financing, or rate buy-down credit?
- Why hasn't it sold? Are there any deal-killer items the seller is aware of (foundation, flood, title, zoning, code violations)?
- Is there a deadline driving the sale (1031 exchange, divorce, estate, relocation)? That informs how much negotiation room exists.
- Schools are D-rated, which usually means shorter tenancies and higher turnover. Who's the typical renter profile here, and what's been the actual vacancy rate?
- The area grade is low — what's the realistic commute time and amenity access for the typical tenant pool here? Any planned neighborhood developments (good or bad) we should know about?
- What's the average days-on-market for RENTAL listings here right now (not sales)? A rising rental-DOM trend means longer vacancies and softer asking-rent achievability than the comps imply.
- What's the recent tenant-quality profile in this submarket — average credit score on applications, eviction rate, late-payment / NSF rate, and stable-employment percentage? A property-management company in the area should have these aggregated.
- How much new for-sale + rental construction is in the pipeline within 1–3 miles? Heavy new supply typically softens prices + rents 12–24 months out; constrained supply supports both.
Investment metrics
- 1% rule
- 0.85% ✗
- Cap rate
- 6.04%
- Cash-on-cash
- -0.91%
- DSCR
- 0.96
- GRM
- 9.8
CMA / ARV
- ARV (on-the-fly)
- $318,580
- Comps found
- 12
Show comp detail 12 sales within ~0.75 mi
| Address | Dist | Beds/Ba | Sqft | Sold | Price | $/sf | Match |
|---|---|---|---|---|---|---|---|
| 11784 Brae Way | 0.08mi | 4/2.5 | 1,874 (0%) | 12mo | $314,000 | $168 | 86 |
| 11737 Brae Way | 0.12mi | 4/2.5 | 1,874 (0%) | 12mo | $324,900 | $173 | 84 |
| 11119 Brae Way | 0.18mi | 4/2.0 | 1,824 (-3%) | 2mo | $315,900 | $173 | 84 |
| 11662 Brae Way | 0.20mi | 4/2.5 | 1,874 (0%) | 10mo | $319,000 | $170 | 82 |
| 11938 Brae Way | 0.08mi | 4/2.0 | 1,824 (-3%) | 12mo | $344,900 | $189 | 80 |
| 12004 Brae Way | 0.15mi | 4/2.0 | 1,824 (-3%) | 10mo | $329,900 | $181 | 78 |
| 11974 Brae Way | 0.12mi | 4/2.0 | 1,824 (-3%) | 12mo | $334,900 | $184 | 78 |
| 12038 Brae Way | 0.18mi | 4/2.0 | 1,824 (-3%) | 9mo | $305,150 | $167 | 78 |
| 11775 Brae Way | 0.09mi | 5/2.5 (+1) | 2,112 (+13%) | 12mo | $339,900 | $161 | 60 |
| 11713 Brae Way | 0.15mi | 5/2.5 (+1) | 2,112 (+13%) | 10mo | $332,050 | $157 | 58 |
| 11732 Brae Way | 0.13mi | 5/2.5 (+1) | 2,112 (+13%) | 12mo | $331,510 | $157 | 58 |
| 11592 Brae Way | 0.27mi | 5/2.5 (+1) | 2,112 (+13%) | 8mo | $329,400 | $156 | 55 |
Match score weights: distance 35% · size 25% · config 20% · recency 20%. Top-matched comps best support the ARV.
Projected returns pro-forma
-3.0% appreciation · 3.02% rent growth · sell at horizon
- IRR
- -17.8%
- Equity multiple
- 0.37×
- Total profit
- $-55,848
- Equity at exit
- $47,501
- IRR
- -9.8%
- Equity multiple
- 0.40×
- Total profit
- $-53,805
- Equity at exit
- $27,545
Cash invested: $89,202 (down + closing). Projections, not guarantees.
Landlord ↔ Tenant lean methodology
- Overall (STATE)
- 87 Strongly Landlord-Friendly
- State Florida
- 87 Strongly Landlord-Friendly · R+3
- County
- — inherits STATE
- City
- — inherits STATE
ZIP-level market 33525
- Home prices YoY
- -15.4%
- Rents YoY
- 3.0%
- Active inventory
- 674
- Price-to-rent
- 9.8×
Monthly cashflow live
- Estimated rent
- $2,701 medium interval (Pro) →
- Mortgage (P&I)
- −$1,671
- Tax est. 1.5%
- −$398 /mo · $4,779/yr
- Insurance
- −$133
- HOA
- −$0
- Vacancy / Maint / Mgmt
- −$567
- Net cashflow
- $-68
Break-even live
Sensitivity live
| Price | -10% $152 | -5% $42 | +0% $-68 | +5% $-178 | +10% $-288 |
|---|---|---|---|---|---|
| Rent | -10% $-281 | -5% $-175 | +0% $-68 | +5% $39 | +10% $146 |
| Rate | -1.0pp $93 | -0.5pp $13 | base $-68 | +0.5pp $-150 | +1.0pp $-234 |
UW: 25.0% down · 7.5% · 30yr · 1.5% tax · 5.0% vac · 8.0% maint · 8.0% mgmt
Financing live
Cash to close
- Down payment
- $79,645
- Closing costs
- $9,557
- Reserves months
- —
- Total cash needed
- —
Loan-product check · same deal, 3 products live
Conventional
25% down · 7.5% · 30yr
- Down + closing
- —
- Monthly P&I
- —
- Monthly cashflow
- —
- DSCR
- —
- Eligible?
- —
Personal DTI + credit; lowest rate.
DSCR
20% down · 8.5% · 30yr
- Down + closing
- —
- Monthly P&I
- —
- Monthly cashflow
- —
- DSCR
- —
- Eligible?
- —
No personal income docs; deal must DSCR.
Hard money
10% down · 12.0% · 12mo
- Down + closing
- —
- Monthly P&I
- —
- Monthly cashflow
- —
- DSCR
- —
- Eligible?
- —
Short-term bridge; refi at stabilization.
Rent comps 4 comps
| Address | Beds | Baths | Sqft | Rent | $/sqft | DOM | Units | Dist |
|---|---|---|---|---|---|---|---|---|
| 11413 Brae Way Dade City, FL | 5.0 | 2.5 | 2326 | $2,700 | $1.16 | 26d | 1 | 0.13mi |
| 28882 Renda Ln San Antonio, FL | 1.0–3.0 | 1.0–2.0 | 1059 | $2,390 | $2.26 | 0d | 21 | 1.30mi |
| 11000 Old Pasco Rd San Antonio, FL | 3.0 | 2.0 | 1371 | $2,200 | $1.60 | 1d | 1 | 1.45mi |
| 11279 Old Pasco Rd San Antonio, FL | 3.0 | 2.0 | 1371 | $2,200 | $1.60 | 1d | 1 | 1.47mi |
Listing history 15 events
-
2026-06-18price $317,900 Active 454 DOM
-
2026-06-18days on market $317,800 Active 454 DOM
-
2026-06-18price $317,800 Active 453 DOM
-
2026-06-17pricedays on market $317,700 Active 453 DOM
-
2026-06-16days on market $317,600 Active 452 DOM
-
2026-06-15days on market $317,600 Active 451 DOM
-
2026-06-13pricedays on market $317,600 Active 449 DOM
-
2026-06-09days on market $317,400 Active 445 DOM
-
2026-06-08days on market $317,400 Active 444 DOM
-
2026-06-07pricedays on market $317,400 Active 443 DOM
-
2026-06-04pricedays on market $317,300 Active 440 DOM
-
2026-06-03days on market $317,200 Active 439 DOM
-
2026-06-02pricedays on market $317,200 Active 438 DOM
-
2026-06-01days on market $327,200 Active 437 DOM
-
2026-05-31days on market $327,200 Active 436 DOM
ⓘ Source: listings_history table (triggers on properties + properties_extension) + one-shot
backfill from property_details.listing_events for pre-trigger history.
Nearby sold comps map
Loading sold comps map…
Walkable amenities ~0.75 mi
Loading nearby amenities…
Taxation est. · year 1
- Rental income
- $32,412
- − Mortgage interest
- −$17,845
- − Property taxes
- −$4,779
- − Insurance
- −$1,593
- − Repairs & maintenance
- −$2,593
- − Management
- −$2,593
- − Depreciation
- −$9,268
- Taxable loss
- −$6,258
- Est. tax savings @ 24.0%
- +$1,502
- After-tax cash flow
- $688/yr
For passive investors: Depreciation is non-cash, so a rental often shows a tax loss while cash-flowing — sheltering income. Rental losses are passive: they offset passive income freely, and up to $25,000/yr can offset ordinary (W-2) income if you actively participate and your MAGI is under $100k (phasing out to $0 by $150k); unused losses carry forward. On sale, claimed depreciation is recaptured at up to 25%, and gains may owe capital-gains tax (a 1031 exchange can defer both). Figures are a year-1 estimate at your 24.0% rate — not tax advice; consult a CPA.
Schools (NCES district)
- District
- Pasco
- NCES district ID
- 1201530
- Math proficiency
- 50% ▼ -10.00%
- Reading proficiency
- 52% ▼ -5.00%
- Median HH income
- $45,039
- Composite
- 43.14/100
- National rank
- #3074
- State rank
- #32 of 73 in FL
Livability — Dade City
- Score
- 73/100
- State rank
- #307
- US rank
- #5215
Category grades
Schools grade is shown separately in the Schools card above.
Census & demographics
- County
- Pasco County · 524,098 people
- City population
- 21,077
- Metro
- Tampa-St. Petersburg-Clearwater, FL
- Population (ZIP)
- 21,077
- Household income
- $69,068
- Rent vs Own
- Severe rent burden
- 322.0
Population outlook (Pasco County) Hauer SSP2
- Today (2025)
- 570,045 people
- By 2030
- 605,844 · +6.3%
- By 2040
- 674,806 · +18.4%
- By 2050
- 736,022 · +29.1%
- By 2075
- 862,900 · +51.4%
- By 2100
- 906,364 · +59.0%
Race, ethnicity, and origin ACS 2023
- Neighborhood character
- Predominantly White (76%)
- Race & ethnicity
- White 76% Hispanic / Latino 16% Two or more races 7% Black 3%
- Hispanic origin (detail)
- Mexican 9% Puerto Rican 3%
- Common ancestry
- Lithuanian 2% Romanian 2% Serbian 2%
- Foreign-born
- 6% · Canada, Jamaica
- Languages at home
- 87% English-only · Spanish 11% Other Asian/Pacific 1% Other Indo-European 1%
Political lean MEDSL · Pasco
- 2024 margin
- Strong R (+25.2) · D 36.9% · R 62.1% · Other 1.0%
- 2008→2024 swing
- -21.6pp toward R · 2008: -3.6pp · 2024: -25.2pp
- All cycles
- 2024: R+25.2 2020: R+20.1 2016: R+21.6 2012: R+6.7 2008: R+3.6
Not yet ingested
- Civics
- —
Market trends
- HPI YoY
- ▼ -65.48%
- Current HPI
- 358.2149
- Rent YoY
- ▲ 3.02%
- Metro
- Tampa-St. Petersburg-Clearwater, FL
- State GDP YoY
- ▲ 3.28%
- F500 in state
- 36
Industry mix (Fortune 500 HQ in FL)
| Industry | F500 HQs | Revenue |
|---|---|---|
| Industrial Technology | 2 | $29B |
|
||
| Insurance | 2 | $17B |
|
||
| Retail | 1 | $60B |
|
||
| Technology Distribution | 1 | $58B |
|
||
| Homebuilding | 1 | $35B |
|
||
| Technology Manufacturing | 1 | $35B |
|
||
Cash-flow waterfall
monthlySold comps — $/sqft
last 12 mo · ≤1 miLoading sold comps…