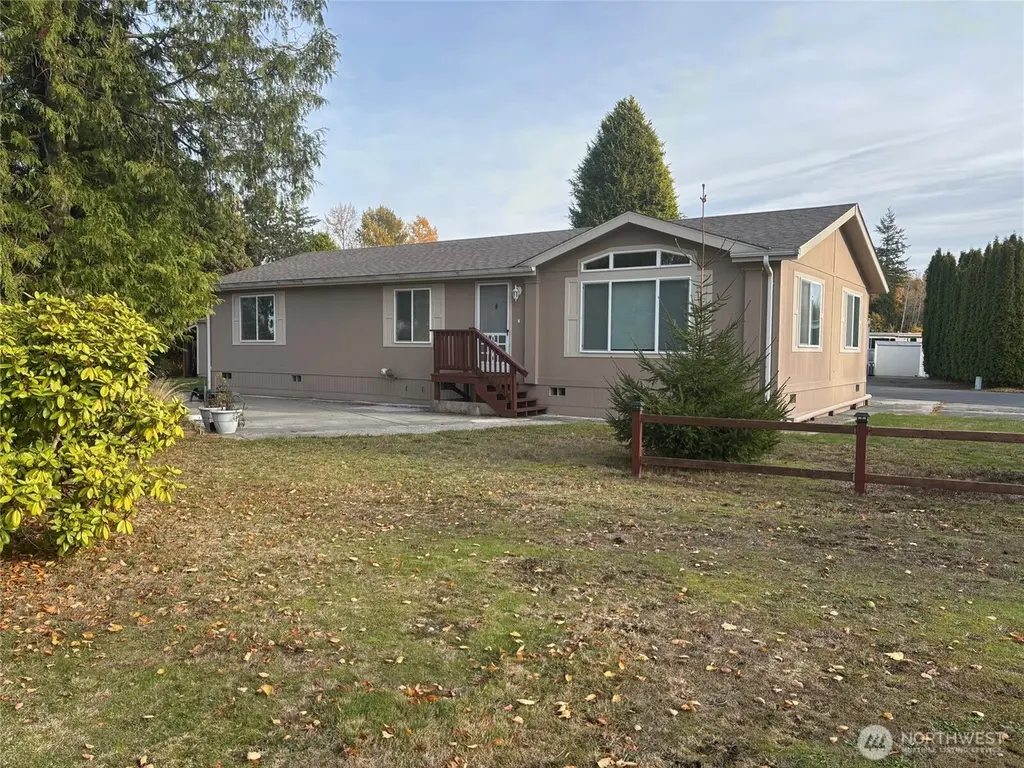
8370 Harborview Rd #7 · Birch Bay, WA
Flood risk 1/10 · Minimal
- FEMA flood zone
- X (unshaded)
- Chance of flooding over 30 yrs
- 0.0%
- Est. flood insurance / yr
- $507 – $1,088
Fire risk 1/10 · Minimal
- Est. fire insurance / yr
- $604 – $1,122
Heat risk 3/10 · Minor
- Hot days now (above 81°F)
- 7 days/yr
- Hot days in 30 yrs
- 19 days/yr
Wind risk 1/10 · Minimal
- Chance of severe wind over 30 yrs
- —
Air-quality risk 6/10 · Moderate
- Unhealthy air days now
- 7 days/yr
- Unhealthy air days in 30 yrs
- 10 days/yr
Risk factors via First Street. Map © Google.
Why this score? — see what drove the D grade
The composite is a weighted blend of 9 inputs, each scored 0–100. Each bar is that input's sub-score; the figure is the points it added to the 100-point composite (weight × sub-score).
- Cash flow +12.6/30.0
- Appreciation +10.0/10.0
- Schools +4.7/10.0
- 1% rule +4.2/10.0
- DSCR +3.8/10.0
- Rent growth +3.3/5.0
- Livability +3.1/5.0
- Condition / age +2.5/5.0
- ARV discount +0.0/15.0
$329,900
🖨 Deal sheet 📄 Offer letter ✓ Due diligence
Listing remarks
This well-cared-for 3-bed/2-bath home provides a peaceful setting, thoughtful updates, and affordable monthly expenses, creating an easy, comfortable lifestyle in a 55+ community. Ownership includes 1/18th share of the park. Year: 2000 / 1512 square ft No space rent HOA dues: $150/month (covers water, sewer, streetlights, and park property taxes, NOT home taxes) HOA buy-in fee: $500. Updates on the home include a new water heater, dishwasher, kitchen range, internet thermostat, toilet & shower in master bath, new roof in 2021 and an Electric Vehicle Charger that was installed in August of 2024. Outdoor shed is 10' x 16' with 5' lean-to in back. Located in the desirable Birch Ba
Key facts
- New water heater
- Outdoor shed
- New roof
Tags
Neighborhood map
What this means for you Summary
Snapshot
- This is a 3-bed/2.0-bath manufactured listed at $330k.
Deal economics
- At list price, monthly cash flow is $-41 ($-489/yr) — negative.
- To cash-flow at today's rent, offer at most $324k (1.8% below list).
- To meet the 1% rule (rent ≥ 1% of price), the offer needs to be $302k (8.3% below list).
- Recommended offer: $290k (12.0% below list) — sets the bar for market timing.
- Cap rate 6.1% vs local median 2.6% in Birch Bay — top-decile yield for the area; either an underpriced asset or a hidden risk that comps aren't pricing in. Stress-test before assuming the spread holds.
Location & tenants
- Location reads 62/100 on livability (#406 in WA) — a middle-class / working-renter tenant base. Strengths: housing A; Watch: cost of living D+, health & safety D, schools F.
- Blaine School District (town): math 49% / reading 55% proficiency, ranked #120 of 291 in WA (top 41%) — acceptable for families but not a draw, mixed tenant base, ~2y average lease.
- Market conditions: Rents rising (+3.1%/yr); 454 active listings in the ZIP; 1 comparable units currently listed for rent nearby; solid renter incomes; 1,190 units permitted in Whatcom County in 2024 (327 in 5+ unit buildings).
- This rent runs 42% of the median local income ($87k/yr) — at the standard rent-burdened threshold; future hikes will face affordability resistance.
Forward outlook
- In year one you build about $35k of equity ($2k loan paydown + $33k appreciation (10.0% local appreciation)).
- Whatcom County population projected at +28% by 2050 — long-run rental-demand tailwind backs the buy-and-hold thesis.
- At projected returns (10.0% appreciation + 3.1% rent growth), your $92k cash investment doubles in ~3 years — after that, you're playing with house money.
- By year 2, paydown + projected appreciation supports a ~$57k cash-out refi (75% LTV) — recoverable capital for the next deal without selling this one.
Negotiation context
- It's been on market 225 days — a 12% lower offer ($290k) is reasonable based on typical stale-listing flexibility.
Questions for the listing agent
- What do current leases actually rent for vs. the listed asking? Can we see a recent rent roll and the last 12 months of T-12 income?
- It's been on market 225 days. Have you received any prior offers? Is the seller open to a 12% concession, seller financing, or rate buy-down credit?
- What does the HOA fee cover, when was the last increase, and are there any pending special assessments or reserve-fund shortfalls?
- Why hasn't it sold? Are there any deal-killer items the seller is aware of (foundation, flood, title, zoning, code violations)?
- Is there a deadline driving the sale (1031 exchange, divorce, estate, relocation)? That informs how much negotiation room exists.
- Schools are F-rated, which usually means shorter tenancies and higher turnover. Who's the typical renter profile here, and what's been the actual vacancy rate?
- The area grade is low — what's the realistic commute time and amenity access for the typical tenant pool here? Any planned neighborhood developments (good or bad) we should know about?
- What's the average days-on-market for RENTAL listings here right now (not sales)? A rising rental-DOM trend means longer vacancies and softer asking-rent achievability than the comps imply.
- What's the recent tenant-quality profile in this submarket — average credit score on applications, eviction rate, late-payment / NSF rate, and stable-employment percentage? A property-management company in the area should have these aggregated.
- How much new for-sale + rental construction is in the pipeline within 1–3 miles? Heavy new supply typically softens prices + rents 12–24 months out; constrained supply supports both.
Investment metrics
- 1% rule
- 0.92% ✗
- Cap rate
- 6.14%
- Cash-on-cash
- -0.53%
- DSCR
- 0.98
- GRM
- 9.1
CMA / ARV
- ARV (median comp)
- $280,024
- List price
- $329,900
- Delta
- 17.81%
- Verdict
- OVERPRICED
- Comps
- 5 within 1.0 mi
Show comp detail 6 sales within ~0.75 mi
| Address | Dist | Beds/Ba | Sqft | Sold | Price | $/sf | Match |
|---|---|---|---|---|---|---|---|
| 8370 Harborview Rd #18 | 0.00mi | 3/2.0 | 1,593 (+5%) | 14mo | $367,000 | $230 | 79 |
| 4702 Anderson Rd | 0.50mi | 3/2.0 | 1,512 (0%) | 1mo | $653,000 | $432 | 76 |
| 5001 Fir St | 0.46mi | 3/2.0 | 1,404 (-7%) | 11mo | $351,250 | $250 | 57 |
| 5070 Alder St | 0.61mi | 3/2.0 | 1,344 (-11%) | 20mo | $341,000 | $254 | 36 |
| 8585 Harborview Rd #18 | 0.60mi | 2/1.5 (-1) | 1,296 (-14%) | 10mo | $278,888 | $215 | 32 |
| 4672 Birch Bay Lynden Rd #128 | 0.69mi | 3/2.0 | 1,344 (-11%) | 22mo | $190,984 | $142 | 31 |
Match score weights: distance 35% · size 25% · config 20% · recency 20%. Top-matched comps best support the ARV.
Projected returns pro-forma
10.0% appreciation · 3.1% rent growth · sell at horizon
- IRR
- 24.0%
- Equity multiple
- 2.92×
- Total profit
- $177,519
- Equity at exit
- $297,200
- IRR
- 21.3%
- Equity multiple
- 6.69×
- Total profit
- $525,700
- Equity at exit
- $640,923
Cash invested: $92,372 (down + closing). Projections, not guarantees.
Landlord ↔ Tenant lean methodology
- Overall (STATE)
- 28 Tenant-Leaning
- State Washington
- 28 Tenant-Leaning · D+8
- County
- — inherits STATE
- City
- — inherits STATE
ZIP-level market 98230
- Home prices YoY
- 14.0%
- Rents YoY
- 3.1%
- Active inventory
- 454
- Price-to-rent
- 9.1×
Monthly cashflow live
- Estimated rent
- $3,024 medium interval (Pro) →
- Mortgage (P&I)
- −$1,730
- Tax est. 1.5%
- −$412 /mo · $4,948/yr
- Insurance
- −$137
- HOA
- −$150
- Vacancy / Maint / Mgmt
- −$635
- Net cashflow
- $-41
Break-even live
UW: 25.0% down · 7.5% · 30yr · 1.5% tax · 5.0% vac · 8.0% maint · 8.0% mgmt
Financing live
Cash to close
- Down payment
- $82,475
- Closing costs
- $9,897
- Reserves months
- —
- Total cash needed
- —
Loan-product check · same deal, 3 products live
Conventional
25% down · 7.5% · 30yr
- Down + closing
- —
- Monthly P&I
- —
- Monthly cashflow
- —
- DSCR
- —
- Eligible?
- —
Personal DTI + credit; lowest rate.
DSCR
20% down · 8.5% · 30yr
- Down + closing
- —
- Monthly P&I
- —
- Monthly cashflow
- —
- DSCR
- —
- Eligible?
- —
No personal income docs; deal must DSCR.
Hard money
10% down · 12.0% · 12mo
- Down + closing
- —
- Monthly P&I
- —
- Monthly cashflow
- —
- DSCR
- —
- Eligible?
- —
Short-term bridge; refi at stabilization.
Rent comps 1 comps
| Address | Beds | Baths | Sqft | Rent | $/sqft | DOM | Units | Dist |
|---|---|---|---|---|---|---|---|---|
| 8638 Harborview Rd Blaine, WA | 3.0 | 3.0 | 2200 | $4,250 | $1.93 | 13d | 1 | 0.66mi |
HOA detail
- Monthly dues
- $150 · $1,800/yr
- Likely covers
- watersewerelectricinternet
Listing history 21 events
-
2026-06-18days on market $329,900 Active 225 DOM
-
2026-06-17days on market $329,900 Active 224 DOM
-
2026-06-16days on market $329,900 Active 223 DOM
-
2026-06-15days on market $329,900 Active 222 DOM
-
2026-06-14days on market $329,900 Active 220 DOM
-
2026-06-13days on market $329,900 Active 219 DOM
-
2026-06-10days on market $329,900 Active 217 DOM
-
2026-06-09days on market $329,900 Active 216 DOM
-
2026-06-08days on market $329,900 Active 215 DOM
-
2026-06-07days on market $329,900 Active 214 DOM
-
2026-06-05days on market $329,900 Active 211 DOM
-
2026-06-02days on market $329,900 Active 209 DOM
-
2026-06-01days on market $329,900 Active 208 DOM
-
2026-05-31days on market $329,900 Active 207 DOM
-
2026-05-30days on market $329,900 Active 206 DOM
-
2026-05-15price $329,900
-
2026-04-17price $334,900
-
2026-03-30price $339,000
-
2026-03-14price $349,900
-
2026-01-29price $360,000
-
2025-11-05$365,000 Active
ⓘ Source: listings_history table (triggers on properties + properties_extension) + one-shot
backfill from property_details.listing_events for pre-trigger history.
Climate risk First Street
- Flood 1/10 Low FEMA zone X (unshaded) · 0% chance over 30 yrs
- Wildfire 1/10 Low
- Heat 3/10 Moderate 7 d/yr ≥81°F today · 19 d/yr by 30 yrs out
- Wind 1/10 Low
- Air quality 6/10 Major 7 unhealthy d/yr today · 10 by 30 yrs out
Nearby sold comps map
Loading sold comps map…
Walkable amenities ~0.75 mi
Loading nearby amenities…
Taxation est. · year 1
- Rental income
- $36,290
- − Mortgage interest
- −$18,480
- − Property taxes
- −$4,948
- − Insurance
- −$1,650
- − Repairs & maintenance
- −$2,903
- − Management
- −$2,903
- − HOA
- −$1,800
- − Depreciation
- −$9,597
- Taxable loss
- −$5,991
- Est. tax savings @ 24.0%
- +$1,438
- After-tax cash flow
- $949/yr
For passive investors: Depreciation is non-cash, so a rental often shows a tax loss while cash-flowing — sheltering income. Rental losses are passive: they offset passive income freely, and up to $25,000/yr can offset ordinary (W-2) income if you actively participate and your MAGI is under $100k (phasing out to $0 by $150k); unused losses carry forward. On sale, claimed depreciation is recaptured at up to 25%, and gains may owe capital-gains tax (a 1031 exchange can defer both). Figures are a year-1 estimate at your 24.0% rate — not tax advice; consult a CPA.
Schools (NCES district)
- District
- Blaine School District
- NCES district ID
- 5300570
- Math proficiency
- 49% ▼ -1.00%
- Reading proficiency
- 55% ▼ -2.00%
- Median HH income
- $57,085
- Composite
- 47.05/100
- National rank
- #5128
- State rank
- #120 of 291 in WA
Livability — Birch Bay
- Score
- 62/100
- State rank
- #406
- US rank
- #16180
Category grades
Schools grade is shown separately in the Schools card above.
Census & demographics
- Census place
- Birch Bay, WA
- County
- Whatcom County · 209,776 people
- Metro
- Bellingham, WA
- Population (ZIP)
- 18,744
- Household income
- $86,623
- Rent vs Own
- Severe rent burden
- 454.0
Population outlook (Whatcom County) Hauer SSP2
- Today (2025)
- 240,408 people
- By 2030
- 254,667 · +5.9%
- By 2040
- 281,365 · +17.0%
- By 2050
- 307,592 · +27.9%
- By 2075
- 375,576 · +56.2%
- By 2100
- 421,637 · +75.4%
Race, ethnicity, and origin ACS 2023
- Neighborhood character
- Predominantly White (77%)
- Race & ethnicity
- White 77% Two or more races 11% Hispanic / Latino 9% Asian 3% Pacific Islander 2% Black 1%
- Hispanic origin (detail)
- Mexican 5%
- Common ancestry
- Portuguese 6% Iranian 4% Lithuanian 3%
- Foreign-born
- 13% · Canada, China
- Languages at home
- 89% English-only · Spanish 4% Russian/Polish/Slavic 1% Other Indo-European 1%
Political lean MEDSL · Whatcom
- 2024 margin
- Strong D (+24.9) · D 60.8% · R 35.9% · Other 3.3%
- 2008→2024 swing
- +6.9pp toward D · 2008: 18.0pp · 2024: 24.9pp
- All cycles
- 2024: D+24.9 2020: D+23.9 2016: D+17.7 2012: D+12.1 2008: D+18.0
Not yet ingested
- Civics
- —
Market trends
- HPI YoY
- ▲ 106.58%
- Current HPI
- 868.68
- Rent YoY
- ▲ 3.10%
- Metro
- Bellingham, WA
- State GDP YoY
- ▲ 4.65%
- F500 in state
- 22
Industry mix (Fortune 500 HQ in WA)
| Industry | F500 HQs | Revenue |
|---|---|---|
| Retail | 2 | $269B |
|
||
| Technology / Retail | 1 | $638B |
|
||
| Technology | 1 | $245B |
|
||
| Telecommunications | 1 | $38B |
|
||
| Food / Beverage | 1 | $36B |
|
||
| Automotive / Trucks | 1 | $34B |
|
||
Price history
-9.6% since first listed6 events — show timeline
- 2026-05-15 Price Changed $329,900 NWMLS as Distributed by MLS Grid
- 2026-04-17 Price Changed $334,900 NWMLS as Distributed by MLS Grid
- 2026-03-30 Price Changed $339,000 NWMLS as Distributed by MLS Grid
- 2026-03-14 Price Changed $349,900 NWMLS as Distributed by MLS Grid
- 2026-01-29 Price Changed $360,000 NWMLS as Distributed by MLS Grid
- 2025-11-05 Listed $365,000 NWMLS as Distributed by MLS Grid
Property tax history
-14.9%/yrLatest (2026): $12 · +3.1% YoY. Source: county tax records.
Cash-flow waterfall
monthlySold comps — $/sqft
last 12 mo · ≤1 miLoading sold comps…