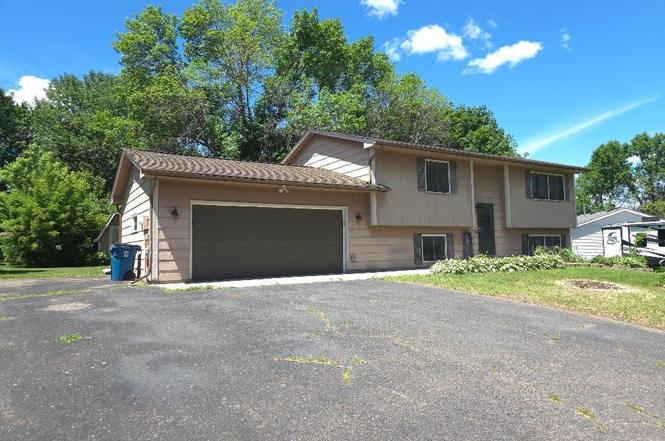
5627 Lannon Ave NE · Albertville, MN
Flood risk 1/10 · Minimal
- FEMA flood zone
- —
- Chance of flooding over 30 yrs
- 0.0%
- Est. flood insurance / yr
- —
Fire risk 1/10 · Minimal
- Est. fire insurance / yr
- $888 – $1,650
Heat risk 2/10 · Minimal
- Hot days now (above 99°F)
- 7 days/yr
- Hot days in 30 yrs
- 14 days/yr
Wind risk 2/10 · Minimal
- Chance of severe wind over 30 yrs
- —
Air-quality risk 2/10 · Minimal
- Unhealthy air days now
- 1 days/yr
- Unhealthy air days in 30 yrs
- 2 days/yr
Risk factors via First Street. Map © Google.
Why this score? — see what drove the C- grade
The composite is a weighted blend of 9 inputs, each scored 0–100. Each bar is that input's sub-score; the figure is the points it added to the 100-point composite (weight × sub-score).
- Cash flow +18.6/30.0
- ARV discount +7.5/15.0
- DSCR +5.8/10.0
- Schools +5.8/10.0
- 1% rule +4.8/10.0
- Livability +3.8/5.0
- Rent growth +2.5/5.0
- Condition / age +2.5/5.0
- Appreciation +0.0/10.0
$284,500
🖨 Deal sheet 📄 Offer letter ✓ Due diligence
Listing remarks MLS
Welcome home to this move in ready 3 bed/ 2 bath home with option for 4th bedroom. Home features new paint and carpet throughout, hardwood floors, eat in kitchen and open concept floor plan . 2 bedrooms up with full bath featuring new LVT. Informal dining walks out to large deck with a semi private back yard. Lower level features large family room and 1 additional bedroom, office and LL 3/4 bath. So much to see in this charming home, just a few blocks from main street.
Key facts
- Spacious lot
- Storage shed
- Large flat backyard
Tags
Property features AI
Finance
- Financial info: Property is listed free and clear
Exterior
- Parking: Attached garage with 2 parking spaces; Garage door opener; Asphalt driveway
- Utilities: City water connected; City sewer connected; Natural gas fuel; Electric service with circuit breakers and 100 amp service
- Home design: Residential split-entry (bi-level) home; Entry level: Main; Above-grade and below-grade finished living areas
- Construction: Block construction; Asphalt roof (over 8 years old); Block foundation
- Exterior features: Deck; Storage shed; Tree coverage - medium; City street frontage with public road maintenance
Interior
- Kitchen: Dishwasher; Range; Microwave; Refrigerator; Kitchen center island; Kitchen window; Stainless steel appliances
- Bedrooms: 3 bedrooms (main and lower levels)
- Bathrooms: One full bathroom on the main floor; One 3/4 bathroom in the basement
- Heating & cooling: Forced air heating; Central air conditioning
- Interior features: Finished full basement with walkout and sump pump; Eat-in kitchen and informal dining area; Kitchen with center island and window; Stainless steel appliances
- Laundry & utility: Laundry located on the lower level; Gas water heater
Neighborhood map
What this means for you Summary
Snapshot
- This is a 3-bed/2.0-bath single-family listed at $284k.
Deal economics
- At list price, monthly cash flow is $274 ($3k/yr) — positive.
- The deal already cash-flows at list — no discount required.
- To meet the 1% rule (rent ≥ 1% of price), the offer needs to be $278k (2.1% below list).
- Recommended offer: $278k (2.1% below list) — sets the bar for 1% rule.
- Cap rate 7.5% vs local median 4.9% in Albertville — top-decile yield for the area; either an underpriced asset or a hidden risk that comps aren't pricing in. Stress-test before assuming the spread holds.
Location & tenants
- Location reads 75/100 on livability (#206 in MN, #4,356 nationally) — a middle-class / working-renter tenant base. Strengths: employment A+, housing A+, schools A; Watch: amenities D, commute F.
- St. Michael-Albertville School District (rural): math 62% / reading 66% proficiency, ranked #17 of 301 in MN (top 6%) — acceptable for families but not a draw, mixed tenant base, ~2y average lease; only 9% free/reduced lunch — higher-income household profile.
- Market conditions: 141 active listings in the ZIP; 6 comparable units currently listed for rent nearby; rentals leasing fast (median 2d on market — plan ~1-2 weeks tenant-placement turnaround); high-income renter base; 1,260 units permitted in Wright County in 2024 (180 in 5+ unit buildings).
Forward outlook
- Local home prices are declining (-3.0%/yr); year-one equity from $2k of loan paydown is wiped out by about $9k of value loss. Plan a longer hold.
- Wright County population projected at +9% by 2050 — modest demand growth; plan on rents tracking national, not racing it.
Negotiation context
- Only 2 days on market — expect competitive offers; lowballing is unlikely to land.
- 11 sale attempts since 31y ago with the ask held roughly flat each time — persistent listings suggest the price (not the market) is what's stuck; bring a comps-based counter.
Questions for the listing agent
- Is there a deadline driving the sale (1031 exchange, divorce, estate, relocation)? That informs how much negotiation room exists.
- Schools are A-rated — typically a magnet for longer-tenancy family renters. What's the average tenant stay here, and is there a school-zone premium baked into asking?
- What's the average days-on-market for RENTAL listings here right now (not sales)? A rising rental-DOM trend means longer vacancies and softer asking-rent achievability than the comps imply.
- What's the recent tenant-quality profile in this submarket — average credit score on applications, eviction rate, late-payment / NSF rate, and stable-employment percentage? A property-management company in the area should have these aggregated.
- How much new for-sale + rental construction is in the pipeline within 1–3 miles? Heavy new supply typically softens prices + rents 12–24 months out; constrained supply supports both.
Investment metrics
- 1% rule
- 0.98% ✗
- Cap rate
- 7.45%
- Cash-on-cash
- 4.13%
- DSCR
- 1.18
- GRM
- 8.5
CMA / ARV
No comps found within radius.
Projected returns pro-forma
-3.0% appreciation · 3.0% rent growth · sell at horizon
- IRR
- -9.8%
- Equity multiple
- 0.64×
- Total profit
- $-28,611
- Equity at exit
- $42,420
- IRR
- -0.4%
- Equity multiple
- 0.97×
- Total profit
- $-2,345
- Equity at exit
- $24,598
Cash invested: $79,660 (down + closing). Projections, not guarantees.
Landlord ↔ Tenant lean methodology
- Overall (STATE)
- 46 Balanced
- State Minnesota
- 46 Balanced · D+2
- County
- — inherits STATE
- City
- — inherits STATE
ZIP-level market 55301
- Home prices YoY
- -14.2%
- Active inventory
- 141
- Price-to-rent
- 8.5×
Monthly cashflow live
- Estimated rent
- $2,785 high interval (Pro) →
- Mortgage (P&I)
- −$1,492
- Tax from tax record
- −$315 /mo · $3,780/yr
- Insurance
- −$119
- HOA
- −$0
- Vacancy / Maint / Mgmt
- −$585
- Net cashflow
- $274
Break-even live
UW: 25.0% down · 7.5% · 30yr · 1.5% tax · 5.0% vac · 8.0% maint · 8.0% mgmt
Financing live
Cash to close
- Down payment
- $71,125
- Closing costs
- $8,535
- Reserves months
- —
- Total cash needed
- —
Loan-product check · same deal, 3 products live
Conventional
25% down · 7.5% · 30yr
- Down + closing
- —
- Monthly P&I
- —
- Monthly cashflow
- —
- DSCR
- —
- Eligible?
- —
Personal DTI + credit; lowest rate.
DSCR
20% down · 8.5% · 30yr
- Down + closing
- —
- Monthly P&I
- —
- Monthly cashflow
- —
- DSCR
- —
- Eligible?
- —
No personal income docs; deal must DSCR.
Hard money
10% down · 12.0% · 12mo
- Down + closing
- —
- Monthly P&I
- —
- Monthly cashflow
- —
- DSCR
- —
- Eligible?
- —
Short-term bridge; refi at stabilization.
Rent comps 6 comps
| Address | Beds | Baths | Sqft | Rent | $/sqft | DOM | Units | Dist |
|---|---|---|---|---|---|---|---|---|
| 5518 Lachman Ave NE Albertville, MN | 2.0 | 2.0 | 1532 | $2,300 | $1.50 | 5d | 1 | 0.47mi |
| 5055 Lander Ave NE Albertville, MN | 2.0–5.0 | 2.0–3.5 | 2067 | $3,269 | $1.58 | 1d | 7 | 0.69mi |
| 10740 County Road 37 NE Albertville, MN | 2.0–3.0 | 1.0–2.0 | 988 | $1,740 | $1.76 | 1d | 6 | 1.12mi |
| 11811 Frankfort Pkwy NE Saint Michael, MN | 3.0 | 1.0–2.0 | 1017 | $2,500 | $2.46 | 1d | 13 | 1.20mi |
| 433 1st St NW Saint Michael, MN | 4.0 | 2.0 | 1830 | $2,669 | $1.46 | 3d | 1 | 1.36mi |
| 11910 Town Center Dr NE Saint Michael, MN | 3.0 | 1.0–2.0 | 877 | $2,364 | $2.69 | 1d | 10 | 1.47mi |
Listing history 3 events
-
2026-06-18days on market $284,500 Active 2 DOM
-
2026-06-17remarks 694-char remark
-
2026-06-17$284,500 Active 1 DOM
ⓘ Source: listings_history table (triggers on properties + properties_extension) + one-shot
backfill from property_details.listing_events for pre-trigger history.
Tax reassessment forecast MN · Partial reset (capped growth)
- Current annual tax
- $3,780 · $315/mo
- Projected year-2 tax
- $3,780 · $315/mo
- Expected delta
- $0/yr ($0/mo · 0.0%)
ⓘ Screening estimate from a state-policy table — verify with the county assessor before closing.
Climate risk First Street
- Flood 1/10 Low 0% chance over 30 yrs
- Wildfire 1/10 Low
- Heat 2/10 Low 7 d/yr ≥99°F today · 14 d/yr by 30 yrs out
- Wind 2/10 Low
- Air quality 2/10 Low 1 unhealthy d/yr today · 2 by 30 yrs out
Nearby sold comps map
Loading sold comps map…
Walkable amenities ~0.75 mi
Loading nearby amenities…
Taxation est. · year 1
- Rental income
- $33,415
- − Mortgage interest
- −$15,936
- − Property taxes
- −$3,780
- − Insurance
- −$1,422
- − Repairs & maintenance
- −$2,673
- − Management
- −$2,673
- − Depreciation
- −$8,276
- Taxable loss
- −$1,347
- Est. tax savings @ 24.0%
- +$323
- After-tax cash flow
- $3,615/yr
For passive investors: Depreciation is non-cash, so a rental often shows a tax loss while cash-flowing — sheltering income. Rental losses are passive: they offset passive income freely, and up to $25,000/yr can offset ordinary (W-2) income if you actively participate and your MAGI is under $100k (phasing out to $0 by $150k); unused losses carry forward. On sale, claimed depreciation is recaptured at up to 25%, and gains may owe capital-gains tax (a 1031 exchange can defer both). Figures are a year-1 estimate at your 24.0% rate — not tax advice; consult a CPA.
Schools (NCES district)
- District
- St. Michael-Albertville School District
- NCES district ID
- 2733790
- Math proficiency
- 62% ▼ -13.00%
- Reading proficiency
- 66% ▼ -10.00%
- Median HH income
- $86,897
- Composite
- 57.91/100
- National rank
- #1042
- State rank
- #17 of 301 in MN
Livability — Albertville
- Score
- 75/100
- State rank
- #206
- US rank
- #4356
Category grades
Schools grade is shown separately in the Schools card above.
Census & demographics
- Census place
- Albertville, MN
- County
- Wright County · 79,164 people
- City population
- 13,482
- Metro
- Minneapolis-St. Paul-Bloomington, MN-WI
- Population (ZIP)
- 13,482
- Household income
- $129,232
- Rent vs Own
- Severe rent burden
- 50.0
Population outlook (Wright County) Hauer SSP2
- Today (2025)
- 142,526 people
- By 2030
- 146,915 · +3.1%
- By 2040
- 153,625 · +7.8%
- By 2050
- 155,416 · +9.0%
- By 2075
- 150,352 · +5.5%
- By 2100
- 130,631 · -8.3%
Race, ethnicity, and origin ACS 2023
- Neighborhood character
- Predominantly White (85%)
- Race & ethnicity
- White 85% Black 7% Two or more races 5% Asian 2%
- Common ancestry
- Portuguese 10% Romanian 5% Lithuanian 4%
- Foreign-born
- 7% · South Korea, China, Canada
Political lean MEDSL · Wright
- 2024 margin
- Strong R (+29.4) · D 34.4% · R 63.8% · Other 1.8%
- 2008→2024 swing
- -11.9pp toward R · 2008: -17.4pp · 2024: -29.4pp
- All cycles
- 2024: R+29.4 2020: R+28.6 2016: R+33.2 2012: R+21.4 2008: R+17.4
Not yet ingested
- Civics
- —
Market trends
- HPI YoY
- ▼ -38.52%
- Current HPI
- 233.6299
- Rent YoY
- —
- Metro
- Minneapolis-St. Paul-Bloomington, MN-WI
- State GDP YoY
- ▲ 2.41%
- F500 in state
- 34
Industry mix (Fortune 500 HQ in MN)
| Industry | F500 HQs | Revenue |
|---|---|---|
| Healthcare | 2 | $407B |
|
||
| Retail | 2 | $150B |
|
||
| Consumer Goods | 2 | $32B |
|
||
| Industrial Machinery | 2 | $6B |
|
||
| Agriculture | 1 | $40B |
|
||
| Healthcare / Medical Devices | 1 | $32B |
|
||
Price history
+201.1% since first listed31 events — show timeline
- 2026-06-16 Listed $284,500 NORTHSTARMLS as Distributed by MLS Grid
- 2026-04-24 Rental Removed $2,349 Tricon
- 2026-04-17 Listed for Rent $2,349 Tricon
- 2024-06-11 Rental Removed $2,295 NORTHSTARMLS
- 2024-06-10 Rental Removed $2,295 RENT.
- 2024-05-15 Listed for Rent $2,295 NORTHSTARMLS
- 2024-05-01 Rental Removed $2,295 RENTLY
- 2024-05-01 Listed for Rent $2,295 RENT.
- 2024-04-29 Listed for Rent $2,295 RENTLY
- 2024-04-27 Rental Removed $2,295 NORTHSTARMLS
- 2024-04-23 Listed for Rent $2,295 NORTHSTARMLS
- 2023-06-23 Rental Removed — RENTLY
- 2021-09-15 Sold (Public Records) $297,000 Public Records
- 2021-09-01 Sold (MLS) $297,000 NORTHSTARMLS as Distributed by MLS Grid
- 2021-08-17 Pending — NORTHSTARMLS as Distributed by MLS Grid
- 2021-08-02 Contingent — NORTHSTARMLS as Distributed by MLS Grid
- 2021-07-29 Listed $299,900 NORTHSTARMLS as Distributed by MLS Grid
- 2002-10-02 Sold (Public Records) $159,900 Public Records
- 2002-09-25 Sold (MLS) $159,900 NORTHSTARMLS as Distributed by MLS Grid
- 2002-08-23 Listing Removed — NORTHSTARMLS as Distributed by MLS Grid
- 2002-08-15 Listed $159,900 NORTHSTARMLS as Distributed by MLS Grid
- 1999-12-06 Sold (Public Records) $125,000 Public Records
- 1999-12-06 Sold (MLS) $125,000 NORTHSTARMLS as Distributed by MLS Grid
- 1999-11-03 Listing Removed — NORTHSTARMLS as Distributed by MLS Grid
- 1999-09-16 Listed $122,900 NORTHSTARMLS as Distributed by MLS Grid
- 1998-10-09 Sold (Public Records) $85,000 Public Records
- 1996-05-24 Sold (Public Records) $80,000 Public Records
- 1996-04-30 Listing Removed — NORTHSTARMLS as Distributed by MLS Grid
- 1995-12-07 Listed $106,500 NORTHSTARMLS as Distributed by MLS Grid
- 1995-06-08 Listing Removed — NORTHSTARMLS as Distributed by MLS Grid
- 1995-03-11 Listed $94,500 NORTHSTARMLS as Distributed by MLS Grid
Property tax history
+5.3%/yrLatest (2025): $3,780 · +7.4% YoY. Source: county tax records.
Cash-flow waterfall
monthlySold comps — $/sqft
last 12 mo · ≤1 miLoading sold comps…