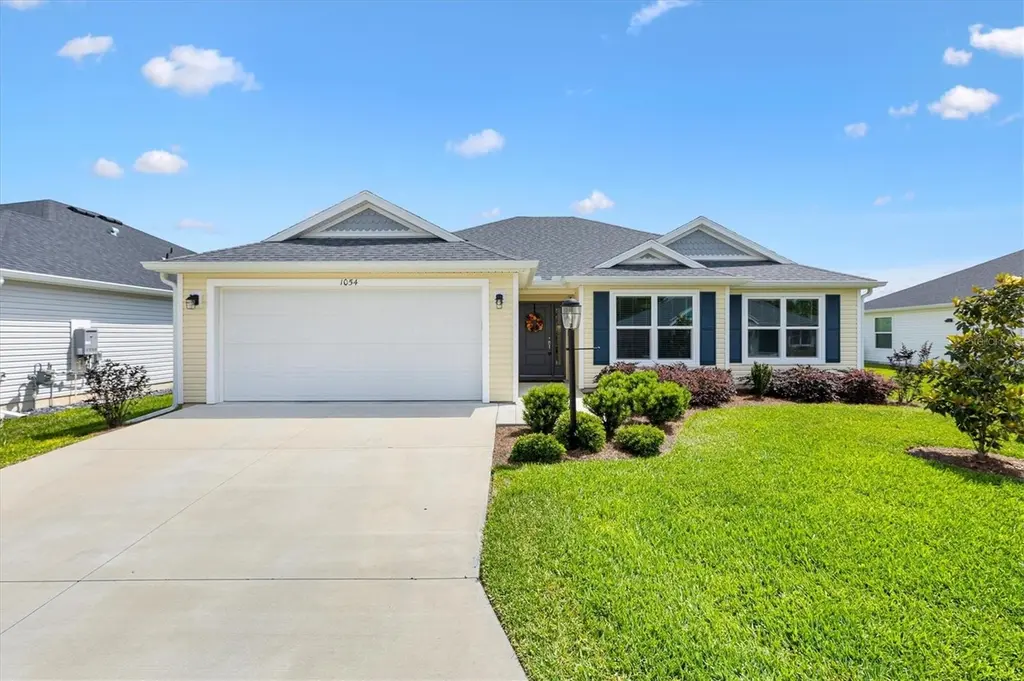
1054 Joette Pl · Leesburg, FL
Flood risk 1/10 · Minimal
- FEMA flood zone
- X (unshaded)
- Chance of flooding over 30 yrs
- 0.0%
- Est. flood insurance / yr
- $507 – $1,088
Fire risk 4/10 · Minor
- Est. fire insurance / yr
- $947 – $1,759
Heat risk 8/10 · Major
- Hot days now (above 108°F)
- 7 days/yr
- Hot days in 30 yrs
- 22 days/yr
Wind risk 9/10 · Severe
- Chance of severe wind over 30 yrs
- 99.0%
Air-quality risk 2/10 · Minimal
- Unhealthy air days now
- 1 days/yr
- Unhealthy air days in 30 yrs
- 1 days/yr
Risk factors via First Street. Map © Google.
Why this score? — see what drove the D- grade
The composite is a weighted blend of 9 inputs, each scored 0–100. Each bar is that input's sub-score; the figure is the points it added to the 100-point composite (weight × sub-score).
- ARV discount +7.5/15.0
- Cash flow +7.2/30.0
- Appreciation +7.0/10.0
- Schools +4.2/10.0
- Livability +3.1/5.0
- 1% rule +2.9/10.0
- Rent growth +2.5/5.0
- Condition / age +2.5/5.0
- DSCR +1.4/10.0
$375,000
🖨 Deal sheet (PDF) 📄 Offer letter ✓ Due diligence
Listing remarks
Under contract-accepting backup offers. I’m not just a house, I’m the one you’ve been waiting for. 3/2 * * WHISPER PINE FLOORPLAN * * with * * OPEN FLOOR PLAN * * and * * HIGH CEILINGS * * creating a bright, spacious feel. Features * * LVP FLOORING THROUGHOUT * * with * * CARPET IN THE BEDROOMS * * for comfort, plus convenient * * INTERIOR LAUNDRY * * . Step out to a * * LARGE LANAI FOR OUTDOOR LIVING * * , perfect for relaxing or entertaining. Welcome to * * THE VILLAGE OF LAKE DENHAM * * , where I sit on an * * OVERSIZED HOMESITE * * and show off light-filled living spaces designed for everyday ease. My kitchen is the heart of the home wi
Key facts
- Open floor plan
- Interior laundry
- High ceilings
Tags
Property features AI
Finance
- Other: Public maintained paved road access; Directions: Meggison Road to Chandler Drive, left onto Joette
- HOA & community: Community features: Deed restrictions, dog park, golf, playground, pool, street lights; Senior community; Pets allowed with number limit; CDD present; Homestead present
Exterior
- Parking: Attached garage; 2 garage spaces
- Utilities: Public water; Public sewer; Electricity connected; Natural gas connected; Sewer connected; Water connected; Underground utilities; Sprinkler recycled
- Home design: Single family residence; One level; Faces east; Residential property
- Construction: Vinyl siding and frame construction; Shingle roof; Slab foundation; Builder model: Whispering Pine; Built on a 0.14-acre lot
- Exterior features: Porch; Rear screened porch; Rain gutters; Irrigation equipment
Interior
- Kitchen: Dishwasher; Disposal; Ice maker; Microwave; Refrigerator; Tankless water heater
- Bedrooms: 3 bedrooms
- Flooring: Carpet
- Bathrooms: 2 full bathrooms
- Heating & cooling: Central heating; Central air
- Interior features: High ceilings; Open floorplan; Split bedroom design; Walk-in closet(s); Window treatments
- Laundry & utility: Laundry room inside; Dryer
Neighborhood map
What this means for you Summary
Snapshot
- This is a 3-bed/2.0-bath single-family listed at $375k.
Deal economics
- At list price, monthly cash flow is $-516 ($-6k/yr) — negative.
- To cash-flow at today's rent, offer at most $284k (24.3% below list).
- To meet the 1% rule (rent ≥ 1% of price), the offer needs to be $295k (21.2% below list).
- Recommended offer: $284k (24.3% below list) — sets the bar for cash-flow.
Location & tenants
- Location reads 62/100 on livability (#751 in FL) — a middle-class / working-renter tenant base. Strengths: cost of living A+, housing A+; Watch: schools D+, crime D, amenities F.
- Lake (suburban): math 49% / reading 50% proficiency, ranked #37 of 73 in FL (top 51%) — families likely to look elsewhere, expect single-tenant / working-renter base with shorter leases.
- Market conditions: 101 active listings in the ZIP; 4 comparable units currently listed for rent nearby; rentals at typical pace (median 25d on market — plan ~3-4 weeks tenant-placement turnaround); 4,799 units permitted in Lake County in 2024 (814 in 5+ unit buildings).
Forward outlook
- In year one you build about $17k of equity ($3k loan paydown + $15k appreciation (3.9% local appreciation)).
- Lake County population projected at +37% by 2050 — long-run rental-demand tailwind backs the buy-and-hold thesis.
- By year 3, paydown + projected appreciation supports a ~$43k cash-out refi (75% LTV) — recoverable capital for the next deal without selling this one.
Negotiation context
- It's been on market 38 days — a 3% lower offer ($364k) is reasonable based on typical stale-listing flexibility.
Risks & watch-outs
- Climate carrying-cost: severe wind risk, 99% chance of damaging wind over 30y; extreme-heat days projected 7→22/yr by 2055 (HVAC capex compounding) — expect insurance premiums to compound above CPI over the hold.
Questions for the listing agent
- What do current leases actually rent for vs. the listed asking? Can we see a recent rent roll and the last 12 months of T-12 income?
- It's been on market 38 days. Have you received any prior offers? Is the seller open to a 24% concession, seller financing, or rate buy-down credit?
- Is there a deadline driving the sale (1031 exchange, divorce, estate, relocation)? That informs how much negotiation room exists.
- Schools are D-rated, which usually means shorter tenancies and higher turnover. Who's the typical renter profile here, and what's been the actual vacancy rate?
- Crime grade is D in this area — have there been break-ins, vandalism, or insurance claims at this property in the last 3 years? What carrier currently insures it and at what premium?
- The area grade is low — what's the realistic commute time and amenity access for the typical tenant pool here? Any planned neighborhood developments (good or bad) we should know about?
- What's the average days-on-market for RENTAL listings here right now (not sales)? A rising rental-DOM trend means longer vacancies and softer asking-rent achievability than the comps imply.
- What's the recent tenant-quality profile in this submarket — average credit score on applications, eviction rate, late-payment / NSF rate, and stable-employment percentage? A property-management company in the area should have these aggregated.
- How much new for-sale + rental construction is in the pipeline within 1–3 miles? Heavy new supply typically softens prices + rents 12–24 months out; constrained supply supports both.
Investment metrics
- 1% rule
- 0.79% ✗
- Cap rate
- 4.64%
- Cash-on-cash
- -5.90%
- DSCR
- 0.74
- GRM
- 10.6
CMA / ARV
No comps found within radius.
Projected returns pro-forma
3.92% appreciation · 3.0% rent growth · sell at horizon
- IRR
- 4.9%
- Equity multiple
- 1.29×
- Total profit
- $30,971
- Equity at exit
- $188,278
- IRR
- 7.7%
- Equity multiple
- 2.28×
- Total profit
- $134,710
- Equity at exit
- $306,476
Cash invested: $105,000 (down + closing). Projections, not guarantees.
Landlord ↔ Tenant lean methodology
- Overall (STATE)
- 87 Strongly Landlord-Friendly
- State Florida
- 87 Strongly Landlord-Friendly · R+3
- County
- — inherits STATE
- City
- — inherits STATE
ZIP-level market 34762
- Home prices YoY
- 1.1%
- Active inventory
- 101
- Price-to-rent
- 10.6×
Monthly cashflow live
- Estimated rent
- $2,954 medium interval (Pro) →
- Mortgage (P&I)
- −$1,967
- Tax from tax record
- −$727 /mo · $8,728/yr
- Insurance
- −$156
- HOA
- −$0
- Vacancy / Maint / Mgmt
- −$620
- Net cashflow
- $-516
Break-even live
Sensitivity live
| Price | -10% $-304 | -5% $-410 | +0% $-516 | +5% $-623 | +10% $-729 |
|---|---|---|---|---|---|
| Rent | -10% $-750 | -5% $-633 | +0% $-516 | +5% $-400 | +10% $-283 |
| Rate | -1.0pp $-328 | -0.5pp $-421 | base $-516 | +0.5pp $-614 | +1.0pp $-712 |
UW: 25.0% down · 7.5% · 30yr · 1.5% tax · 5.0% vac · 8.0% maint · 8.0% mgmt
Financing live
Cash to close
- Down payment
- $93,750
- Closing costs
- $11,250
- Reserves months
- —
- Total cash needed
- —
Loan-product check · same deal, 3 products live
Conventional
25% down · 7.5% · 30yr
- Down + closing
- —
- Monthly P&I
- —
- Monthly cashflow
- —
- DSCR
- —
- Eligible?
- —
Personal DTI + credit; lowest rate.
DSCR
20% down · 8.5% · 30yr
- Down + closing
- —
- Monthly P&I
- —
- Monthly cashflow
- —
- DSCR
- —
- Eligible?
- —
No personal income docs; deal must DSCR.
Hard money
10% down · 12.0% · 12mo
- Down + closing
- —
- Monthly P&I
- —
- Monthly cashflow
- —
- DSCR
- —
- Eligible?
- —
Short-term bridge; refi at stabilization.
Rent comps 4 comps
| Address | Beds | Baths | Sqft | Rent | $/sqft | DOM | Units | Dist |
|---|---|---|---|---|---|---|---|---|
| 1393 Daniel Way The Villages, FL | 3.0 | 2.0 | 1966 | $4,000 | $2.03 | 25d | 1 | 0.57mi |
| 7548 Kuenher Ct The Villages, FL | 3.0 | 2.0 | 1440 | $2,400 | $1.67 | 25d | 1 | 0.78mi |
| 7181 Fay Ct The Villages, FL | 2.0 | 2.0 | 1175 | $4,800 | $4.09 | 25d | 1 | 0.81mi |
| 7185 Denver Ave The Villages, FL | 3.0 | 2.0 | 1440 | $1,950 | $1.35 | 25d | 1 | 0.86mi |
Listing history 9 events
-
2026-06-09status $375,000 Pending 38 DOM
-
2026-06-08days on market $375,000 Active 38 DOM
-
2026-06-07days on market $375,000 Active 37 DOM
-
2026-06-04days on market $375,000 Active 34 DOM
-
2026-06-03days on market $375,000 Active 33 DOM
-
2026-06-02days on market $375,000 Active 32 DOM
-
2026-06-01days on market $375,000 Active 31 DOM
-
2026-05-31days on market $375,000 Active 30 DOM
-
2026-05-01$375,000 Active
ⓘ Source: listings_history table (triggers on properties + properties_extension) + one-shot
backfill from property_details.listing_events for pre-trigger history.
Tax reassessment forecast FL · Resets to sale price
- Current annual tax
- $8,728 · $727/mo
- Projected year-2 tax
- $8,728 · $727/mo
- Expected delta
- $0/yr ($0/mo · 0.0%)
ⓘ Screening estimate from a state-policy table — verify with the county assessor before closing.
Climate risk First Street
- Flood 1/10 Low FEMA zone X (unshaded) · 0% chance over 30 yrs
- Wildfire 4/10 Moderate
- Heat 8/10 Severe 7 d/yr ≥108°F today · 22 d/yr by 30 yrs out
- Wind 9/10 Extreme 99% chance of damaging wind over 30 yrs
- Air quality 2/10 Low 1 unhealthy d/yr today · 1 by 30 yrs out
Nearby sold comps map
Loading sold comps map…
Walkable amenities ~0.75 mi
Loading nearby amenities…
Taxation est. · year 1
- Rental income
- $35,448
- − Mortgage interest
- −$21,006
- − Property taxes
- −$8,728
- − Insurance
- −$1,875
- − Repairs & maintenance
- −$2,836
- − Management
- −$2,836
- − Depreciation
- −$10,909
- Taxable loss
- −$12,741
- Est. tax savings @ 24.0%
- +$3,058
- After-tax cash flow
- $-3,139/yr
For passive investors: Depreciation is non-cash, so a rental often shows a tax loss while cash-flowing — sheltering income. Rental losses are passive: they offset passive income freely, and up to $25,000/yr can offset ordinary (W-2) income if you actively participate and your MAGI is under $100k (phasing out to $0 by $150k); unused losses carry forward. On sale, claimed depreciation is recaptured at up to 25%, and gains may owe capital-gains tax (a 1031 exchange can defer both). Figures are a year-1 estimate at your 24.0% rate — not tax advice; consult a CPA.
Schools (NCES district)
- District
- Lake
- NCES district ID
- 1201050
- Math proficiency
- 49% ▼ -7.00%
- Reading proficiency
- 50% ▼ -4.00%
- Median HH income
- $46,632
- Composite
- 42.05/100
- National rank
- #3327
- State rank
- #37 of 73 in FL
Livability — Leesburg
- Score
- 62/100
- State rank
- #751
- US rank
- #16429
Category grades
Schools grade is shown separately in the Schools card above.
Census & demographics
- Census place
- Leesburg, FL
- City population
- 70,232
- Population (ZIP)
- 580
Population outlook (Lake County) Hauer SSP2
- Today (2025)
- 386,640 people
- By 2030
- 417,107 · +7.9%
- By 2040
- 476,676 · +23.3%
- By 2050
- 531,296 · +37.4%
- By 2075
- 648,303 · +67.7%
- By 2100
- 698,530 · +80.7%
Race, ethnicity, and origin ACS 2023
- Neighborhood character
- Predominantly White (68%)
- Race & ethnicity
- White 68% Hispanic / Latino 20% Two or more races 16% Black 12%
- Hispanic origin (detail)
- Cuban 13%
- Foreign-born
- 13% · Canada
- Languages at home
- 82% English-only · Spanish 18%
Political lean MEDSL · Lake
- 2024 margin
- Strong R (+24.7) · D 37.3% · R 62.0%
- 2008→2024 swing
- -11.2pp toward R · 2008: -13.5pp · 2024: -24.7pp
- All cycles
- 2024: R+24.7 2020: R+20.0 2016: R+23.1 2012: R+17.1 2008: R+13.5
Not yet ingested
- Civics
- —
Market trends
- HPI YoY
- ▲ 3.92%
- Current HPI
- 365.7475
- Rent YoY
- —
- Metro
- —
- State GDP YoY
- ▲ 3.28%
- F500 in state
- 36
Industry mix (Fortune 500 HQ in FL)
| Industry | F500 HQs | Revenue |
|---|---|---|
| Industrial Technology | 2 | $29B |
|
||
| Insurance | 2 | $17B |
|
||
| Retail | 1 | $60B |
|
||
| Technology Distribution | 1 | $58B |
|
||
| Homebuilding | 1 | $35B |
|
||
| Technology Manufacturing | 1 | $35B |
|
||
Price history
1 event — show timeline
- 2026-05-01 Listed $375,000 Stellar MLS as Distributed by MLS Grid
Property tax history
+32.6%/yrLatest (2025): $8,728 · +2.5% YoY. Source: county tax records.
Cash-flow waterfall
monthlySold comps — $/sqft
last 12 mo · ≤1 miLoading sold comps…