3212 E Henrietta Rd · Brighton, NY
Flood risk 1/10 · Minimal
- FEMA flood zone
- X (unshaded)
- Chance of flooding over 30 yrs
- 0.0%
- Est. flood insurance / yr
- $473 – $860
Fire risk 1/10 · Minimal
- Est. fire insurance / yr
- $691 – $1,283
Heat risk 2/10 · Minimal
- Hot days now (above 94°F)
- 7 days/yr
- Hot days in 30 yrs
- 15 days/yr
Wind risk 1/10 · Minimal
- Chance of severe wind over 30 yrs
- —
Air-quality risk 2/10 · Minimal
- Unhealthy air days now
- 1 days/yr
- Unhealthy air days in 30 yrs
- 1 days/yr
Risk factors via First Street. Map © Google.
Why this score? — see what drove the B grade
The composite is a weighted blend of 9 inputs, each scored 0–100. Each bar is that input's sub-score; the figure is the points it added to the 100-point composite (weight × sub-score).
- Cash flow +30.0/30.0
- 1% rule +10.0/10.0
- DSCR +10.0/10.0
- ARV discount +7.5/15.0
- Schools +5.2/10.0
- Livability +4.0/5.0
- Rent growth +2.8/5.0
- Condition / age +2.5/5.0
- Appreciation +0.0/10.0
$125,000
🖨 Deal sheet 📄 Offer letter ✓ Due diligence
Listing remarks
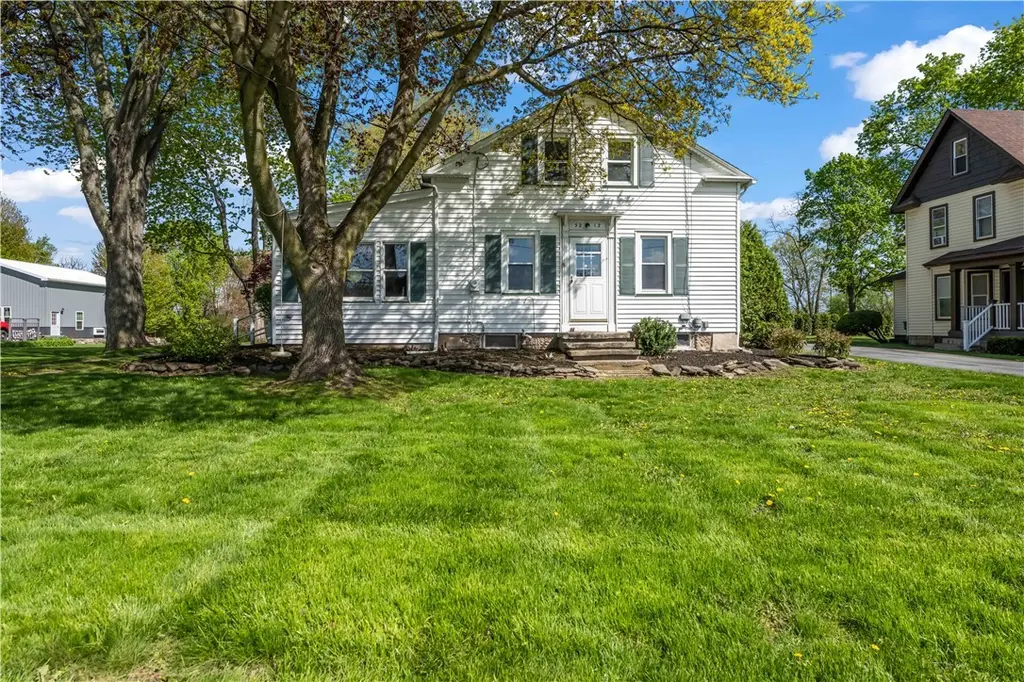
Welcome to this 3-bedroom, 1-bath home full of opportunity and potential! Situated on a generously sized lot, this property offers plenty of outdoor space for entertaining, gardening, pets, or future improvements. Inside, you'll find a functional layout with spacious living areas and plenty of natural light throughout. This home presents an excellent chance for investors, renovators, or buyers looking to build equity and customize a home to their own style and needs. The large backyard provides endless possibilities, whether you envision creating an outdoor oasis, adding a garage or workshop, or simply enjoying extra room to spread out. Conveniently located near local schools, parks, shoppi
Key facts
- Generously sized lot
- Large backyard
- Outdoor space
Tags
Property features AI
Exterior
- Parking: No garage
- Utilities: Electricity connected; Public water connected; Sewer connected; Cable available
- Home design: Single-story; Resale property
- Construction: Vinyl siding; Architectural shingle roof; Stone foundation; Blown-in insulation; Existing construction
- Exterior features: Blacktop driveway; See remarks
Interior
- Kitchen: Eat-in kitchen; Solid surface counters
- Bedrooms: 1 main-level bedroom
- Flooring: Carpet; Hardwood; Vinyl; Varies
- Bathrooms: 1 full bathroom (main level)
- Heating & cooling: Gas heating; Baseboard heating; Forced air
- Interior features: Entrance foyer; Eat-in kitchen; Separate/formal living room; Solid surface counters
- Laundry & utility: Main-level laundry; Electric water heater
Neighborhood map
What this means for you Summary
Snapshot
- This is a 3-bed/1.0-bath single-family listed at $125k.
Deal economics
- At list price, monthly cash flow is $625 ($7k/yr) — positive.
- The deal already cash-flows at list — no discount required.
- Meets the 1% rule at list price ($2k rent vs $125k).
- Cap rate 12.3% vs local median 3.9% in Brighton — top-decile yield for the area; either an underpriced asset or a hidden risk that comps aren't pricing in. Stress-test before assuming the spread holds.
Location & tenants
- Location reads 81/100 on livability (#89 in NY, #1,379 nationally) — a professional / high-income tenant draw. Strengths: housing A+, health & safety A+, schools B+; Watch: crime D+, amenities D-.
- Rush-Henrietta Central School District (suburban): math 62% / reading 57% proficiency, ranked #237 of 590 in NY (top 40%) — acceptable for families but not a draw, mixed tenant base, ~2y average lease.
- Market conditions: Rents rising (+1.3%/yr); 39 active listings in the ZIP; 4 comparable units currently listed for rent nearby; rentals at typical pace (median 21d on market — plan ~3-4 weeks tenant-placement turnaround); solid renter incomes; 1,169 units permitted in Monroe County in 2024 (591 in 5+ unit buildings).
Forward outlook
- Local home prices are declining (-3.0%/yr); year-one equity from $864 of loan paydown is wiped out by about $4k of value loss. Plan a longer hold.
- Monroe County population projected to shrink 6% by 2050 — rents likely to lag national; underwrite the cash flow, not the appreciation.
- At projected returns (-3.0% appreciation + 1.3% rent growth), your $35k cash investment doubles in ~7 years — after that, you're playing with house money.
Negotiation context
- Only 7 days on market — expect competitive offers; lowballing is unlikely to land.
- Current owner paid $93k; 34% above their basis — modest negotiation headroom, anchor on the comps not their cost.
Risks & watch-outs
- Watch-outs: property tax is 3.9% of price; built in 1830 — expect roof / HVAC / electrical / plumbing capex.
Questions for the listing agent
- Built in 1830 — when were the roof, HVAC, electrical panel, plumbing, and water heater last replaced?
- Property tax is high relative to price — has the assessment been appealed recently, and will the sale trigger a re-assessment?
- Is there a deadline driving the sale (1031 exchange, divorce, estate, relocation)? That informs how much negotiation room exists.
- Schools are B-rated — typically a magnet for longer-tenancy family renters. What's the average tenant stay here, and is there a school-zone premium baked into asking?
- Crime grade is D in this area — have there been break-ins, vandalism, or insurance claims at this property in the last 3 years? What carrier currently insures it and at what premium?
- What's the average days-on-market for RENTAL listings here right now (not sales)? A rising rental-DOM trend means longer vacancies and softer asking-rent achievability than the comps imply.
- What's the recent tenant-quality profile in this submarket — average credit score on applications, eviction rate, late-payment / NSF rate, and stable-employment percentage? A property-management company in the area should have these aggregated.
- How much new for-sale + rental construction is in the pipeline within 1–3 miles? Heavy new supply typically softens prices + rents 12–24 months out; constrained supply supports both.
Investment metrics
- 1% rule
- 1.76% ✓
- Cap rate
- 12.29%
- Cash-on-cash
- 21.42%
- DSCR
- 1.95
- GRM
- 4.7
CMA / ARV
- ARV (median comp)
- $344,508
- List price
- $125,000
- Delta
- -63.72%
- Verdict
- UNDERPRICED
- Comps
- 20 within 1.0 mi
Show comp detail 12 sales within ~0.75 mi
| Address | Dist | Beds/Ba | Sqft | Sold | Price | $/sf | Match |
|---|---|---|---|---|---|---|---|
| 9 Finnegan Way | 0.25mi | 3/1.5 | 1,760 (-1%) | 12mo | $250,000 | $142 | 74 |
| 1463 Lehigh Station Rd | 0.44mi | 3/2.0 | 1,756 (-2%) | 9mo | $260,000 | $148 | 65 |
| 75 Willowford Dr | 0.46mi | 3/3.0 | 1,724 (-3%) | 8mo | $460,000 | $267 | 58 |
| 55 Agar Ave | 0.67mi | 3/1.0 | 1,728 (-3%) | 7mo | $215,000 | $124 | 58 |
| 118 Clooney Dr | 0.33mi | 4/2.5 (+1) | 1,968 (+10%) | 2mo | $320,000 | $163 | 55 |
| 109 Valiant Dr | 0.58mi | 4/3.0 (+1) | 1,768 (-1%) | 10mo | $342,500 | $194 | 50 |
| 26 Bemis | 0.68mi | 3/1.5 | 1,672 (-6%) | 8mo | $257,500 | $154 | 49 |
| 11 Authors Ave | 0.56mi | 4/2.0 (+1) | 1,669 (-6%) | 10mo | $335,000 | $201 | 46 |
| 78 Stoddard Dr | 0.74mi | 4/1.5 (+1) | 1,730 (-3%) | 10mo | $290,000 | $168 | 45 |
| 18 Hanson Cir | 0.61mi | 3/1.5 | 1,540 (-14%) | 9mo | $333,000 | $216 | 40 |
| 207 Valiant Dr | 0.68mi | 3/1.5 | 1,536 (-14%) | 5mo | $280,000 | $182 | 39 |
| 230 Mystic Lane Ln | 0.69mi | 4/2.0 (+1) | 1,971 (+10%) | 5mo | $350,000 | $178 | 37 |
Match score weights: distance 35% · size 25% · config 20% · recency 20%. Top-matched comps best support the ARV.
Projected returns pro-forma
-3.0% appreciation · 1.28% rent growth · sell at horizon
- IRR
- 11.8%
- Equity multiple
- 1.46×
- Total profit
- $15,987
- Equity at exit
- $18,638
- IRR
- 19.2%
- Equity multiple
- 2.46×
- Total profit
- $51,093
- Equity at exit
- $10,808
Cash invested: $35,000 (down + closing). Projections, not guarantees.
Landlord ↔ Tenant lean methodology
- Overall (STATE)
- 15 Strongly Tenant-Friendly
- State New York
- 15 Strongly Tenant-Friendly · D+10
- County
- — inherits STATE
- City
- — inherits STATE
ZIP-level market 14467
- Home prices YoY
- -13.8%
- Rents YoY
- 1.3%
- Active inventory
- 39
- Price-to-rent
- 4.7×
Monthly cashflow live
- Estimated rent
- $2,198 medium interval (Pro) →
- Mortgage (P&I)
- −$656
- Tax from tax record
- −$404 /mo · $4,851/yr
- Insurance
- −$52
- HOA
- −$0
- Vacancy / Maint / Mgmt
- −$462
- Net cashflow
- $625
Break-even live
UW: 25.0% down · 7.5% · 30yr · 1.5% tax · 5.0% vac · 8.0% maint · 8.0% mgmt
Financing live
Cash to close
- Down payment
- $31,250
- Closing costs
- $3,750
- Reserves months
- —
- Total cash needed
- —
Loan-product check · same deal, 3 products live
Conventional
25% down · 7.5% · 30yr
- Down + closing
- —
- Monthly P&I
- —
- Monthly cashflow
- —
- DSCR
- —
- Eligible?
- —
Personal DTI + credit; lowest rate.
DSCR
20% down · 8.5% · 30yr
- Down + closing
- —
- Monthly P&I
- —
- Monthly cashflow
- —
- DSCR
- —
- Eligible?
- —
No personal income docs; deal must DSCR.
Hard money
10% down · 12.0% · 12mo
- Down + closing
- —
- Monthly P&I
- —
- Monthly cashflow
- —
- DSCR
- —
- Eligible?
- —
Short-term bridge; refi at stabilization.
Rent comps 4 comps
| Address | Beds | Baths | Sqft | Rent | $/sqft | DOM | Units | Dist |
|---|---|---|---|---|---|---|---|---|
| 55 Agar Ave Henrietta, NY | 3.0 | 1.0 | 1728 | $2,350 | $1.36 | 11d | 1 | 0.68mi |
| 142 Prentiss Way Unit 1 Henrietta, NY | 3.0 | 1.0 | 1368 | $2,000 | $1.46 | 11d | 1 | 0.86mi |
| 47 Crimson Bramble Rd Rochester, NY | 3.0 | 1.5 | 1616 | $2,600 | $1.61 | 21d | 1 | 1.32mi |
| 0 Traditions Pl Henrietta, NY | 2.0 | 2.0 | 2000 | $2,700 | $1.35 | 43d | 1 | 1.38mi |
Listing history 2 events
-
2026-05-13$125,000 Active 930-char remark
-
2020-11-16soldstatus $93,000
ⓘ Source: listings_history table (triggers on properties + properties_extension) + one-shot
backfill from property_details.listing_events for pre-trigger history.
Tax reassessment forecast NY · Partial reset (capped growth)
- Current annual tax
- $4,851 · $404/mo
- Projected year-2 tax
- $4,851 · $404/mo
- Expected delta
- $0/yr ($0/mo · 0.0%)
ⓘ Screening estimate from a state-policy table — verify with the county assessor before closing.
Climate risk First Street
- Flood 1/10 Low FEMA zone X (unshaded) · 0% chance over 30 yrs
- Wildfire 1/10 Low
- Heat 2/10 Low 7 d/yr ≥94°F today · 15 d/yr by 30 yrs out
- Wind 1/10 Low
- Air quality 2/10 Low 1 unhealthy d/yr today · 1 by 30 yrs out
Nearby sold comps map
Loading sold comps map…
Walkable amenities ~0.75 mi
Loading nearby amenities…
Taxation est. · year 1
- Rental income
- $26,380
- − Mortgage interest
- −$7,002
- − Property taxes
- −$4,851
- − Insurance
- −$625
- − Repairs & maintenance
- −$2,110
- − Management
- −$2,110
- − Depreciation
- −$3,636
- Taxable income
- $6,045
- Est. tax owed @ 24.0%
- −$1,451
- After-tax cash flow
- $6,047/yr
For passive investors: Depreciation is non-cash, so a rental often shows a tax loss while cash-flowing — sheltering income. Rental losses are passive: they offset passive income freely, and up to $25,000/yr can offset ordinary (W-2) income if you actively participate and your MAGI is under $100k (phasing out to $0 by $150k); unused losses carry forward. On sale, claimed depreciation is recaptured at up to 25%, and gains may owe capital-gains tax (a 1031 exchange can defer both). Figures are a year-1 estimate at your 24.0% rate — not tax advice; consult a CPA.
Schools (NCES district)
- District
- Rush-Henrietta Central School District
- NCES district ID
- 3625170
- Math proficiency
- 62% ▼ -6.00%
- Reading proficiency
- 57% ▲ 1.00%
- Median HH income
- $58,682
- Composite
- 51.52/100
- National rank
- #1720
- State rank
- #237 of 590 in NY
Livability — Brighton
- Score
- 81/100
- State rank
- #89
- US rank
- #1379
Category grades
Schools grade is shown separately in the Schools card above.
Census & demographics
- County
- Monroe County · 674,131 people
- City population
- 38,703
- Metro
- Rochester, NY
- Population (ZIP)
- 10,168
- Household income
- $88,653
- Rent vs Own
- Severe rent burden
- 265.0
Population outlook (Monroe County) Hauer SSP2
- Today (2025)
- 759,460 people
- By 2030
- 757,154 · -0.3%
- By 2040
- 740,644 · -2.5%
- By 2050
- 714,443 · -5.9%
- By 2075
- 645,883 · -15.0%
- By 2100
- 547,084 · -28.0%
Race, ethnicity, and origin ACS 2023
- Neighborhood character
- Predominantly White (77%)
- Race & ethnicity
- White 77% Asian 9% Black 6% Hispanic / Latino 5% Two or more races 4%
- Hispanic origin (detail)
- Puerto Rican 4%
- Common ancestry
- Romanian 7% Lithuanian 2% Slovak 2%
- Foreign-born
- 11% · China, Canada, Vietnam
- Languages at home
- 90% English-only · Other Indo-European 2% Arabic 2% Chinese 1%
Political lean MEDSL · Monroe
- 2024 margin
- D (+19.1) · D 59.5% · R 40.5%
- 2008→2024 swing
- +1.4pp toward D · 2008: 17.7pp · 2024: 19.1pp
- All cycles
- 2024: D+19.1 2020: D+21.0 2016: D+14.1 2012: D+17.4 2008: D+17.7
Not yet ingested
- Civics
- —
Market trends
- HPI YoY
- ▼ -44.47%
- Current HPI
- 276.5057
- Rent YoY
- ▲ 1.28%
- Metro
- Rochester, NY
- State GDP YoY
- ▲ 2.60%
- F500 in state
- 92
Industry mix (Fortune 500 HQ in NY)
| Industry | F500 HQs | Revenue |
|---|---|---|
| Financial Services | 10 | $950B |
|
||
| Consumer Goods | 9 | $162B |
|
||
| Insurance | 4 | $225B |
|
||
| Telecommunications | 2 | $144B |
|
||
| Pharmaceuticals | 2 | $112B |
|
||
| Media / Entertainment | 2 | $69B |
|
||
Price history
+34.4% since first listed3 events — show timeline
- 2026-05-20 Pending — UNYREIS
- 2026-05-13 Listed $125,000 UNYREIS
- 2020-11-16 Sold (Public Records) $93,000 Public Records
Property tax history
+5.5%/yrLatest (2025): $4,851 · -0.5% YoY. Source: county tax records.
Cash-flow waterfall
monthlySold comps — $/sqft
last 12 mo · ≤1 miLoading sold comps…