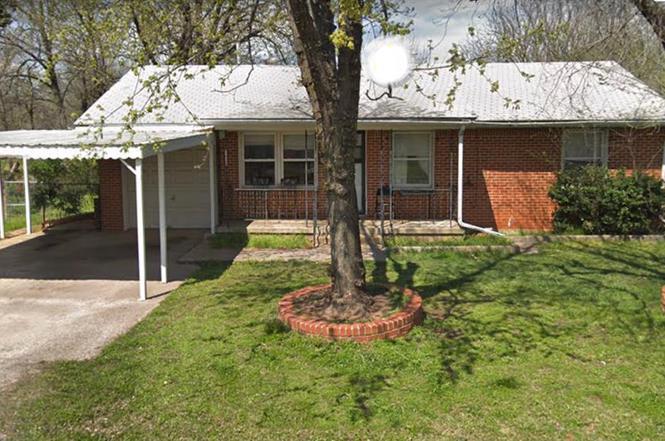
4113 SE 43rd St · Del City, OK
Flood risk 1/10 · Minimal
- FEMA flood zone
- X (unshaded)
- Chance of flooding over 30 yrs
- 0.0%
- Est. flood insurance / yr
- $507 – $1,088
Fire risk 1/10 · Minimal
- Est. fire insurance / yr
- $2,463 – $4,575
Heat risk 5/10 · Moderate
- Hot days now (above 107°F)
- 7 days/yr
- Hot days in 30 yrs
- 19 days/yr
Wind risk 2/10 · Minimal
- Chance of severe wind over 30 yrs
- 4.0%
Air-quality risk 2/10 · Minimal
- Unhealthy air days now
- 1 days/yr
- Unhealthy air days in 30 yrs
- 3 days/yr
Risk factors via First Street. Map © Google.
Why this score? — see what drove the D+ grade
The composite is a weighted blend of 9 inputs, each scored 0–100. Each bar is that input's sub-score; the figure is the points it added to the 100-point composite (weight × sub-score).
- Cash flow +21.6/30.0
- DSCR +6.9/10.0
- ARV discount +5.0/15.0
- 1% rule +4.7/10.0
- Livability +3.2/5.0
- Rent growth +2.8/5.0
- Condition / age +2.5/5.0
- Schools +1.2/10.0
- Appreciation +0.0/10.0
$125,000
🖨 Deal sheet (PDF) 📄 Offer letter ✓ Due diligence
Listing remarks
Significant recent improvements make this home move-in ready and easy to love. Updates include a brand new roof, foundation repairs and reinforcement, fresh interior paint, new vinyl flooring throughout, a fully renovated bathroom, and refreshed kitchen cabinetry with modern touches. This beautifully updated home offers both comfort and peace of mind. Conveniently located near Tinker AFB, shopping, dining, and quick access to I-40, it’s perfectly positioned for everyday living and commuting. Don’t miss your chance to own a thoughtfully updated home in a prime location. If you want, I can give you a second version that leans more investor-focused or one that hits emotional storyt
Key facts
- Attached garage
- Covered carport
- Ample cabinet space
Tags
Property features AI
Finance
- Other: Leased previously; currently vacant; Living area listed from assessor
- Financial info: Loan qualifying: Yes
- HOA & community: No mandatory association dues
Exterior
- Parking: Concrete parking; 1-car garage
- Utilities: No flood insurance indicated
- Home design: Single family residence; One-level property; Existing property
- Construction: Frame and masonry veneer construction; Composition roof; Slab foundation; Built previously (existing)
- Exterior features: Covered porch; Front porch; Outbuildings; Rain gutters; Interior lot
Interior
- Bedrooms: Three bedrooms
- Bathrooms: One full bathroom
- Heating & cooling: Central gas cooling
- Interior features: Five living areas; Dining area; No fireplace
Neighborhood map
What this means for you Summary
Snapshot
- This is a 3-bed/1.0-bath single-family listed at $125k.
Deal economics
- At list price, monthly cash flow is $190 ($2k/yr) — positive.
- The deal already cash-flows at list — no discount required.
- To meet the 1% rule (rent ≥ 1% of price), the offer needs to be $122k (2.7% below list).
- Recommended offer: $121k (3.0% below list) — sets the bar for market timing.
- Cap rate 8.1% vs local median 5.9% in Del City — top-decile yield for the area; either an underpriced asset or a hidden risk that comps aren't pricing in. Stress-test before assuming the spread holds.
Location & tenants
- Location reads 64/100 on livability (#180 in OK) — a middle-class / working-renter tenant base. Strengths: cost of living A+, housing A+; Watch: health & safety C-, amenities D, crime F.
- Midwest City-Del City (suburban): math 10% / reading 17% proficiency, ranked #231 of 270 in OK (top 86%) — low school quality limits family demand, transient renter base, plan for 1-2y turnover.
- Zoned schools: Townsend Es (math 8% / reading 17%, grade F, #652 of 845 statewide, top 79%, 459 students, 0% FRL); Del City Hs (math 5% / reading 15%, grade F, #361 of 447 statewide, top 94%, 1,158 students, 0% FRL) — zoned schools average 0% FRL vs 57% district-wide (57 pts lower); this property's tenant base skews higher-income than the district average.
- Market conditions: Rents rising (+1.3%/yr); 121 active listings in the ZIP; 40 comparable units currently listed for rent nearby; rentals at typical pace (median 23d on market — plan ~3-4 weeks tenant-placement turnaround); 5,365 units permitted in Oklahoma County in 2024 (569 in 5+ unit buildings).
- This rent runs 31% of the median local income ($47k/yr) — at the standard rent-burdened threshold; future hikes will face affordability resistance.
Forward outlook
- Local home prices are declining (-3.0%/yr); year-one equity from $864 of loan paydown is wiped out by about $4k of value loss. Plan a longer hold.
- Oklahoma County population projected at +41% by 2050 — long-run rental-demand tailwind backs the buy-and-hold thesis.
Negotiation context
- It's been on market 36 days — a 3% lower offer ($121k) is reasonable based on typical stale-listing flexibility.
- 8 sale attempts; this cycle's ask is 30% above the opening price — seller raised mid-cycle; expect resistance to lowballs.
- Current owner paid $50k; list at $125k implies a 150% gain — meaningful room to come down on a strong offer.
Risks & watch-outs
- Watch-outs: built in 1953 — expect roof / HVAC / electrical / plumbing capex.
- Climate carrying-cost: extreme-heat days projected 7→19/yr by 2055 (HVAC capex compounding) — expect insurance premiums to compound above CPI over the hold.
Questions for the listing agent
- It's been on market 36 days. Have you received any prior offers? Is the seller open to a 3% concession, seller financing, or rate buy-down credit?
- Built in 1953 — when were the roof, HVAC, electrical panel, plumbing, and water heater last replaced?
- Is there a deadline driving the sale (1031 exchange, divorce, estate, relocation)? That informs how much negotiation room exists.
- Schools are F-rated, which usually means shorter tenancies and higher turnover. Who's the typical renter profile here, and what's been the actual vacancy rate?
- Crime grade is F in this area — have there been break-ins, vandalism, or insurance claims at this property in the last 3 years? What carrier currently insures it and at what premium?
- The area grade is low — what's the realistic commute time and amenity access for the typical tenant pool here? Any planned neighborhood developments (good or bad) we should know about?
- What's the average days-on-market for RENTAL listings here right now (not sales)? A rising rental-DOM trend means longer vacancies and softer asking-rent achievability than the comps imply.
- What's the recent tenant-quality profile in this submarket — average credit score on applications, eviction rate, late-payment / NSF rate, and stable-employment percentage? A property-management company in the area should have these aggregated.
- How much new for-sale + rental construction is in the pipeline within 1–3 miles? Heavy new supply typically softens prices + rents 12–24 months out; constrained supply supports both.
Investment metrics
- 1% rule
- 0.97% ✗
- Cap rate
- 8.12%
- Cash-on-cash
- 6.53%
- DSCR
- 1.29
- GRM
- 8.6
CMA / ARV
- ARV (on-the-fly)
- $118,440
- Comps found
- 12
Show comp detail 12 sales within ~0.75 mi
| Address | Dist | Beds/Ba | Sqft | Sold | Price | $/sf | Match |
|---|---|---|---|---|---|---|---|
| 4308 S Wofford Ave | 0.37mi | 3/1.5 | 888 (+6%) | 2mo | $150,000 | $169 | 69 |
| 4308 Sunnylane Cir | 0.24mi | 3/1.5 | 900 (+7%) | 8mo | $178,000 | $198 | 68 |
| 4428 SE 39th St | 0.51mi | 3/1.0 | 867 (+3%) | 4mo | $85,000 | $98 | 68 |
| 3401 Lazy Ln | 0.50mi | 3/1.0 | 884 (+5%) | 6mo | $125,000 | $141 | 63 |
| 4709 S Dimple Dr | 0.26mi | 3/1.0 | 960 (+14%) | 8mo | $135,000 | $141 | 58 |
| 5101 S Karen St | 0.51mi | 3/1.5 | 941 (+12%) | 3mo | $75,000 | $80 | 52 |
| 3100 Dentwood Ter | 0.74mi | 3/1.5 | 924 (+10%) | 0mo | $150,000 | $162 | 46 |
| 4317 SE 55th St | 0.71mi | 2/1.0 (-1) | 910 (+8%) | 3mo | $75,000 | $82 | 45 |
| 3029 Dentwood Ter | 0.74mi | 3/1.5 | 926 (+10%) | 7mo | $128,000 | $138 | 40 |
| 5404 S Huddleston St | 0.67mi | 3/2.0 | 963 (+15%) | 1mo | $81,500 | $85 | 40 |
| 3205 Overland Dr | 0.72mi | 3/1.0 | 945 (+12%) | 8mo | $132,500 | $140 | 39 |
| 3101 Dentwood Ter | 0.73mi | 3/1.5 | 948 (+13%) | 9mo | $143,000 | $151 | 35 |
Match score weights: distance 35% · size 25% · config 20% · recency 20%. Top-matched comps best support the ARV.
Projected returns pro-forma
-3.0% appreciation · 1.26% rent growth · sell at horizon
- IRR
- -8.1%
- Equity multiple
- 0.71×
- Total profit
- $-10,262
- Equity at exit
- $18,638
- IRR
- -0.8%
- Equity multiple
- 0.95×
- Total profit
- $-1,778
- Equity at exit
- $10,808
Cash invested: $35,000 (down + closing). Projections, not guarantees.
Landlord ↔ Tenant lean methodology
- Overall (STATE)
- 83 Strongly Landlord-Friendly
- State Oklahoma
- 83 Strongly Landlord-Friendly · R+20
- County
- — inherits STATE
- City
- — inherits STATE
ZIP-level market 73115
- Home prices YoY
- -20.9%
- Rents YoY
- 1.3%
- Active inventory
- 121
- Price-to-rent
- 8.6×
Monthly cashflow live
- Estimated rent
- $1,217 high interval (Pro) →
- Mortgage (P&I)
- −$656
- Tax from tax record
- −$63 /mo · $760/yr
- Insurance
- −$52
- HOA
- −$0
- Vacancy / Maint / Mgmt
- −$256
- Net cashflow
- $190
Break-even live
Sensitivity live
| Price | -10% $261 | -5% $226 | +0% $190 | +5% $155 | +10% $120 |
|---|---|---|---|---|---|
| Rent | -10% $94 | -5% $142 | +0% $190 | +5% $238 | +10% $287 |
| Rate | -1.0pp $253 | -0.5pp $222 | base $190 | +0.5pp $158 | +1.0pp $125 |
UW: 25.0% down · 7.5% · 30yr · 1.5% tax · 5.0% vac · 8.0% maint · 8.0% mgmt
Financing live
Cash to close
- Down payment
- $31,250
- Closing costs
- $3,750
- Reserves months
- —
- Total cash needed
- —
Loan-product check · same deal, 3 products live
Conventional
25% down · 7.5% · 30yr
- Down + closing
- —
- Monthly P&I
- —
- Monthly cashflow
- —
- DSCR
- —
- Eligible?
- —
Personal DTI + credit; lowest rate.
DSCR
20% down · 8.5% · 30yr
- Down + closing
- —
- Monthly P&I
- —
- Monthly cashflow
- —
- DSCR
- —
- Eligible?
- —
No personal income docs; deal must DSCR.
Hard money
10% down · 12.0% · 12mo
- Down + closing
- —
- Monthly P&I
- —
- Monthly cashflow
- —
- DSCR
- —
- Eligible?
- —
Short-term bridge; refi at stabilization.
Rent comps 40 comps
| Address | Beds | Baths | Sqft | Rent | $/sqft | DOM | Units | Dist |
|---|---|---|---|---|---|---|---|---|
| 4128 SE 43rd St Oklahoma City, OK | 3.0 | 1.0 | 620 | $1,275 | $2.06 | 25d | 1 | 0.07mi |
| 4004 SE 45th Ter Oklahoma City, OK | 3.0 | 1.0 | 1006 | $995 | $0.99 | 25d | 1 | 0.14mi |
| 4104 SE 45th Ter Oklahoma City, OK | 4.0 | 1.5 | 1111 | $1,275 | $1.15 | 3d | 1 | 0.14mi |
| 3451 SE 44th St Oklahoma City, OK | 1.0–3.0 | 1.0–2.0 | 974 | $950 | $0.98 | 13d | 4 | 0.32mi |
| 3451 SE 44th St Unit 269 Del City, OK | 2.0 | 1.0 | 924 | $850 | $0.92 | 4d | 1 | 0.32mi |
| 4008 SE 47th St Oklahoma City, OK | 3.0 | 1.5 | 1082 | $1,145 | $1.06 | 4d | 1 | 0.32mi |
| 4101 SE 48th St Oklahoma City, OK | 3.0 | 1.0 | 974 | $1,245 | $1.28 | 17d | 1 | 0.35mi |
| 4217 SE 48th Ter Oklahoma City, OK | 3.0 | 1.5 | 1043 | $1,295 | $1.24 | 25d | 1 | 0.39mi |
| 4917 S Karen St Oklahoma City, OK | 3.0 | 1.5 | 960 | $1,100 | $1.15 | 25d | 1 | 0.41mi |
| 3305 Neighbors Ln Oklahoma City, OK | 3.0 | 1.0 | 945 | $1,250 | $1.32 | 4d | 1 | 0.54mi |
| 4721 SE 46th St Oklahoma City, OK | 3.0 | 2.0 | 1002 | $1,275 | $1.27 | 13d | 1 | 0.65mi |
| 4215 SE 53rd St Oklahoma City, OK | 1.0–2.0 | 1.0 | 769 | $915 | $1.19 | 25d | 1 | 0.66mi |
| 4600 Loch Ln Oklahoma City, OK | 2.0 | 1.0 | 834 | $1,195 | $1.43 | 22d | 1 | 0.67mi |
| 4500 Cherry Hill Ln Oklahoma City, OK | 2.0 | 1.0 | 850 | $820 | $0.96 | 25d | 1 | 0.68mi |
| 4702 Loch Ln Unit 4309 Oklahoma City, OK | 2.0 | 1.0 | 950 | $1,200 | $1.26 | 6d | 1 | 0.74mi |
| 5024 Brookdale St Oklahoma City, OK | 3.0 | 1.5 | 1039 | $1,550 | $1.49 | 23d | 1 | 0.78mi |
| 5537 S Sunnylane Rd Oklahoma City, OK | 1.0–2.0 | 1.0–1.5 | 840 | $850 | $1.01 | 4d | 11 | 0.80mi |
| 5316 S Briarwood Dr Oklahoma City, OK | 3.0 | 2.0 | 980 | $1,149 | $1.17 | 25d | 1 | 0.89mi |
| 2908 SE 47th St Oklahoma City, OK | 3.0 | 1.0 | 1100 | $1,350 | $1.23 | 4d | 1 | 0.95mi |
| 5216 Foster Dr Oklahoma City, OK | 3.0 | 1.5 | 894 | $995 | $1.11 | 45d | 1 | 0.96mi |
| 3005 SE 51st St Oklahoma City, OK | 2.0 | 1.0 | 842 | $995 | $1.18 | 45d | 1 | 0.97mi |
| 3409 Parker Dr Oklahoma City, OK | 3.0 | 1.0 | 918 | $1,250 | $1.36 | 5d | 1 | 0.97mi |
| 3925 SE 59th St Oklahoma City, OK | 2.0 | 1.5 | 993 | $1,211 | $1.22 | 23d | 1 | 1.00mi |
| 3424 Parker Dr Oklahoma City, OK | 3.0 | 1.0 | 1125 | $450 | $0.40 | 45d | 1 | 1.03mi |
| 3205 SE 55th St Oklahoma City, OK | 3.0 | 1.5 | 1119 | $1,300 | $1.16 | 45d | 1 | 1.05mi |
| 4741 Ridgeway Dr Oklahoma City, OK | 2.0 | 1.0 | 615 | $850 | $1.38 | 4d | 7 | 1.12mi |
| 4650 SE 29th St Del City, OK | 2.0 | 1.0 | 1100 | $900 | $0.82 | 25d | 1 | 1.12mi |
| 3812 SE 25th St Del City, OK | 3.0 | 1.0 | 1044 | $1,050 | $1.01 | 25d | 1 | 1.14mi |
| 4613 SE 28th St Del City, OK | 3.0 | 1.0 | 1056 | $1,255 | $1.19 | 3d | 1 | 1.17mi |
| 4613 SE 27th St Oklahoma City, OK | 2.0 | 1.0 | 768 | $1,050 | $1.37 | 25d | 1 | 1.22mi |
| 2621 SE 50th St Oklahoma City, OK | 3.0 | 1.5 | 1022 | $1,150 | $1.13 | 3d | 1 | 1.23mi |
| 4814 Kristie Dr Oklahoma City, OK | 2.0 | 1.0 | 825 | $895 | $1.08 | 25d | 1 | 1.36mi |
| 2333 Becker Pl Del City, OK | 3.0 | 1.0 | 972 | $1,025 | $1.05 | 23d | 1 | 1.37mi |
| 4769 SE 27th St Oklahoma City, OK | 3.0 | 1.0 | 1000 | $1,300 | $1.30 | 25d | 1 | 1.37mi |
| 3224 SE 24th St Oklahoma City, OK | 3.0 | 1.0 | 1122 | $1,195 | $1.07 | 6d | 1 | 1.37mi |
| 2312 Mustang St Oklahoma City, OK | 3.0 | 1.5 | 912 | $1,100 | $1.21 | 12d | 1 | 1.40mi |
| 4909 Cinderella Dr Oklahoma City, OK | 3.0 | 2.0 | 1113 | $1,150 | $1.03 | 4d | 1 | 1.40mi |
| 5707 SE 48th St Oklahoma City, OK | 1.0–3.0 | 1.0–2.0 | 899 | $1,363 | $1.52 | 3d | 6 | 1.40mi |
| 4816 S Fairmont Ave Oklahoma City, OK | 3.0 | 2.0 | 1091 | $1,275 | $1.17 | 25d | 1 | 1.41mi |
| 3900 Mallard Dr Oklahoma City, OK | 3.0 | 1.0 | 960 | $975 | $1.02 | 17d | 1 | 1.43mi |
Listing history 14 events
-
2026-06-21days on market $125,000 Active 36 DOM
-
2026-06-18days on market $125,000 Active 33 DOM
-
2026-06-17days on market $125,000 Active 32 DOM
-
2026-06-16days on market $125,000 Active 31 DOM
-
2026-06-15days on market $125,000 Active 30 DOM
-
2026-06-13days on market $125,000 Active 28 DOM
-
2026-06-13days on market $125,000 Active 27 DOM
-
2026-06-09days on market $125,000 Active 24 DOM
-
2026-06-08days on market $125,000 Active 23 DOM
-
2026-06-07days on market $125,000 Active 22 DOM
-
2026-06-05days on market $125,000 Active 19 DOM
-
2026-06-03days on market $125,000 Active 18 DOM
-
2026-06-02remarks 687-char remark
-
2026-06-02$125,000 Active 17 DOM
ⓘ Source: listings_history table (triggers on properties + properties_extension) + one-shot
backfill from property_details.listing_events for pre-trigger history.
Tax reassessment forecast OK · Resets to sale price
- Current annual tax
- $760 · $63/mo
- Projected year-2 tax
- $1,125 · $94/mo
- Expected delta
- +$365/yr (+$30/mo · 48.1%)
ⓘ Screening estimate from a state-policy table — verify with the county assessor before closing.
Climate risk First Street
- Flood 1/10 Low FEMA zone X (unshaded) · 0% chance over 30 yrs
- Wildfire 1/10 Low
- Heat 5/10 Major 7 d/yr ≥107°F today · 19 d/yr by 30 yrs out
- Wind 2/10 Low 4% chance of damaging wind over 30 yrs
- Air quality 2/10 Low 1 unhealthy d/yr today · 3 by 30 yrs out
Nearby sold comps map
Loading sold comps map…
Walkable amenities ~0.75 mi
Loading nearby amenities…
Taxation est. · year 1
- Rental income
- $14,602
- − Mortgage interest
- −$7,002
- − Property taxes
- −$760
- − Insurance
- −$625
- − Repairs & maintenance
- −$1,168
- − Management
- −$1,168
- − Depreciation
- −$3,636
- Taxable income
- $243
- Est. tax owed @ 24.0%
- −$58
- After-tax cash flow
- $2,226/yr
For passive investors: Depreciation is non-cash, so a rental often shows a tax loss while cash-flowing — sheltering income. Rental losses are passive: they offset passive income freely, and up to $25,000/yr can offset ordinary (W-2) income if you actively participate and your MAGI is under $100k (phasing out to $0 by $150k); unused losses carry forward. On sale, claimed depreciation is recaptured at up to 25%, and gains may owe capital-gains tax (a 1031 exchange can defer both). Figures are a year-1 estimate at your 24.0% rate — not tax advice; consult a CPA.
Schools (NCES district)
- District
- Midwest City-Del City
- NCES district ID
- 4019950
- Math proficiency
- 10% ▼ -11.00%
- Reading proficiency
- 17% ▼ -8.00%
- Median HH income
- $45,724
- Composite
- 12.09/100
- National rank
- #9658
- State rank
- #231 of 270 in OK
Livability — Del City
- Score
- 64/100
- State rank
- #180
- US rank
- #14305
Category grades
Schools grade is shown separately in the Schools card above.
Census & demographics
- Census place
- Del City, OK
- County
- Oklahoma County · 771,644 people
- City population
- 20,225
- Metro
- Oklahoma City, OK
- Population (ZIP)
- 20,225
- Household income
- $46,810
- Rent vs Own
- Severe rent burden
- 965.0
Population outlook (Oklahoma County) Hauer SSP2
- Today (2025)
- 911,875 people
- By 2030
- 982,413 · +7.7%
- By 2040
- 1,130,468 · +24.0%
- By 2050
- 1,288,422 · +41.3%
- By 2075
- 1,711,482 · +87.7%
- By 2100
- 2,088,448 · +129.0%
Race, ethnicity, and origin ACS 2023
- Neighborhood character
- Diverse neighborhood (Simpson 0.69)
- Race & ethnicity
- White 50% Black 19% Hispanic / Latino 15% Two or more races 14% Native American 5% Asian 1%
- Hispanic origin (detail)
- Mexican 11% Puerto Rican 2%
- Common ancestry
- Italian 2% Lithuanian 1% Slovak 1%
- Foreign-born
- 4% · Canada
- Languages at home
- 91% English-only · Spanish 8%
Political lean MEDSL · Oklahoma
- 2024 margin
- Toss-up / Even · D 48.0% · R 49.7% · Other 2.3%
- 2008→2024 swing
- +15.1pp toward D · 2008: -16.8pp · 2024: -1.7pp
- All cycles
- 2024: R+1.7 2020: R+1.1 2016: R+10.5 2012: R+16.7 2008: R+16.8
Not yet ingested
- Civics
- —
Market trends
- HPI YoY
- ▼ -71.80%
- Current HPI
- 271.8383
- Rent YoY
- ▲ 1.26%
- Metro
- Oklahoma City, OK
- State GDP YoY
- ▲ 1.55%
- F500 in state
- 6
Industry mix (Fortune 500 HQ in OK)
| Industry | F500 HQs | Revenue |
|---|---|---|
| Energy | 3 | $48B |
|
||
Price history
+150.0% since first listed12 events — show timeline
- 2026-06-02 Relisted — MLSOK
- 2026-05-19 Price Changed $125,000 MLSOK
- 2026-05-17 Relisted — MLSOK
- 2026-04-21 Relisted — MLSOK
- 2026-03-30 Relisted — MLSOK
- 2026-03-24 Relisted — MLSOK
- 2026-03-02 Relisted — MLSOK
- 2026-02-02 Relisted — MLSOK
- 2025-09-28 Pending — MLSOK
- 2025-09-19 Listed $96,000 MLSOK
- 2022-12-04 Rental Removed — RENT.
- 2020-09-21 Sold (Public Records) $50,000 Public Records
Property tax history
+2.3%/yrLatest (2025): $760 · +2.8% YoY. Source: county tax records.
Cash-flow waterfall
monthlySold comps — $/sqft
last 12 mo · ≤1 miLoading sold comps…