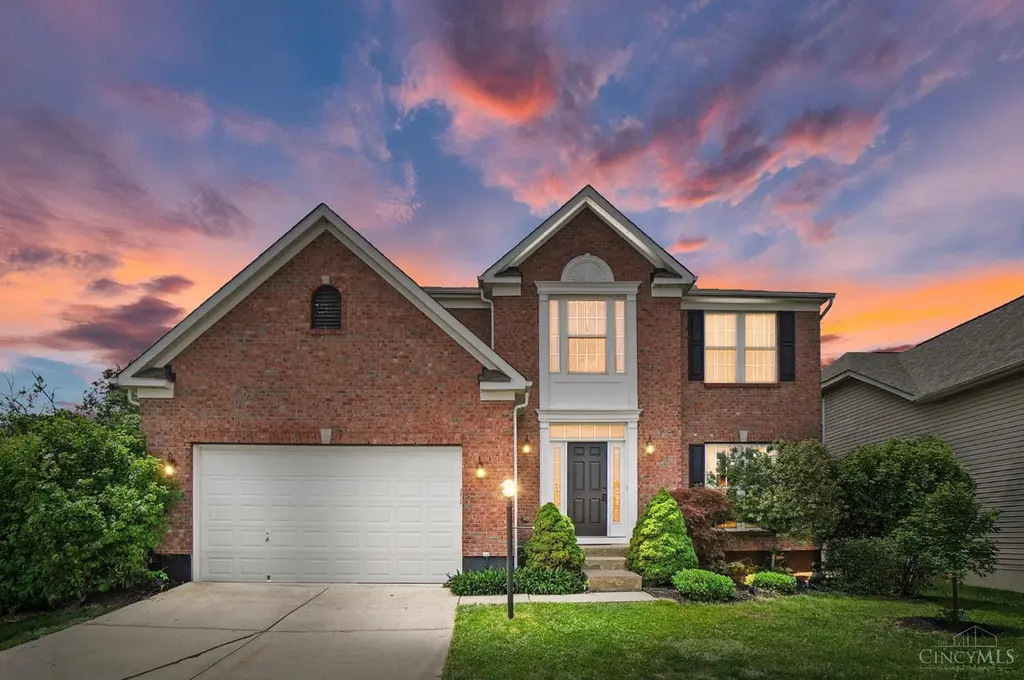
303 Delaware Dr · Maineville, OH
Flood risk 1/10 · Minimal
- FEMA flood zone
- X (unshaded)
- Chance of flooding over 30 yrs
- 0.0%
- Est. flood insurance / yr
- $473 – $860
Fire risk 3/10 · Minor
- Est. fire insurance / yr
- $713 – $1,323
Heat risk 4/10 · Minor
- Hot days now (above 101°F)
- 7 days/yr
- Hot days in 30 yrs
- 19 days/yr
Wind risk 2/10 · Minimal
- Chance of severe wind over 30 yrs
- 1.0%
Air-quality risk 4/10 · Minor
- Unhealthy air days now
- 4 days/yr
- Unhealthy air days in 30 yrs
- 6 days/yr
Risk factors via First Street. Map © Google.
Why this score? — see what drove the F grade
The composite is a weighted blend of 9 inputs, each scored 0–100. Each bar is that input's sub-score; the figure is the points it added to the 100-point composite (weight × sub-score).
- Appreciation +10.0/10.0
- Schools +6.1/10.0
- Cash flow +5.6/30.0
- Rent growth +4.4/5.0
- Livability +3.5/5.0
- Condition / age +2.5/5.0
- 1% rule +0.7/10.0
- DSCR +0.0/10.0
- ARV discount +0.0/15.0
$469,900
🖨 Deal sheet 📄 Offer letter ✓ Due diligence
Listing remarks MLS
Hardwood Thruout First Floor! Remodeled Gourmet Kitchen! Wooded View!Vaulted Morning Rm! Spacious Vaulted Mstr Bdrm with Walk-In Closet & Whirlpool Bath! Full Basement with Walkout to Patio & True 5th Bdrm- Could Also be a Study! Must See!
Key facts
- 9,945 sq ft lot
- 2 garage spots
- Built 2005
Property features AI
Finance
- HOA & community: HOA: Towne Properties; Annual association fee approximately $400 paid by owner; Association fee includes association dues, community landscaping, and play area
Exterior
- Parking: Built-in front garage with 2 garage spaces; Driveway parking
- Security: Smoke alarm
- Utilities: Public water; Public sewer; Natural gas
- Home design: Traditional single-family home; Two levels; Poured foundation; Less than 0.5 acre lot (approximately 0.228 acres); Residential zoning
- Construction: Shingle roof; Brick and vinyl siding construction; Poured foundation; Built in (garage/carport) front
- Exterior features: Deck; Patio; Brick and vinyl siding exterior; Vinyl insulated windows; One gas fireplace with brick surround
Interior
- Kitchen: Gourmet kitchen; Wood cabinets; Marble/granite/slate countertops; Wood flooring in kitchen; Dishwasher; Electric cooktop; Oven/range; Refrigerator; Garbage disposal; Breakfast room 18 x 10
- Bedrooms: 5 bedrooms total; Primary bedroom 19 x 12 (level 2); Bedroom 2 15 x 10 (level 2); Bedroom 3 11 x 10 (level 2); Bedroom 4 13 x 12 (level 2); Bedroom 5 14 x 13 (lower level)
- Flooring: Wood floors in dining, living, family, and kitchen areas; Concrete and wood flooring at entry/foyer
- Bathrooms: 3 full bathrooms; 1 half bathroom; Primary bathroom with shower and tub; One full bathroom on lower level; Partial bathroom on level 1; Two full bathrooms on level 2
- Heating & cooling: Forced air heating (gas); Central air conditioning; Gas water heating
- Interior features: 9ft+ ceilings; Vaulted ceiling; French doors; Multi-panel doors; Recessed lights; Ceiling fan; Smoke alarm; Total of 12 rooms; Finished basement with glass block window
- Laundry & utility: Main-level laundry room 8 x 7; Washer/dryer hookups (laundry room); Water softener; Garage door opener
Neighborhood map
What this means for you Summary
Snapshot
- This is a 4-bed/2.5-bath single-family listed at $470k.
Deal economics
- At list price, monthly cash flow is $-976 ($-12k/yr) — negative.
- To cash-flow at today's rent, offer at most $297k (36.7% below list).
- To meet the 1% rule (rent ≥ 1% of price), the offer needs to be $270k (42.6% below list).
- Recommended offer: $270k (42.6% below list) — sets the bar for 1% rule.
Location & tenants
- Location reads 69/100 on livability (#529 in OH) — a middle-class / working-renter tenant base. Strengths: crime A+, employment A+, cost of living A+; Watch: amenities F, commute F, health & safety F.
- Little Miami Local (rural): math 67% / reading 70% proficiency, ranked #140 of 656 in OH (top 21%) — acceptable for families but not a draw, mixed tenant base, ~2y average lease; only 17% free/reduced lunch — higher-income household profile.
- Market conditions: Rents rising fast (+7.4%/yr); 126 active listings in the ZIP; 4 comparable units currently listed for rent nearby; rentals lingering (median 44d on market — plan ~5-8 weeks vacancy on turnover, expect pricing pressure); 75% of comp listings sitting > 30 days — soft ceiling on asking rent; solid renter incomes; 1,224 units permitted in Warren County in 2024 (474 in 5+ unit buildings).
Forward outlook
- In year one you build about $50k of equity ($3k loan paydown + $47k appreciation (10.0% local appreciation)).
- Warren County population projected at +16% by 2050 — long-run rental-demand tailwind backs the buy-and-hold thesis.
- By year 2, paydown + projected appreciation supports a ~$81k cash-out refi (75% LTV) — recoverable capital for the next deal without selling this one.
Negotiation context
- Only 7 days on market — expect competitive offers; lowballing is unlikely to land.
- 3 sale attempts since 16y ago with the ask held roughly flat each time — persistent listings suggest the price (not the market) is what's stuck; bring a comps-based counter.
- Current owner paid $188k; list at $470k implies a 151% gain — meaningful room to come down on a strong offer.
Questions for the listing agent
- What do current leases actually rent for vs. the listed asking? Can we see a recent rent roll and the last 12 months of T-12 income?
- What does the HOA fee cover, when was the last increase, and are there any pending special assessments or reserve-fund shortfalls?
- Is there a deadline driving the sale (1031 exchange, divorce, estate, relocation)? That informs how much negotiation room exists.
- Schools are A-rated — typically a magnet for longer-tenancy family renters. What's the average tenant stay here, and is there a school-zone premium baked into asking?
- The area grade is low — what's the realistic commute time and amenity access for the typical tenant pool here? Any planned neighborhood developments (good or bad) we should know about?
- What's the average days-on-market for RENTAL listings here right now (not sales)? A rising rental-DOM trend means longer vacancies and softer asking-rent achievability than the comps imply.
- What's the recent tenant-quality profile in this submarket — average credit score on applications, eviction rate, late-payment / NSF rate, and stable-employment percentage? A property-management company in the area should have these aggregated.
- How much new for-sale + rental construction is in the pipeline within 1–3 miles? Heavy new supply typically softens prices + rents 12–24 months out; constrained supply supports both.
Investment metrics
- 1% rule
- 0.57% ✗
- Cap rate
- 3.80%
- Cash-on-cash
- -8.91%
- DSCR
- 0.60
- GRM
- 14.5
CMA / ARV
- ARV (on-the-fly)
- $397,250
- Comps found
- 12
Show comp detail 12 sales within ~0.75 mi
| Address | Dist | Beds/Ba | Sqft | Sold | Price | $/sf | Match |
|---|---|---|---|---|---|---|---|
| 292 Coyote Dr | 0.10mi | 3/3.5 (-1) | 2,324 (+2%) | 2mo | $422,000 | $182 | 81 |
| 185 Bannock Dr | 0.12mi | 4/2.5 | 2,144 (-6%) | 8mo | $329,900 | $154 | 79 |
| 398 Wyndham Dr | 0.11mi | 4/3.5 | 2,480 (+9%) | 4mo | $410,000 | $165 | 73 |
| 7182 Wethersfield Dr | 0.21mi | 4/2.5 | 2,490 (+10%) | 7mo | $425,000 | $171 | 68 |
| 504 Dakota Run | 0.53mi | 4/3.5 | 2,144 (-6%) | 1mo | $409,900 | $191 | 61 |
| 236 Regency Sq | 0.68mi | 4/3.0 | 2,252 (-1%) | 7mo | $450,000 | $200 | 59 |
| 1068 Beacon Way Ct | 0.73mi | 4/2.5 | 2,200 (-3%) | 2mo | $415,000 | $189 | 59 |
| 6804 Mossy Rock Ct | 0.74mi | 4/2.5 | 2,375 (+5%) | 2mo | $415,000 | $175 | 56 |
| 315 Indian Pointe Dr | 0.50mi | 4/2.5 | 2,512 (+11%) | 6mo | $412,000 | $164 | 54 |
| 7545 Hyatts Ln | 0.73mi | 4/2.5 | 2,049 (-10%) | 2mo | $350,000 | $171 | 48 |
| 7037 Tradewind Ct | 0.49mi | 3/3.5 (-1) | 2,000 (-12%) | 7mo | $390,000 | $195 | 42 |
| 7540 Robin Dr | 0.64mi | 3/2.0 (-1) | 2,000 (-12%) | 3mo | $343,500 | $172 | 40 |
Match score weights: distance 35% · size 25% · config 20% · recency 20%. Top-matched comps best support the ARV.
Projected returns pro-forma
10.0% appreciation · 7.42% rent growth · sell at horizon
- IRR
- 19.0%
- Equity multiple
- 2.57×
- Total profit
- $206,209
- Equity at exit
- $423,323
- IRR
- 18.4%
- Equity multiple
- 6.22×
- Total profit
- $686,391
- Equity at exit
- $912,912
Cash invested: $131,572 (down + closing). Projections, not guarantees.
Landlord ↔ Tenant lean methodology
- Overall (STATE)
- 73 Landlord-Friendly
- State Ohio
- 73 Landlord-Friendly · R+6
- County
- — inherits STATE
- City
- — inherits STATE
ZIP-level market 45039
- Home prices YoY
- 7.3%
- Rents YoY
- 7.4%
- Active inventory
- 126
- Price-to-rent
- 14.5×
Monthly cashflow live
- Estimated rent
- $2,696 medium interval (Pro) →
- Mortgage (P&I)
- −$2,464
- Tax from tax record
- −$413 /mo · $4,955/yr
- Insurance
- −$196
- HOA
- −$33
- Vacancy / Maint / Mgmt
- −$566
- Net cashflow
- $-976
Break-even live
UW: 25.0% down · 7.5% · 30yr · 1.5% tax · 5.0% vac · 8.0% maint · 8.0% mgmt
Financing live
Cash to close
- Down payment
- $117,475
- Closing costs
- $14,097
- Reserves months
- —
- Total cash needed
- —
Loan-product check · same deal, 3 products live
Conventional
25% down · 7.5% · 30yr
- Down + closing
- —
- Monthly P&I
- —
- Monthly cashflow
- —
- DSCR
- —
- Eligible?
- —
Personal DTI + credit; lowest rate.
DSCR
20% down · 8.5% · 30yr
- Down + closing
- —
- Monthly P&I
- —
- Monthly cashflow
- —
- DSCR
- —
- Eligible?
- —
No personal income docs; deal must DSCR.
Hard money
10% down · 12.0% · 12mo
- Down + closing
- —
- Monthly P&I
- —
- Monthly cashflow
- —
- DSCR
- —
- Eligible?
- —
Short-term bridge; refi at stabilization.
Rent comps 4 comps
| Address | Beds | Baths | Sqft | Rent | $/sqft | DOM | Units | Dist |
|---|---|---|---|---|---|---|---|---|
| 330 Heftner Cir Maineville, OH | 3.0 | 2.5 | 1588 | $2,056 | $1.29 | 7d | 1 | 0.91mi |
| 7831 Healy Dr Maineville, OH | 3.0 | 2.5 | 2084 | $2,671 | $1.28 | 44d | 1 | 0.99mi |
| 7814 Wilderness Way Maineville, OH | 4.0 | 2.0 | 2140 | $2,671 | $1.25 | 44d | 1 | 1.44mi |
| 903 Pineneedle Pl Maineville, OH | 4.0 | 2.5 | 1848 | $2,231 | $1.21 | 44d | 1 | 1.47mi |
HOA detail
- Monthly dues
- $33 · $396/yr
- Likely covers
- pool
Listing history 7 events
-
2026-06-18days on market $469,900 Active 7 DOM
-
2026-06-17price $469,900 Active 6 DOM
-
2026-06-17days on market $475,000 Active 6 DOM
-
2026-06-16days on market $475,000 Active 5 DOM
-
2026-06-15days on market $475,000 Active 4 DOM
-
2026-06-13remarks 699-char remark
-
2026-06-13$475,000 Active 2 DOM
ⓘ Source: listings_history table (triggers on properties + properties_extension) + one-shot
backfill from property_details.listing_events for pre-trigger history.
Tax reassessment forecast OH · Partial reset (capped growth)
- Current annual tax
- $4,955 · $413/mo
- Projected year-2 tax
- $6,143 · $512/mo
- Expected delta
- +$1,188/yr (+$99/mo · 24.0%)
ⓘ Screening estimate from a state-policy table — verify with the county assessor before closing.
Climate risk First Street
- Flood 1/10 Low FEMA zone X (unshaded) · 0% chance over 30 yrs
- Wildfire 3/10 Moderate
- Heat 4/10 Moderate 7 d/yr ≥101°F today · 19 d/yr by 30 yrs out
- Wind 2/10 Low 100% chance of damaging wind over 30 yrs
- Air quality 4/10 Moderate 4 unhealthy d/yr today · 6 by 30 yrs out
Nearby sold comps map
Loading sold comps map…
Walkable amenities ~0.75 mi
Loading nearby amenities…
Taxation est. · year 1
- Rental income
- $32,348
- − Mortgage interest
- −$26,322
- − Property taxes
- −$4,955
- − Insurance
- −$2,350
- − Repairs & maintenance
- −$2,588
- − Management
- −$2,588
- − HOA
- −$396
- − Depreciation
- −$13,670
- Taxable loss
- −$20,520
- Est. tax savings @ 24.0%
- +$4,925
- After-tax cash flow
- $-6,792/yr
For passive investors: Depreciation is non-cash, so a rental often shows a tax loss while cash-flowing — sheltering income. Rental losses are passive: they offset passive income freely, and up to $25,000/yr can offset ordinary (W-2) income if you actively participate and your MAGI is under $100k (phasing out to $0 by $150k); unused losses carry forward. On sale, claimed depreciation is recaptured at up to 25%, and gains may owe capital-gains tax (a 1031 exchange can defer both). Figures are a year-1 estimate at your 24.0% rate — not tax advice; consult a CPA.
Schools (NCES district)
- District
- Little Miami Local
- NCES district ID
- 3905044
- Math proficiency
- 67% ▼ -11.00%
- Reading proficiency
- 70% ▼ -6.00%
- Median HH income
- $74,949
- Composite
- 60.5/100
- National rank
- #844
- State rank
- #140 of 656 in OH
Livability — Maineville
- Score
- 69/100
- State rank
- #529
- US rank
- #9001
Category grades
Schools grade is shown separately in the Schools card above.
Census & demographics
- County
- Warren County · 196,906 people
- Metro
- Cincinnati, OH-KY-IN
- Population (ZIP)
- 28,335
- Household income
- $108,794
- Rent vs Own
- Severe rent burden
- 307.0
Population outlook (Warren County) Hauer SSP2
- Today (2025)
- 248,603 people
- By 2030
- 259,345 · +4.3%
- By 2040
- 277,666 · +11.7%
- By 2050
- 289,599 · +16.5%
- By 2075
- 311,681 · +25.4%
- By 2100
- 302,738 · +21.8%
Race, ethnicity, and origin ACS 2023
- Neighborhood character
- Predominantly White (88%)
- Race & ethnicity
- White 88% Hispanic / Latino 5% Two or more races 5% Asian 3% Black 2%
- Common ancestry
- Romanian 2% Scotch-Irish 2% Lithuanian 2%
- Foreign-born
- 8% · Canada, Jamaica
- Languages at home
- 92% English-only · Spanish 3% Russian/Polish/Slavic 2% Other Indo-European 1%
Political lean MEDSL · Warren
- 2024 margin
- Solid R (+31.5) · D 33.8% · R 65.3%
- 2008→2024 swing
- +4.5pp toward D · 2008: -36.1pp · 2024: -31.5pp
- All cycles
- 2024: R+31.5 2020: R+30.8 2016: R+37.6 2012: R+39.5 2008: R+36.1
Not yet ingested
- Civics
- —
Market trends
- HPI YoY
- ▲ 38.63%
- Current HPI
- 568.09
- Rent YoY
- ▲ 7.42%
- Metro
- Cincinnati, OH-KY-IN
- State GDP YoY
- ▲ 1.98%
- F500 in state
- 48
Industry mix (Fortune 500 HQ in OH)
| Industry | F500 HQs | Revenue |
|---|---|---|
| Insurance | 3 | $145B |
|
||
| Industrial Machinery | 3 | $49B |
|
||
| Financial Services | 3 | $24B |
|
||
| Consumer Goods | 2 | $93B |
|
||
| Aerospace / Defense | 2 | $47B |
|
||
| Utilities | 2 | $33B |
|
||
Price history
+206.5% since first listed7 events — show timeline
- 2026-06-12 Listed $475,000 Cincy MLS
- 2012-04-06 Sold (Public Records) $187,500 Public Records
- 2012-04-06 Sold (Public Records) $187,500 Public Records
- 2012-04-03 Sold (MLS) $187,500 Cincy MLS
- 2011-11-03 Listed $199,900 Cincy MLS
- 2010-10-15 Sold (MLS) $155,000 Cincy MLS
- 2010-08-10 Listed $155,000 Cincy MLS
Property tax history
+2.8%/yrLatest (2025): $4,955 · -0.0% YoY. Source: county tax records.
Cash-flow waterfall
monthlySold comps — $/sqft
last 12 mo · ≤1 miLoading sold comps…