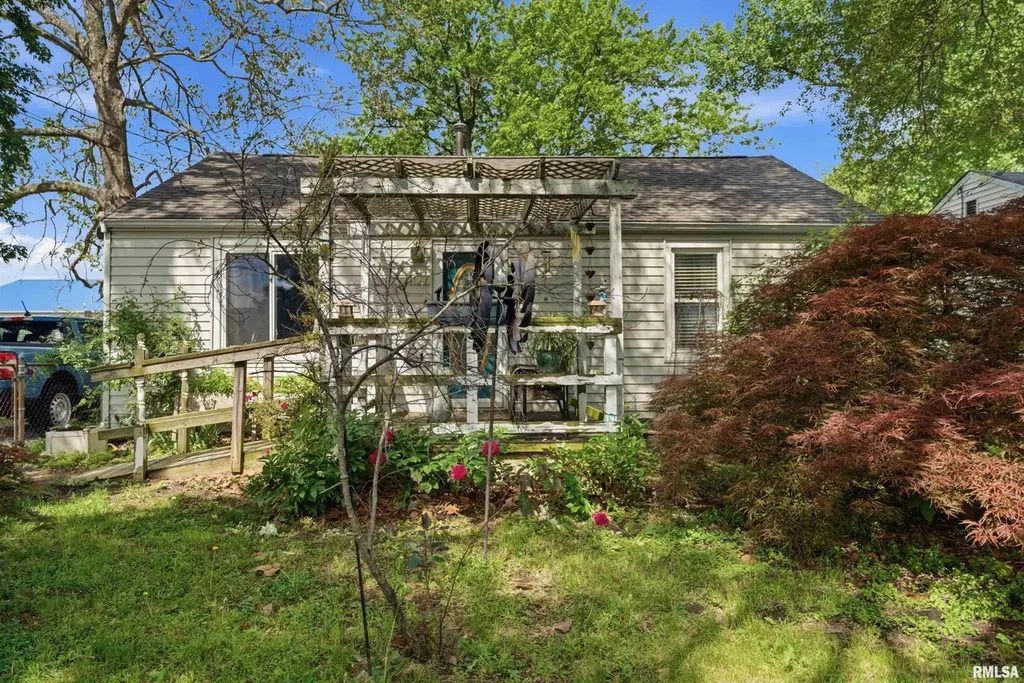
107 Florida Ave · East Peoria, IL
Flood risk 1/10 · Minimal
- FEMA flood zone
- X (unshaded)
- Chance of flooding over 30 yrs
- 0.0%
- Est. flood insurance / yr
- $507 – $1,088
Fire risk 1/10 · Minimal
- Est. fire insurance / yr
- $804 – $1,492
Heat risk 3/10 · Minor
- Hot days now (above 103°F)
- 7 days/yr
- Hot days in 30 yrs
- 18 days/yr
Wind risk 2/10 · Minimal
- Chance of severe wind over 30 yrs
- 1.0%
Air-quality risk 2/10 · Minimal
- Unhealthy air days now
- 1 days/yr
- Unhealthy air days in 30 yrs
- 2 days/yr
Risk factors via First Street. Map © Google.
Why this score? — see what drove the B grade
The composite is a weighted blend of 9 inputs, each scored 0–100. Each bar is that input's sub-score; the figure is the points it added to the 100-point composite (weight × sub-score).
- Cash flow +30.0/30.0
- ARV discount +12.9/15.0
- DSCR +10.0/10.0
- 1% rule +9.5/10.0
- Livability +3.8/5.0
- Rent growth +2.5/5.0
- Condition / age +2.5/5.0
- Schools +1.1/10.0
- Appreciation +0.0/10.0
$99,900
🖨 Deal sheet 📄 Offer letter ✓ Due diligence
Listing remarks
Charming 2-bedroom, 1-bath home featuring a fully fenced yard perfect for pets, entertaining, or relaxing outdoors. This home offers peace of mind with numerous major updates already completed, including newer HVAC, insulation, sump pump, roof, and water heater. Inside, you'll find a comfortable layout with plenty of natural light and functional living space. A great opportunity for first-time buyers, downsizers, or investors looking for a move-in-ready property with big-ticket improvements already taken care of.
Key facts
- Newer sump pump
- Newer roof
- Fully fenced yard
Tags
Property features AI
Finance
- Other: Subdivision: Lawnwood; Directions: Summit to Washington to Florida Ave.
- HOA & community: No association fee
Exterior
- Parking: Gravel parking (no garage)
- Utilities: Public water; Public sewer
- Home design: Single family residence; Built in 1950; Single-story main level with additional lower/upper/basement levels noted
- Construction: Built in 1950
- Exterior features: Level lot; Lot approximately 54 x 100; Shingle roof
Interior
- Kitchen: Includes dishwasher and refrigerator
- Bedrooms: 2 bedrooms (Bedroom 1 and Bedroom 2 on the main level)
- Flooring: Hardwood flooring in bedrooms, living room, kitchen, and laundry
- Bathrooms: 1 full bathroom
- Heating & cooling: Gas water heater
- Interior features: Crawl space basement; Dishwasher; Refrigerator; Washer; Dryer; No fireplaces
- Laundry & utility: Main-level laundry with washer and dryer
Neighborhood map
What this means for you Summary
Snapshot
- This is a 2-bed/1.0-bath single-family listed at $100k.
Deal economics
- At list price, monthly cash flow is $484 ($6k/yr) — positive.
- The deal already cash-flows at list — no discount required.
- Meets the 1% rule at list price ($1k rent vs $100k).
- Recommended offer: $98k (1.5% below list) — sets the bar for market timing.
- Cap rate 12.1% vs local median 4.6% in East Peoria — top-decile yield for the area; either an underpriced asset or a hidden risk that comps aren't pricing in. Stress-test before assuming the spread holds.
Location & tenants
- Location reads 75/100 on livability (#209 in IL, #3,927 nationally) — a middle-class / working-renter tenant base. Strengths: cost of living A+, housing A+, health & safety A+; Watch: amenities D, schools F, commute F.
- District 50 Schools (suburban): math 12% / reading 11% proficiency, ranked #553 of 620 in IL (top 89%) — low school quality limits family demand, transient renter base, plan for 1-2y turnover.
- Market conditions: 129 active listings in the ZIP; 3 comparable units currently listed for rent nearby; rentals leasing fast (median 14d on market — plan ~1-2 weeks tenant-placement turnaround); 77 units permitted in Tazewell County in 2024 (0 in 5+ unit buildings).
Forward outlook
- Local home prices are declining (-3.0%/yr); year-one equity from $691 of loan paydown is wiped out by about $3k of value loss. Plan a longer hold.
- Tazewell County population projected at -15% by 2050 — secular population decline; favor cash flow + early exit over multi-decade hold.
- At projected returns (-3.0% appreciation + 3.0% rent growth), your $28k cash investment doubles in ~6 years — after that, you're playing with house money.
Negotiation context
- It's been on market 24 days — a 2% lower offer ($98k) is reasonable based on typical stale-listing flexibility.
Risks & watch-outs
- Watch-outs: built in 1950 — expect roof / HVAC / electrical / plumbing capex.
Questions for the listing agent
- Built in 1950 — when were the roof, HVAC, electrical panel, plumbing, and water heater last replaced?
- Is there a deadline driving the sale (1031 exchange, divorce, estate, relocation)? That informs how much negotiation room exists.
- Schools are F-rated, which usually means shorter tenancies and higher turnover. Who's the typical renter profile here, and what's been the actual vacancy rate?
- What's the average days-on-market for RENTAL listings here right now (not sales)? A rising rental-DOM trend means longer vacancies and softer asking-rent achievability than the comps imply.
- What's the recent tenant-quality profile in this submarket — average credit score on applications, eviction rate, late-payment / NSF rate, and stable-employment percentage? A property-management company in the area should have these aggregated.
- How much new for-sale + rental construction is in the pipeline within 1–3 miles? Heavy new supply typically softens prices + rents 12–24 months out; constrained supply supports both.
Investment metrics
- 1% rule
- 1.45% ✓
- Cap rate
- 12.11%
- Cash-on-cash
- 20.78%
- DSCR
- 1.92
- GRM
- 5.7
CMA / ARV
- ARV (on-the-fly)
- $113,664
- Comps found
- 12
Show comp detail 12 sales within ~0.75 mi
| Address | Dist | Beds/Ba | Sqft | Sold | Price | $/sf | Match |
|---|---|---|---|---|---|---|---|
| 118 Florida Ave | 0.07mi | 2/1.0 | 768 (0%) | 4mo | $113,500 | $148 | 94 |
| 121 Albert St | 0.27mi | 2/1.0 | 780 (+2%) | 2mo | $142,000 | $182 | 83 |
| 110 Loren St | 0.11mi | 2/1.0 | 780 (+2%) | 12mo | $145,000 | $186 | 83 |
| 200 Connecticut St | 0.13mi | 2/1.0 | 800 (+4%) | 12mo | $115,000 | $144 | 77 |
| 112 Briargate Rd | 0.33mi | 2/1.0 | 816 (+6%) | 2mo | $150,000 | $184 | 72 |
| 212 Esser St | 0.26mi | 2/1.0 | 728 (-5%) | 10mo | $83,000 | $114 | 70 |
| 202 Stahl Ave | 0.44mi | 2/1.0 | 808 (+5%) | 10mo | $111,500 | $138 | 62 |
| 111 Stahl Ave | 0.46mi | 2/1.0 | 720 (-6%) | 10mo | $118,000 | $164 | 60 |
| 211 Florida Ave | 0.17mi | 3/1.0 (+1) | 860 (+12%) | 9mo | $118,500 | $138 | 59 |
| 208 Esser St | 0.24mi | 3/1.0 (+1) | 874 (+14%) | 9mo | $115,000 | $132 | 54 |
| 2252 Northridge Ln | 0.68mi | 3/1.0 (+1) | 825 (+7%) | 1mo | $130,000 | $158 | 50 |
| 2244 Northridge Ln | 0.72mi | 3/1.0 (+1) | 825 (+7%) | 2mo | $119,900 | $145 | 47 |
Match score weights: distance 35% · size 25% · config 20% · recency 20%. Top-matched comps best support the ARV.
Projected returns pro-forma
-3.0% appreciation · 3.0% rent growth · sell at horizon
- IRR
- 13.2%
- Equity multiple
- 1.52×
- Total profit
- $14,673
- Equity at exit
- $14,895
- IRR
- 22.0%
- Equity multiple
- 2.88×
- Total profit
- $52,529
- Equity at exit
- $8,638
Cash invested: $27,972 (down + closing). Projections, not guarantees.
Landlord ↔ Tenant lean methodology
- Overall (STATE)
- 43 Moderately Tenant-Leaning
- State Illinois
- 43 Moderately Tenant-Leaning · D+7
- County
- — inherits STATE
- City
- — inherits STATE
ZIP-level market 61571
- Active inventory
- 129
- Price-to-rent
- 5.7×
Monthly cashflow live
- Estimated rent
- $1,452 medium interval (Pro) →
- Mortgage (P&I)
- −$524
- Tax from tax record
- −$97 /mo · $1,166/yr
- Insurance
- −$42
- HOA
- −$0
- Vacancy / Maint / Mgmt
- −$305
- Net cashflow
- $484
Break-even live
UW: 25.0% down · 7.5% · 30yr · 1.5% tax · 5.0% vac · 8.0% maint · 8.0% mgmt
Financing live
Cash to close
- Down payment
- $24,975
- Closing costs
- $2,997
- Reserves months
- —
- Total cash needed
- —
Loan-product check · same deal, 3 products live
Conventional
25% down · 7.5% · 30yr
- Down + closing
- —
- Monthly P&I
- —
- Monthly cashflow
- —
- DSCR
- —
- Eligible?
- —
Personal DTI + credit; lowest rate.
DSCR
20% down · 8.5% · 30yr
- Down + closing
- —
- Monthly P&I
- —
- Monthly cashflow
- —
- DSCR
- —
- Eligible?
- —
No personal income docs; deal must DSCR.
Hard money
10% down · 12.0% · 12mo
- Down + closing
- —
- Monthly P&I
- —
- Monthly cashflow
- —
- DSCR
- —
- Eligible?
- —
Short-term bridge; refi at stabilization.
Rent comps 3 comps
| Address | Beds | Baths | Sqft | Rent | $/sqft | DOM | Units | Dist |
|---|---|---|---|---|---|---|---|---|
| 2244 Northridge Ln Washington, IL | 3.0 | 1.0 | 825 | $1,500 | $1.82 | 13d | 1 | 0.73mi |
| 924 School St Washington, IL | 2.0 | 2.0 | 1000 | $1,250 | $1.25 | 13d | 1 | 0.91mi |
| 100 Pheasant Run Washington, IL | 2.0 | 2.0 | 1121 | $1,612 | $1.44 | 13d | 6 | 1.01mi |
Listing history 14 events
-
2026-06-14status $99,900 Pending 24 DOM
-
2026-06-13days on market $99,900 Active 24 DOM
-
2026-06-12days on market $99,900 Active 23 DOM
-
2026-06-09days on market $99,900 Active 20 DOM
-
2026-06-08days on market $99,900 Active 19 DOM
-
2026-06-07days on market $99,900 Active 18 DOM
-
2026-06-05days on market $99,900 Active 16 DOM
-
2026-06-04days on market $99,900 Active 14 DOM
-
2026-06-02days on market $99,900 Active 13 DOM
-
2026-06-01price $99,900 Active 12 DOM
-
2026-06-01days on market $110,000 Active 12 DOM
-
2026-05-31days on market $110,000 Active 11 DOM
-
2026-05-31days on market $110,000 Active 10 DOM
-
2026-05-19$110,000 Active
ⓘ Source: listings_history table (triggers on properties + properties_extension) + one-shot
backfill from property_details.listing_events for pre-trigger history.
Tax reassessment forecast IL · Partial reset (capped growth)
- Current annual tax
- $1,166 · $97/mo
- Projected year-2 tax
- $1,717 · $143/mo
- Expected delta
- +$551/yr (+$46/mo · 47.2%)
ⓘ Screening estimate from a state-policy table — verify with the county assessor before closing.
Climate risk First Street
- Flood 1/10 Low FEMA zone X (unshaded) · 0% chance over 30 yrs
- Wildfire 1/10 Low
- Heat 3/10 Moderate 7 d/yr ≥103°F today · 18 d/yr by 30 yrs out
- Wind 2/10 Low 100% chance of damaging wind over 30 yrs
- Air quality 2/10 Low 1 unhealthy d/yr today · 2 by 30 yrs out
Nearby sold comps map
Loading sold comps map…
Walkable amenities ~0.75 mi
Loading nearby amenities…
Taxation est. · year 1
- Rental income
- $17,425
- − Mortgage interest
- −$5,596
- − Property taxes
- −$1,166
- − Insurance
- −$500
- − Repairs & maintenance
- −$1,394
- − Management
- −$1,394
- − Depreciation
- −$2,906
- Taxable income
- $4,469
- Est. tax owed @ 24.0%
- −$1,073
- After-tax cash flow
- $4,741/yr
For passive investors: Depreciation is non-cash, so a rental often shows a tax loss while cash-flowing — sheltering income. Rental losses are passive: they offset passive income freely, and up to $25,000/yr can offset ordinary (W-2) income if you actively participate and your MAGI is under $100k (phasing out to $0 by $150k); unused losses carry forward. On sale, claimed depreciation is recaptured at up to 25%, and gains may owe capital-gains tax (a 1031 exchange can defer both). Figures are a year-1 estimate at your 24.0% rate — not tax advice; consult a CPA.
Schools (NCES district)
- District
- District 50 Schools
- NCES district ID
- 1741010
- Math proficiency
- 12% ▼ -2.00%
- Reading proficiency
- 11% ▼ -7.00%
- Median HH income
- $50,613
- Composite
- 10.93/100
- National rank
- #9748
- State rank
- #553 of 620 in IL
Livability — East Peoria
- Score
- 75/100
- State rank
- #209
- US rank
- #3927
Category grades
Schools grade is shown separately in the Schools card above.
Census & demographics
- Census place
- East Peoria, IL
- City population
- 23,698
- Population (ZIP)
- 24,544
Population outlook (Tazewell County) Hauer SSP2
- Today (2025)
- 131,252 people
- By 2030
- 128,028 · -2.5%
- By 2040
- 120,443 · -8.2%
- By 2050
- 111,872 · -14.8%
- By 2075
- 89,843 · -31.5%
- By 2100
- 66,468 · -49.4%
Race, ethnicity, and origin ACS 2023
- Neighborhood character
- Predominantly White (93%)
- Race & ethnicity
- White 93% Hispanic / Latino 3% Two or more races 3% Asian 1%
- Common ancestry
- Lithuanian 4% Italian 3% Iranian 2%
- Foreign-born
- 2% · Canada, China
- Languages at home
- 97% English-only · Spanish 2%
Political lean MEDSL · Tazewell
- 2024 margin
- Strong R (+26.7) · D 35.8% · R 62.5% · Other 1.8%
- 2008→2024 swing
- -20.6pp toward R · 2008: -6.0pp · 2024: -26.7pp
- All cycles
- 2024: R+26.7 2020: R+25.6 2016: R+28.5 2012: R+17.9 2008: R+6.0
Not yet ingested
- Civics
- —
Market trends
- HPI YoY
- ▼ -135.85%
- Current HPI
- 149.5627
- Rent YoY
- —
- Metro
- —
- State GDP YoY
- ▲ 1.59%
- F500 in state
- 60
Industry mix (Fortune 500 HQ in IL)
| Industry | F500 HQs | Revenue |
|---|---|---|
| Insurance | 4 | $201B |
|
||
| Consumer Goods | 4 | $87B |
|
||
| Industrial Machinery | 3 | $64B |
|
||
| Healthcare | 2 | $55B |
|
||
| Retail / Pharmacy | 1 | $148B |
|
||
| Agriculture / Food | 1 | $86B |
|
||
Price history
1 event — show timeline
- 2026-05-19 Listed $110,000 RMLSA as Distributed by MLS Grid
Property tax history
+0.0%/yrLatest (2024): $1,166 · -2.4% YoY. Source: county tax records.
Cash-flow waterfall
monthlySold comps — $/sqft
last 12 mo · ≤1 miLoading sold comps…