6800 Beach Resort Dr #2305 · Lely Resort, FL
Flood risk 8/10 · Major
- FEMA flood zone
- AE
- Chance of flooding over 30 yrs
- 0.96%
- Est. flood insurance / yr
- $1,737 – $8,500
Fire risk 4/10 · Minor
- Est. fire insurance / yr
- $947 – $1,759
Heat risk 10/10 · Severe
- Hot days now (above 108°F)
- 7 days/yr
- Hot days in 30 yrs
- 28 days/yr
Wind risk 10/10 · Severe
- Chance of severe wind over 30 yrs
- 99.0%
Air-quality risk 2/10 · Minimal
- Unhealthy air days now
- 2 days/yr
- Unhealthy air days in 30 yrs
- 2 days/yr
Risk factors via First Street. Map © Google.
Why this score? — see what drove the C grade
The composite is a weighted blend of 9 inputs, each scored 0–100. Each bar is that input's sub-score; the figure is the points it added to the 100-point composite (weight × sub-score).
- Cash flow +19.2/30.0
- ARV discount +7.5/15.0
- 1% rule +7.4/10.0
- DSCR +6.0/10.0
- Schools +5.0/10.0
- Appreciation +4.3/10.0
- Condition / age +3.8/5.0
- Rent growth +3.3/5.0
- Livability +3.1/5.0
$360,000
🖨 Deal sheet 📄 Offer letter ✓ Due diligence
Listing remarks
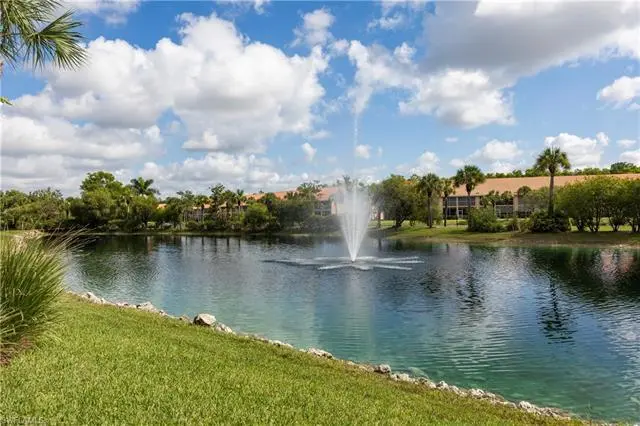
This turnkey furnished, first floor condo has serene lake and fountain views and is in a prime location in coveted Falling Waters Beach Resort. Only one building from the 600’ lazy river resort pool and close to the sport courts and other amenities. It has been lovingly maintained by the original owners. The large lanai features electric storm shutters and an outdoor kitchen. Being in Phase IV, there is no pet weight restriction. Falling Waters Beach Resort has so much to offer including tennis, pickle ball, bocce ball, a separate lap pool, social activities in the clubhouse and the ideal location is between downtown Naples and Marco Island. There are grocery stores, restaurants and s
Key facts
- Fountain views
- Tennis
- Pickle ball
Tags
Property features AI
Finance
- HOA & community: Mandatory HOA; Quarterly condo fee; Condo fee: $1,975 quarterly (total annual recurring fees listed as $7,900); One-time fees: $150; Professional management; HOA maintenance covers cable, insurance, irrigation water, lawn/land maintenance, legal/accounting, manager, exterior and interior pest control, reserves, security, sewer, street lights, street maintenance, trash removal and water; Community amenities include clubhouse, community pool, tennis, pickleball, bocce, shuffleboard, bike and jog paths, and underground utilities; Gated community
Exterior
- Parking: Detached 1-car garage; Guest parking available
- Security: Gated community; Security services included in HOA maintenance
- Utilities: Central water (assessment paid); Central sewer (assessment paid); Cable available; Electric service (central)
- Home design: Residential low-rise building (1–3), 2-story building; Built in 2001; Rear exposure facing NE; Located in Falling Waters Beach Resort
- Construction: Concrete block construction; Tile roof; Stucco finish; Built in 2001
- Exterior features: Patio; Outdoor kitchen; Stucco exterior; Tile roof; Single-hung and sliding windows; Electric shutters; Gated community; Lakefront view with landscaped areas and water feature; Paved road access; Zero lot line
Interior
- Kitchen: Dishwasher; Disposal; Microwave; Range; Refrigerator/Freezer; Outdoor kitchen (exterior)
- Bedrooms: 2 bedrooms (split bedroom floor plan)
- Flooring: Carpet; Tile
- Bathrooms: 2 full bathrooms; Master bath with dual sinks and shower (no tub)
- Heating & cooling: Central electric heat; Central electric air conditioning; Ceiling fans (6)
- Interior features: Cable prewire; Fire sprinkler system; High-speed internet available; Laundry tub; Smoke detectors; Walk-in closet(s); Window coverings; Screened lanai/porch; Turnkey furnished; Breakfast bar and eat-in kitchen / dining in living area; Auto garage door
- Laundry & utility: Washer; Dryer; Laundry in residence
Neighborhood map
What this means for you Summary
Snapshot
- This is a 2-bed/2.0-bath condo listed at $360k. Condition is rated good.
Deal economics
- At list price, monthly cash flow is $-40 ($-479/yr) — negative.
- To cash-flow at today's rent, offer at most $354k (1.6% below list).
- Meets the 1% rule at list price ($4k rent vs $360k).
- Recommended offer: $354k (1.6% below list) — sets the bar for cash-flow.
Location & tenants
- Location reads 61/100 on livability (#786 in FL) — a middle-class / working-renter tenant base. Strengths: crime A+, employment A-; Watch: health & safety D, schools F, amenities F.
- Collier (suburban): math 60% / reading 56% proficiency, ranked #16 of 73 in FL (top 22%) — acceptable for families but not a draw, mixed tenant base, ~2y average lease.
- Market conditions: Rents rising (+3.2%/yr); 900 active listings in the ZIP; 40 comparable units currently listed for rent nearby; rentals at typical pace (median 24d on market — plan ~3-4 weeks tenant-placement turnaround); solid renter incomes; 3,520 units permitted in Collier County in 2024 (959 in 5+ unit buildings).
- At $4,472/mo this rent would consume 60% of the median local household income ($89k/yr) (locally 550% of renters already pay >50% of income on rent) — very limited rent-growth headroom before tenants either downsize or default.
Forward outlook
- Local home prices are declining (-1.5%/yr); year-one equity from $2k of loan paydown is wiped out by about $5k of value loss. Plan a longer hold.
- Collier County population projected at +30% by 2050 — long-run rental-demand tailwind backs the buy-and-hold thesis.
Negotiation context
- It's been on market 15 days — a 2% lower offer ($355k) is reasonable based on typical stale-listing flexibility.
- 2 sale attempts with the ask held roughly flat each time — persistent listings suggest the price (not the market) is what's stuck; bring a comps-based counter.
Risks & watch-outs
- Watch-outs: flood insurance adds $427/mo.
- Climate carrying-cost: in FEMA flood zone AE (mandatory federal flood insurance); severe wind risk, 99% chance of damaging wind over 30y; extreme-heat days projected 7→28/yr by 2055 (HVAC capex compounding) — expect insurance premiums to compound above CPI over the hold.
Questions for the listing agent
- What do current leases actually rent for vs. the listed asking? Can we see a recent rent roll and the last 12 months of T-12 income?
- What's the actual annual flood-insurance premium (NFIP or private), and is the property in a SFHA with mandatory coverage?
- What does the HOA fee cover, when was the last increase, and are there any pending special assessments or reserve-fund shortfalls?
- Any open or pending special assessments — roof, HVAC, plumbing, elevator, façade? What's the per-unit balance and payoff schedule, and is the seller paying it off at close or rolling it to the buyer?
- Is there a deadline driving the sale (1031 exchange, divorce, estate, relocation)? That informs how much negotiation room exists.
- Schools are F-rated, which usually means shorter tenancies and higher turnover. Who's the typical renter profile here, and what's been the actual vacancy rate?
- What's the average days-on-market for RENTAL listings here right now (not sales)? A rising rental-DOM trend means longer vacancies and softer asking-rent achievability than the comps imply.
- What's the recent tenant-quality profile in this submarket — average credit score on applications, eviction rate, late-payment / NSF rate, and stable-employment percentage? A property-management company in the area should have these aggregated.
- How much new apartment / multifamily construction is in the pipeline within 1–3 miles? Heavy new supply (>2% of stock underway) typically softens rents 12–24 months out; light construction supports rent growth.
Investment metrics
- 1% rule
- 1.24% ✓
- Cap rate
- 7.58%
- Cash-on-cash
- 4.60%
- DSCR
- 1.20
- GRM
- 6.7
CMA / ARV
No comps found within radius.
Projected returns pro-forma
-1.48% appreciation · 3.21% rent growth · sell at horizon
- IRR
- -8.5%
- Equity multiple
- 0.65×
- Total profit
- $-35,709
- Equity at exit
- $78,665
- IRR
- -0.7%
- Equity multiple
- 0.94×
- Total profit
- $-5,968
- Equity at exit
- $75,776
Cash invested: $100,800 (down + closing). Projections, not guarantees.
Landlord ↔ Tenant lean methodology
- Overall (STATE)
- 87 Strongly Landlord-Friendly
- State Florida
- 87 Strongly Landlord-Friendly · R+3
- County
- — inherits STATE
- City
- — inherits STATE
ZIP-level market 34114
- Home prices YoY
- -0.6%
- Rents YoY
- 3.2%
- Active inventory
- 900
- Price-to-rent
- 6.7×
Monthly cashflow live
- Estimated rent
- $4,472 high interval (Pro) →
- Mortgage (P&I)
- −$1,888
- Tax est. 1.5%
- −$450 /mo · $5,400/yr
- Insurance
- −$150
- Flood insurance flood zone
- −$427 /mo · $5,118/yr
- HOA
- −$658
- Vacancy / Maint / Mgmt
- −$939
- Net cashflow
- $-40
Break-even live
UW: 25.0% down · 7.5% · 30yr · 1.5% tax · 5.0% vac · 8.0% maint · 8.0% mgmt
Financing live
Cash to close
- Down payment
- $90,000
- Closing costs
- $10,800
- Reserves months
- —
- Total cash needed
- —
Loan-product check · same deal, 3 products live
Conventional
25% down · 7.5% · 30yr
- Down + closing
- —
- Monthly P&I
- —
- Monthly cashflow
- —
- DSCR
- —
- Eligible?
- —
Personal DTI + credit; lowest rate.
DSCR
20% down · 8.5% · 30yr
- Down + closing
- —
- Monthly P&I
- —
- Monthly cashflow
- —
- DSCR
- —
- Eligible?
- —
No personal income docs; deal must DSCR.
Hard money
10% down · 12.0% · 12mo
- Down + closing
- —
- Monthly P&I
- —
- Monthly cashflow
- —
- DSCR
- —
- Eligible?
- —
Short-term bridge; refi at stabilization.
Rent comps 40 comps
| Address | Beds | Baths | Sqft | Rent | $/sqft | DOM | Units | Dist |
|---|---|---|---|---|---|---|---|---|
| 6590 Beach Resort Dr Unit 305 Naples, FL | 2.0 | 2.0 | 1351 | $4,500 | $3.33 | 13d | 1 | 0.12mi |
| 6650 Beach Resort Dr Unit 908 Naples, FL | 2.0 | 2.0 | 1351 | $4,600 | $3.40 | 13d | 1 | 0.14mi |
| 6750 Beach Resort Dr #7 Naples, FL | 2.0 | 2.0 | 1351 | $3,900 | $2.89 | 23d | 1 | 0.19mi |
| 6750 Beach Resort Dr Naples, FL | 2.0 | 2.0 | 1351 | $3,200 | $2.37 | 13d | 2 | 0.19mi |
| 6680 Beach Resort Dr Unit 1214 Naples, FL | 2.0 | 2.0 | 1351 | $4,500 | $3.33 | 13d | 1 | 0.28mi |
| 9175 Celeste Dr Unit 105 Naples, FL | 2.0 | 2.0 | 1000 | $2,000 | $2.00 | 23d | 1 | 0.46mi |
| 9187 Celeste Dr Unit 1073494P Naples, FL | 2.0 | 2.0 | 1399 | $2,979 | $2.13 | 13d | 1 | 0.46mi |
| 9165 Celeste Dr Unit 3-303 Naples, FL | 2.0 | 2.0 | 1000 | $6,500 | $6.50 | 23d | 1 | 0.51mi |
| 9159 Delano St #9905 Naples, FL | 3.0 | 2.0 | 1770 | $4,995 | $2.82 | 23d | 1 | 0.52mi |
| 9155 Delano St Unit 1545913P Naples, FL | 3.0 | 2.0 | 1797 | $3,871 | $2.15 | 13d | 1 | 0.53mi |
| 9151 Delano St #9702 Naples, FL | 3.0 | 2.5 | 1733 | $2,650 | $1.53 | 13d | 1 | 0.54mi |
| 7052 Live Oak Dr Naples, FL | 2.0 | 2.0 | 1685 | $9,000 | $5.34 | 23d | 1 | 0.55mi |
| 9118 Chula Vista St #12002 Naples, FL | 2.0 | 2.5 | 1531 | $4,200 | $2.74 | 23d | 1 | 0.65mi |
| 9111 Capistrano St S #8303 Naples, FL | 2.0 | 2.5 | 1432 | $7,500 | $5.24 | 23d | 1 | 0.66mi |
| 22 Cypress View Dr Unit B22 Naples, FL | 2.0 | 2.0 | 1534 | $7,000 | $4.56 | 23d | 1 | 0.68mi |
| 9115 Capistrano St S #8207 Naples, FL | 2.0 | 2.5 | 1494 | $6,000 | $4.02 | 23d | 1 | 0.68mi |
| 9109 Yuba Ln Unit 80 Naples, FL | 3.0 | 2.5 | 1729 | $3,900 | $2.26 | 23d | 1 | 0.72mi |
| 9102 Chula Vista St #11302 Naples, FL | 2.0 | 2.5 | 1531 | $2,695 | $1.76 | 21d | 1 | 0.73mi |
| 9102 Capistrano St S Unit 72-3 Naples, FL | 2.0 | 2.5 | 1520 | $6,500 | $4.28 | 23d | 1 | 0.75mi |
| 9092 Chula Vista St #11003 Naples, FL | 2.0 | 2.0 | 1404 | $6,850 | $4.88 | 23d | 1 | 0.76mi |
| 9088 Chula Vista St Unit 108-3 Naples, FL | 2.0 | 2.0 | 1404 | $5,700 | $4.06 | 23d | 1 | 0.77mi |
| 9081 Albion Ln S #6505 Naples, FL | 2.0 | 2.0 | 1225 | $7,500 | $6.12 | 23d | 1 | 0.79mi |
| 9072 Rialto St #6302 Naples, FL | 3.0 | 2.0 | 1771 | $8,250 | $4.66 | 21d | 1 | 0.83mi |
| 9076 Rialto St Unit 62 Naples, FL | 3.0 | 2.5 | 1624 | $7,500 | $4.62 | 23d | 1 | 0.84mi |
| 9071 Albion Ln N #5706 Naples, FL | 2.0 | 2.5 | 1441 | $2,200 | $1.53 | 23d | 1 | 0.85mi |
| 9066 Albion Ln N #5106 Naples, FL | 3.0 | 2.5 | 1715 | $6,500 | $3.79 | 21d | 1 | 0.85mi |
| 9073 Rialto St #6002 Naples, FL | 3.0 | 2.0 | 1771 | $7,500 | $4.23 | 23d | 1 | 0.86mi |
| 9082 Capistrano St N Unit 48-5 Naples, FL | 2.0 | 2.0 | 1227 | $6,500 | $5.30 | 23d | 1 | 0.89mi |
| 8965 Malibu Ln #802 Naples, FL | 3.0 | 2.0 | 1771 | $6,595 | $3.72 | 23d | 1 | 0.89mi |
| 274 Riverwood Rd Unit 1546056P Naples, FL | 2.0 | 2.0 | 1496 | $4,451 | $2.98 | 13d | 1 | 0.90mi |
| 1747 Beverly Dr Naples, FL | 2.0 | 2.0 | 1080 | $2,300 | $2.13 | 23d | 1 | 0.91mi |
| 8540 Mystic Greens Way #305 Naples, FL | 2.0 | 2.0 | 1710 | $4,995 | $2.92 | 13d | 1 | 0.91mi |
| 9054 Capistrano St N #4003 Naples, FL | 2.0 | 2.0 | 1385 | $2,495 | $1.80 | 23d | 1 | 0.96mi |
| 9054 Capistrano St N #4002 Naples, FL | 3.0 | 2.0 | 1674 | $6,000 | $3.58 | 23d | 1 | 0.96mi |
| 8519 Chase Preserve Dr Naples, FL | 2.0 | 2.0 | 1827 | $9,000 | $4.93 | 23d | 1 | 0.99mi |
| 9175 Michael Cir #4 Naples, FL | 3.0 | 2.0 | 1639 | $3,195 | $1.95 | 13d | 1 | 1.00mi |
| 9022 Michael Cir Unit 2-205 Naples, FL | 2.0 | 2.0 | 1450 | $3,500 | $2.41 | 23d | 1 | 1.02mi |
| 158 Rookery Rd Naples, FL | 3.0 | 2.0 | 1456 | $2,450 | $1.68 | 23d | 1 | 1.02mi |
| 8175 Celeste Dr Naples, FL | 2.0 | 2.0 | 1460 | $2,395 | $1.64 | 23d | 1 | 1.06mi |
| 8175 Celeste Dr #1230 Naples, FL | 2.0 | 2.0 | 1476 | $2,775 | $1.88 | 23d | 1 | 1.06mi |
HOA detail condo
- Monthly dues
- $658 · $7,896/yr
- Likely covers
- waterelectricpool
- Assessments
- None detected in remarks — confirm with the listing agent.
Listing history 11 events
-
2026-06-18days on market $360,000 Active 15 DOM
-
2026-06-17days on market $360,000 Active 14 DOM
-
2026-06-16days on market $360,000 Active 13 DOM
-
2026-06-15days on market $360,000 Active 12 DOM
-
2026-06-14days on market $360,000 Active 10 DOM
-
2026-06-10days on market $360,000 Active 7 DOM
-
2026-06-09days on market $360,000 Active 6 DOM
-
2026-06-08days on market $360,000 Active 5 DOM
-
2026-06-07days on market $360,000 Active 4 DOM
-
2026-06-03remarks 693-char remark
-
2026-06-03$360,000 Active 1 DOM
ⓘ Source: listings_history table (triggers on properties + properties_extension) + one-shot
backfill from property_details.listing_events for pre-trigger history.
Climate risk First Street
- Flood 8/10 Severe FEMA zone AE · 96% chance over 30 yrs
- Wildfire 4/10 Moderate
- Heat 10/10 Extreme 7 d/yr ≥108°F today · 28 d/yr by 30 yrs out
- Wind 10/10 Extreme 99% chance of damaging wind over 30 yrs
- Air quality 2/10 Low 2 unhealthy d/yr today · 2 by 30 yrs out
Nearby sold comps map
Loading sold comps map…
Walkable amenities ~0.75 mi
Loading nearby amenities…
Taxation est. · year 1
- Rental income
- $53,658
- − Mortgage interest
- −$20,166
- − Property taxes
- −$5,400
- − Insurance
- −$6,919
- − Repairs & maintenance
- −$4,293
- − Management
- −$4,293
- − HOA
- −$7,896
- − Depreciation
- −$10,473
- Taxable loss
- −$5,780
- Est. tax savings @ 24.0%
- +$1,387
- After-tax cash flow
- $908/yr
For passive investors: Depreciation is non-cash, so a rental often shows a tax loss while cash-flowing — sheltering income. Rental losses are passive: they offset passive income freely, and up to $25,000/yr can offset ordinary (W-2) income if you actively participate and your MAGI is under $100k (phasing out to $0 by $150k); unused losses carry forward. On sale, claimed depreciation is recaptured at up to 25%, and gains may owe capital-gains tax (a 1031 exchange can defer both). Figures are a year-1 estimate at your 24.0% rate — not tax advice; consult a CPA.
Condition & rehab AI · 13 photos
This turnkey furnished, first floor condo is in good condition and has serene lake and fountain views. It has been lovingly maintained by the original owners and is in a prime location in the coveted Falling Waters Beach Resort.
Value-add opportunities
- Both Painting the exterior and interior walls — Painting can enhance the curb appeal and interior aesthetics, making the property more attractive to potential buyers and renters.
- Both Updating the kitchen appliances — Upgrading the kitchen appliances can make the property more appealing to potential buyers and renters, as it can add value to the home.
- Both Landscaping improvements — Improving the landscaping can enhance the curb appeal and make the property more attractive to potential buyers and renters.
Renovation cost estimate screening
Value-add ROI direction
- Both Painting the exterior and interior walls — Painting can enhance the curb appeal and interior aesthetics, making the property more attractive to potential buyers and renters. ↑
- Both Updating the kitchen appliances — Upgrading the kitchen appliances can make the property more appealing to potential buyers and renters, as it can add value to the home. ↑
- Both Landscaping improvements — Improving the landscaping can enhance the curb appeal and make the property more attractive to potential buyers and renters. ↑
ⓘ Cost ranges are severity-bucket heuristics (US national rule-of-thumb). Get contractor quotes + a written scope before underwriting a rehab budget.
Schools (NCES district)
- District
- Collier
- NCES district ID
- 1200330
- Math proficiency
- 60% ▼ -4.00%
- Reading proficiency
- 56% ▼ -2.00%
- Median HH income
- $58,275
- Composite
- 50.23/100
- National rank
- #1892
- State rank
- #16 of 73 in FL
Livability — Lely Resort
- Score
- 61/100
- State rank
- #786
- US rank
- #17981
Category grades
Schools grade is shown separately in the Schools card above.
Census & demographics
- County
- Collier County · 396,295 people
- Metro
- Naples-Marco Island, FL
- Population (ZIP)
- 23,559
- Household income
- $89,334
- Rent vs Own
- Severe rent burden
- 550.0
Population outlook (Collier County) Hauer SSP2
- Today (2025)
- 420,858 people
- By 2030
- 450,054 · +6.9%
- By 2040
- 502,232 · +19.3%
- By 2050
- 544,932 · +29.5%
- By 2075
- 627,203 · +49.0%
- By 2100
- 659,015 · +56.6%
Race, ethnicity, and origin ACS 2023
- Neighborhood character
- Predominantly White (72%)
- Race & ethnicity
- White 72% Hispanic / Latino 17% Two or more races 13% Black 7%
- Hispanic origin (detail)
- Mexican 7% Puerto Rican 1% Cuban 3%
- Common ancestry
- Hispanic 5% Romanian 4% Lithuanian 1%
- Foreign-born
- 21% · Canada, Jamaica
- Languages at home
- 75% English-only · Spanish 15% French/Haitian/Cajun 5% Other Indo-European 4%
Political lean MEDSL · Collier
- 2024 margin
- Solid R (+33.1) · D 33.1% · R 66.2%
- 2008→2024 swing
- -10.6pp toward R · 2008: -22.5pp · 2024: -33.1pp
- All cycles
- 2024: R+33.1 2020: R+24.7 2016: R+26.0 2012: R+30.1 2008: R+22.5
Not yet ingested
- Civics
- —
Market trends
- HPI YoY
- ▼ -1.48%
- Current HPI
- 266.5545
- Rent YoY
- ▲ 3.21%
- Metro
- Naples-Marco Island, FL
- State GDP YoY
- ▲ 3.28%
- F500 in state
- 36
Industry mix (Fortune 500 HQ in FL)
| Industry | F500 HQs | Revenue |
|---|---|---|
| Industrial Technology | 2 | $29B |
|
||
| Insurance | 2 | $17B |
|
||
| Retail | 1 | $60B |
|
||
| Technology Distribution | 1 | $58B |
|
||
| Homebuilding | 1 | $35B |
|
||
| Technology Manufacturing | 1 | $35B |
|
||
Price history
-2.7% since first listed4 events — show timeline
- 2026-06-03 Listed $360,000 NAPLESMLS
- 2026-05-31 Listing Removed — NAPLESMLS
- 2025-12-04 Price Changed $360,000 NAPLESMLS
- 2025-08-14 Listed $369,999 NAPLESMLS
Cash-flow waterfall
monthlySold comps — $/sqft
last 12 mo · ≤1 miLoading sold comps…