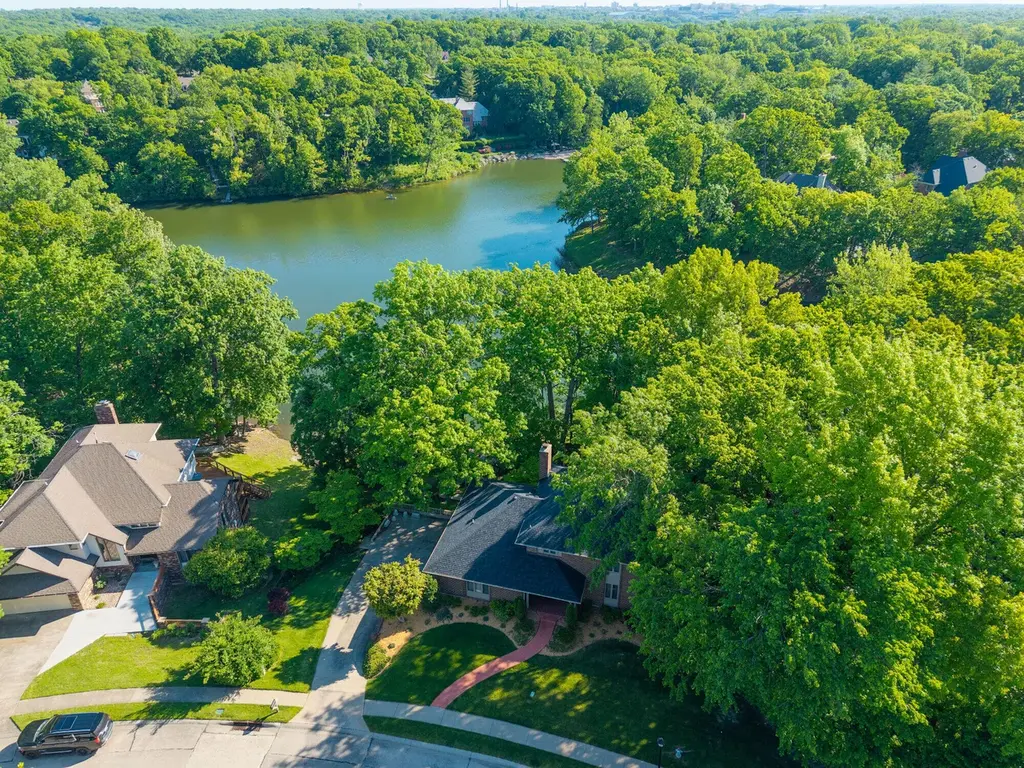
 🌊 Lakefront
3000 Shoreside Dr · Columbia, MO
Flood risk 1/10 · Minimal
- FEMA flood zone
- X (unshaded)
- Chance of flooding over 30 yrs
- 0.0%
- Est. flood insurance / yr
- $473 – $860
Fire risk 3/10 · Minor
- Est. fire insurance / yr
- $1,054 – $1,958
Heat risk 4/10 · Minor
- Hot days now (above 107°F)
- 7 days/yr
- Hot days in 30 yrs
- 19 days/yr
Wind risk 2/10 · Minimal
- Chance of severe wind over 30 yrs
- —
Air-quality risk 2/10 · Minimal
- Unhealthy air days now
- 1 days/yr
- Unhealthy air days in 30 yrs
- 1 days/yr
Risk factors via First Street. Map © Google.
Why this score? — see what drove the C+ grade
The composite is a weighted blend of 9 inputs, each scored 0–100. Each bar is that input's sub-score; the figure is the points it added to the 100-point composite (weight × sub-score).
- Cash flow +23.6/30.0
- 1% rule +10.0/10.0
- DSCR +7.6/10.0
- ARV discount +7.5/15.0
- Livability +4.2/5.0
- Rent growth +4.0/5.0
- Schools +3.1/10.0
- Condition / age +2.5/5.0
- Appreciation +0.0/10.0
$180,000
🖨 Deal sheet (PDF) 📄 Offer letter ✓ Due diligence
Listing remarks
This is an online auction. The starting bid of $180,000 does not reflect the selling price. Sells to High Bidder! No Reserve! Rare opportunity in Lake Woodrail featuring a lakefront home and adjacent vacant lot (offered separately) totaling 1.05± acres. This spacious home offers approx. 4,180± finished sq. ft. with stunning lake views, mature trees, and multiple outdoor living spaces. Features include 4 bedrooms, 3 full baths, 1 half bath, formal living and dining rooms, large family room with fireplace, granite countertops, finished walkout basement, and 3-car garage. Main-level study with full bath provides flexible living options. Multiple decks overlook the lake. New roof
Key facts
- Large family room
- Lake views
- Lakefront home
Tags
Property features AI
Finance
- HOA & community: Homeowners association with a monthly/periodic fee of $164
Exterior
- Parking: Attached garage with 3 spaces
- Utilities: Public water
- Home design: Single family residence
- Construction: Below-grade finished area present
- Exterior features: Deck; Waterfront lot on a lake; Paved road access
Interior
- Kitchen: Eat-in kitchen; Granite counters
- Bedrooms: Total rooms: 4
- Flooring: Carpet
- Bathrooms: 3 full bathrooms; 1 half bathroom
- Heating & cooling: Central air conditioning; Forced air heating
- Interior features: Eat-in kitchen; Granite counters; Gas/log or wood fireplace serving family room and kitchen; Basement with walk-out access
Neighborhood map
What this means for you Summary
Snapshot
- This is a 4-bed/3.0-bath single-family listed at $180k.
Deal economics
- At list price, monthly cash flow is $338 ($4k/yr) — positive.
- The deal already cash-flows at list — no discount required.
- Meets the 1% rule at list price ($3k rent vs $180k).
- Recommended offer: $177k (1.5% below list) — sets the bar for market timing.
- Cap rate 8.5% vs local median 2.9% in Columbia — top-decile yield for the area; either an underpriced asset or a hidden risk that comps aren't pricing in. Stress-test before assuming the spread holds.
Location & tenants
- Location reads 83/100 on livability (#9 in MO, #862 nationally) — a professional / high-income tenant draw. Strengths: amenities A+, commute A+, cost of living A+; Watch: crime D+.
- Columbia 93 (urban): math 30% / reading 43% proficiency, ranked #194 of 324 in MO (top 60%) — families likely to look elsewhere, expect single-tenant / working-renter base with shorter leases.
- Zoned schools: Russell Blvd. Elem. (math 32% / reading 47%, grade F, #537 of 1,115 statewide, top 53%, 460 students, 18% FRL); Ann Hawkins Gentry Middle (math 40% / reading 47%, grade D, #127 of 391 statewide, top 34%, 719 students, 31% FRL); Rock Bridge Sr. High (math 39% / reading 68%, grade C-, #83 of 521 statewide, top 16%, 2,032 students, 18% FRL).
- Market conditions: Rents rising fast (+6.1%/yr); 459 active listings in the ZIP; 5 comparable units currently listed for rent nearby; rentals lingering (median 46d on market — plan ~5-8 weeks vacancy on turnover, expect pricing pressure); 60% of comp listings sitting > 30 days — soft ceiling on asking rent; solid renter incomes; 1,303 units permitted in Boone County in 2024 (549 in 5+ unit buildings).
- This rent runs 41% of the median local income ($80k/yr) — at the standard rent-burdened threshold; future hikes will face affordability resistance.
Forward outlook
- Local home prices are declining (-3.0%/yr); year-one equity from $1k of loan paydown is wiped out by about $5k of value loss. Plan a longer hold.
- Boone County population projected at +36% by 2050 — long-run rental-demand tailwind backs the buy-and-hold thesis.
- At projected returns (-3.0% appreciation + 6.1% rent growth), your $50k cash investment doubles in ~9 years — after that, you're playing with house money.
Negotiation context
- It's been on market 27 days — a 2% lower offer ($177k) is reasonable based on typical stale-listing flexibility.
Risks & watch-outs
- Watch-outs: property tax is 3.0% of price.
Questions for the listing agent
- Property tax is high relative to price — has the assessment been appealed recently, and will the sale trigger a re-assessment?
- What does the HOA fee cover, when was the last increase, and are there any pending special assessments or reserve-fund shortfalls?
- Is there a deadline driving the sale (1031 exchange, divorce, estate, relocation)? That informs how much negotiation room exists.
- Schools are B-rated — typically a magnet for longer-tenancy family renters. What's the average tenant stay here, and is there a school-zone premium baked into asking?
- Crime grade is D in this area — have there been break-ins, vandalism, or insurance claims at this property in the last 3 years? What carrier currently insures it and at what premium?
- This sits on a lake — are riparian / water-frontage rights deeded with the parcel? Any dock permits, shoreline easements, or HOA water-use restrictions?
- What's the documented flood / surge / shoreline-erosion history here (FEMA AND non-FEMA — e.g., storm surge, creek backup, septic-field saturation)?
- Any water-quality or seasonal algae-bloom issues that affect tenant satisfaction or short-term-rental demand?
- What's the average days-on-market for RENTAL listings here right now (not sales)? A rising rental-DOM trend means longer vacancies and softer asking-rent achievability than the comps imply.
- What's the recent tenant-quality profile in this submarket — average credit score on applications, eviction rate, late-payment / NSF rate, and stable-employment percentage? A property-management company in the area should have these aggregated.
- How much new for-sale + rental construction is in the pipeline within 1–3 miles? Heavy new supply typically softens prices + rents 12–24 months out; constrained supply supports both.
Investment metrics
- 1% rule
- 1.52% ✓
- Cap rate
- 8.55%
- Cash-on-cash
- 8.06%
- DSCR
- 1.36
- GRM
- 5.5
CMA / ARV
- ARV (on-the-fly)
- $598,752
- Comps found
- 12
Show comp detail 12 sales within ~0.75 mi
| Address | Dist | Beds/Ba | Sqft | Sold | Price | $/sf | Match |
|---|---|---|---|---|---|---|---|
| 3113 Shoreside Dr | 0.12mi | 4/2.5 | 3,168 (0%) | 3mo | $449,900 | $142 | 90 |
| 1004 Rollingwood Dr | 0.19mi | 5/3.0 (+1) | 3,090 (-2%) | 3mo | $449,000 | $145 | 80 |
| 2403 Lynnwood Dr | 0.39mi | 4/3.0 | 3,152 (-0%) | 2mo | $475,000 | $151 | 79 |
| 1116 Northshore Dr | 0.14mi | 4/4.0 | 3,304 (+4%) | 7mo | $415,000 | $126 | 76 |
| 3405 Woodrail Ter | 0.43mi | 4/3.5 | 3,380 (+7%) | 2mo | $445,000 | $132 | 66 |
| 2615 Burrwood Dr | 0.27mi | 4/3.0 | 2,750 (-13%) | 3mo | $349,900 | $127 | 63 |
| 1316 Torrey Pines Dr | 0.59mi | 4/3.0 | 2,990 (-6%) | 8mo | $405,000 | $135 | 56 |
| 1308 Vintage Dr | 0.67mi | 3/3.0 (-1) | 3,082 (-3%) | 5mo | $385,000 | $125 | 56 |
| 2503 Lynnwood Dr | 0.36mi | 4/3.0 | 2,729 (-14%) | 10mo | $362,000 | $133 | 52 |
| 3505 Godfrey Dr | 0.57mi | 4/3.0 | 2,762 (-13%) | 4mo | $449,900 | $163 | 48 |
| 2512 Cimarron Dr | 0.55mi | 5/3.0 (+1) | 3,466 (+9%) | 10mo | $485,000 | $140 | 45 |
| 1419 Torrey Pines Dr | 0.70mi | 4/4.0 | 3,560 (+12%) | 10mo | $529,000 | $149 | 34 |
Match score weights: distance 35% · size 25% · config 20% · recency 20%. Top-matched comps best support the ARV.
Projected returns pro-forma
-3.0% appreciation · 6.09% rent growth · sell at horizon
- IRR
- 0.8%
- Equity multiple
- 1.03×
- Total profit
- $1,522
- Equity at exit
- $26,839
- IRR
- 14.2%
- Equity multiple
- 2.37×
- Total profit
- $68,913
- Equity at exit
- $15,563
Cash invested: $50,400 (down + closing). Projections, not guarantees.
Landlord ↔ Tenant lean methodology
- Overall (STATE)
- 81 Strongly Landlord-Friendly
- State Missouri
- 81 Strongly Landlord-Friendly · R+10
- County
- — inherits STATE
- City
- — inherits STATE
ZIP-level market 65203
- Rents YoY
- 6.1%
- Active inventory
- 459
- Price-to-rent
- 5.5×
Monthly cashflow live
- Estimated rent
- $2,728 high interval (Pro) →
- Mortgage (P&I)
- −$944
- Tax from tax record
- −$453 /mo · $5,437/yr
- Insurance
- −$75
- HOA
- −$345
- Vacancy / Maint / Mgmt
- −$573
- Net cashflow
- $338
Break-even live
Sensitivity live
| Price | -10% $440 | -5% $389 | +0% $338 | +5% $287 | +10% $236 |
|---|---|---|---|---|---|
| Rent | -10% $123 | -5% $231 | +0% $338 | +5% $446 | +10% $554 |
| Rate | -1.0pp $429 | -0.5pp $384 | base $338 | +0.5pp $292 | +1.0pp $244 |
UW: 25.0% down · 7.5% · 30yr · 1.5% tax · 5.0% vac · 8.0% maint · 8.0% mgmt
Financing live
Cash to close
- Down payment
- $45,000
- Closing costs
- $5,400
- Reserves months
- —
- Total cash needed
- —
Loan-product check · same deal, 3 products live
Conventional
25% down · 7.5% · 30yr
- Down + closing
- —
- Monthly P&I
- —
- Monthly cashflow
- —
- DSCR
- —
- Eligible?
- —
Personal DTI + credit; lowest rate.
DSCR
20% down · 8.5% · 30yr
- Down + closing
- —
- Monthly P&I
- —
- Monthly cashflow
- —
- DSCR
- —
- Eligible?
- —
No personal income docs; deal must DSCR.
Hard money
10% down · 12.0% · 12mo
- Down + closing
- —
- Monthly P&I
- —
- Monthly cashflow
- —
- DSCR
- —
- Eligible?
- —
Short-term bridge; refi at stabilization.
Rent comps 5 comps
| Address | Beds | Baths | Sqft | Rent | $/sqft | DOM | Units | Dist |
|---|---|---|---|---|---|---|---|---|
| 3104 Oak Lawn Dr Columbia, MO | 4.0 | 3.5 | 2476 | $3,500 | $1.41 | 45d | 1 | 0.25mi |
| 3006 Lynnwood Dr Columbia, MO | 5.0 | 3.0 | 2250 | $2,400 | $1.07 | 23d | 1 | 0.38mi |
| 3405 Woodrail Ter Unit 3405 Columbia, MO | 4.0 | 3.5 | 3380 | $3,250 | $0.96 | 15d | 1 | 0.45mi |
| 201-203 Briarcrest Ct Columbia, MO | 4.0 | 3.5 | 2947 | $2,300 | $0.78 | 45d | 1 | 0.86mi |
| 1008 Royal Birkdale Dr Columbia, MO | 4.0 | 2.5 | 2265 | $2,450 | $1.08 | 45d | 1 | 1.16mi |
HOA detail
- Monthly dues
- $345 · $4,140/yr
Listing history 14 events
-
2026-06-16days on market $180,000 Active 27 DOM
-
2026-06-15days on market $180,000 Active 26 DOM
-
2026-06-14days on market $180,000 Active 24 DOM
-
2026-06-13days on market $180,000 Active 23 DOM
-
2026-06-10days on market $180,000 Active 21 DOM
-
2026-06-09days on market $180,000 Active 20 DOM
-
2026-06-08days on market $180,000 Active 19 DOM
-
2026-06-07days on market $180,000 Active 18 DOM
-
2026-06-05days on market $180,000 Active 15 DOM
-
2026-06-03days on market $180,000 Active 14 DOM
-
2026-06-02days on market $180,000 Active 13 DOM
-
2026-05-31days on market $180,000 Active 11 DOM
-
2026-05-30days on market $180,000 Active 10 DOM
-
2026-05-20$180,000 Active
ⓘ Source: listings_history table (triggers on properties + properties_extension) + one-shot
backfill from property_details.listing_events for pre-trigger history.
Tax reassessment forecast MO · Resets to sale price
- Current annual tax
- $5,437 · $453/mo
- Projected year-2 tax
- $5,437 · $453/mo
- Expected delta
- $0/yr ($0/mo · 0.0%)
ⓘ Screening estimate from a state-policy table — verify with the county assessor before closing.
Climate risk First Street
- Flood 1/10 Low FEMA zone X (unshaded) · 0% chance over 30 yrs
- Wildfire 3/10 Moderate
- Heat 4/10 Moderate 7 d/yr ≥107°F today · 19 d/yr by 30 yrs out
- Wind 2/10 Low
- Air quality 2/10 Low 1 unhealthy d/yr today · 1 by 30 yrs out
Nearby sold comps map
Loading sold comps map…
Walkable amenities ~0.75 mi
Loading nearby amenities…
Taxation est. · year 1
- Rental income
- $32,741
- − Mortgage interest
- −$10,083
- − Property taxes
- −$5,437
- − Insurance
- −$900
- − Repairs & maintenance
- −$2,619
- − Management
- −$2,619
- − HOA
- −$4,140
- − Depreciation
- −$5,236
- Taxable income
- $1,706
- Est. tax owed @ 24.0%
- −$409
- After-tax cash flow
- $3,651/yr
For passive investors: Depreciation is non-cash, so a rental often shows a tax loss while cash-flowing — sheltering income. Rental losses are passive: they offset passive income freely, and up to $25,000/yr can offset ordinary (W-2) income if you actively participate and your MAGI is under $100k (phasing out to $0 by $150k); unused losses carry forward. On sale, claimed depreciation is recaptured at up to 25%, and gains may owe capital-gains tax (a 1031 exchange can defer both). Figures are a year-1 estimate at your 24.0% rate — not tax advice; consult a CPA.
Schools (NCES district)
- District
- Columbia 93
- NCES district ID
- 2901000
- Math proficiency
- 30% ▼ -12.00%
- Reading proficiency
- 43% ▼ -4.00%
- Median HH income
- $46,547
- Composite
- 31.21/100
- National rank
- #6036
- State rank
- #194 of 324 in MO
Livability — Columbia
- Score
- 83/100
- State rank
- #9
- US rank
- #862
Category grades
Schools grade is shown separately in the Schools card above.
Census & demographics
- Census place
- Columbia, MO
- County
- Boone County · 158,877 people
- City population
- 158,877
- Metro
- Columbia, MO
- Population (ZIP)
- 61,539
- Household income
- $79,960
- Rent vs Own
- Severe rent burden
- 1991.0
Population outlook (Boone County) Hauer SSP2
- Today (2025)
- 202,891 people
- By 2030
- 217,799 · +7.3%
- By 2040
- 246,789 · +21.6%
- By 2050
- 276,116 · +36.1%
- By 2075
- 348,426 · +71.7%
- By 2100
- 400,856 · +97.6%
Race, ethnicity, and origin ACS 2023
- Neighborhood character
- Predominantly White (77%)
- Race & ethnicity
- White 77% Black 9% Asian 6% Two or more races 5% Hispanic / Latino 3%
- Common ancestry
- Italian 3% Slovak 2% Romanian 2%
- Foreign-born
- 7% · China, South Korea, Canada
- Languages at home
- 91% English-only · Chinese 2% Spanish 2% Korean 1%
Political lean MEDSL · Boone
- 2024 margin
- Lean D (+9.8) · D 53.9% · R 44.1% · Other 2.1%
- 2008→2024 swing
- -2.2pp toward R · 2008: 12.0pp · 2024: 9.8pp
- All cycles
- 2024: D+9.8 2020: D+12.5 2016: D+5.9 2012: D+3.1 2008: D+12.0
Not yet ingested
- Civics
- —
Market trends
- HPI YoY
- ▼ -274.18%
- Current HPI
- 194.3615
- Rent YoY
- ▲ 6.09%
- Metro
- Columbia, MO
- State GDP YoY
- ▲ 1.84%
- F500 in state
- 20
Industry mix (Fortune 500 HQ in MO)
| Industry | F500 HQs | Revenue |
|---|---|---|
| Healthcare | 1 | $163B |
|
||
| Insurance | 1 | $21B |
|
||
| Industrial Technology | 1 | $17B |
|
||
| Retail | 1 | $16B |
|
||
| Industrial Distribution | 1 | $10B |
|
||
| Utilities | 1 | $9B |
|
||
Price history
1 event — show timeline
- 2026-05-20 Listed $180,000 CBORMLS
Property tax history
+3.1%/yrLatest (2025): $5,437 · +11.1% YoY. Source: county tax records.
Cash-flow waterfall
monthlySold comps — $/sqft
last 12 mo · ≤1 miLoading sold comps…