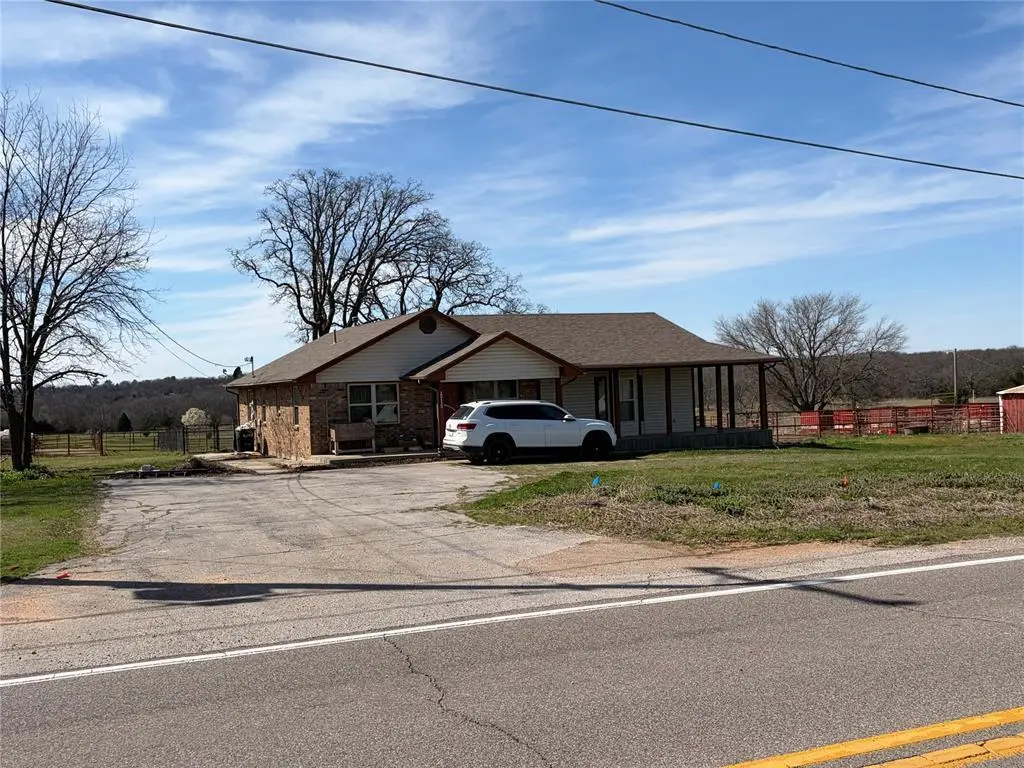
20420 Valley View Rd · Earlsboro, OK
Flood risk 1/10 · Minimal
- FEMA flood zone
- X (unshaded)
- Chance of flooding over 30 yrs
- 0.0%
- Est. flood insurance / yr
- $507 – $1,088
Fire risk 9/10 · Severe
- Est. fire insurance / yr
- $2,463 – $4,575
Heat risk 5/10 · Moderate
- Hot days now (above 110°F)
- 7 days/yr
- Hot days in 30 yrs
- 19 days/yr
Wind risk 3/10 · Minor
- Chance of severe wind over 30 yrs
- 7.0%
Air-quality risk 2/10 · Minimal
- Unhealthy air days now
- 1 days/yr
- Unhealthy air days in 30 yrs
- 1 days/yr
Risk factors via First Street. Map © Google.
Why this score? — see what drove the B+ grade
The composite is a weighted blend of 9 inputs, each scored 0–100. Each bar is that input's sub-score; the figure is the points it added to the 100-point composite (weight × sub-score).
- Cash flow +30.0/30.0
- 1% rule +10.0/10.0
- DSCR +10.0/10.0
- Appreciation +8.7/10.0
- ARV discount +7.5/15.0
- Livability +3.4/5.0
- Rent growth +2.5/5.0
- Condition / age +2.5/5.0
- Schools +1.3/10.0
$60,000
🖨 Deal sheet (PDF) 📄 Offer letter ✓ Due diligence
Listing remarks MLS
Looking for your HOME ON THE RANGE?! Nice brick house outside of City Limits with lovely acreage. Just the perfect mix of trees, pasture and ponds is what you'll get when you purchase this one. This property has several building sites plus a 30' x 40' barn and estensive metal pipe pens and fencing for all your livestock. The owner has remodeled the 4 bedroom, 2 bath house with a new roof, paint, texture, light fixtures and flooring. The kitchen is open to the dining area and comes complete with stove, dishwasher, pantry and a serving/prep island with breakfast bar counter. There is plenty of space in the utility room nearby. The dining room opens to the large living room and is great for entertaining with all it's natural lighting. The primary bedroom is in the back of the home for privacy and has gorgeous views of the land, pond and pecan trees. Sit on the front wrap-around porch and enjoy your favorite beverage. There is plenty of guest parking, invite them over for a drink. Convenient location for commuters with highway access.
Key facts
- 9.13 acre lot
- Built 1980
Neighborhood map
What this means for you Summary
Snapshot
- This is a 3-bed/2.0-bath single-family listed at $60k.
Deal economics
- At list price, monthly cash flow is $403 ($5k/yr) — positive.
- The deal already cash-flows at list — no discount required.
- Meets the 1% rule at list price ($1k rent vs $60k).
Location & tenants
- Location reads 67/100 on livability (#81 in OK) — a middle-class / working-renter tenant base. Strengths: cost of living A+, housing A+, crime A-; Watch: amenities F, commute F, employment D-.
- Earlsboro (rural): math 6% / reading 15% proficiency, ranked #490 of 513 in OK (top 96%) — low school quality limits family demand, transient renter base, plan for 1-2y turnover; 72% free/reduced lunch — lower-income household profile, screen leases tightly.
- Zoned schools: Earlsboro Es (math 8% / reading 2%, grade F, #766 of 845 statewide, top 94%, 178 students, 0% FRL); Earlsboro Hs (math 10% / reading 10%, grade F, #361 of 447 statewide, top 94%, 85 students, 0% FRL) — zoned schools average 0% FRL vs 72% district-wide (72 pts lower); this property's tenant base skews higher-income than the district average.
- Market conditions: 24 active listings in the ZIP; 183 units permitted in Pottawatomie County in 2024 (16 in 5+ unit buildings).
Forward outlook
- In year one you build about $5k of equity ($415 loan paydown + $4k appreciation (7.4% local appreciation)).
- Pottawatomie County population projected at +12% by 2050 — modest demand growth; plan on rents tracking national, not racing it.
- At projected returns (7.4% appreciation + 3.0% rent growth), your $17k cash investment doubles in ~2 years — after that, you're playing with house money.
- By year 7, paydown + projected appreciation supports a ~$33k cash-out refi (75% LTV) — recoverable capital for the next deal without selling this one.
Negotiation context
- Only 0 days on market — expect competitive offers; lowballing is unlikely to land.
- 5 sale attempts since 3y ago with the ask held roughly flat each time — persistent listings suggest the price (not the market) is what's stuck; bring a comps-based counter.
Risks & watch-outs
- Watch-outs: property tax is 4.4% of price.
- Climate carrying-cost: severe wildfire risk; extreme-heat days projected 7→19/yr by 2055 (HVAC capex compounding) — expect insurance premiums to compound above CPI over the hold.
Questions for the listing agent
- Property tax is high relative to price — has the assessment been appealed recently, and will the sale trigger a re-assessment?
- Is there a deadline driving the sale (1031 exchange, divorce, estate, relocation)? That informs how much negotiation room exists.
- Schools are F-rated, which usually means shorter tenancies and higher turnover. Who's the typical renter profile here, and what's been the actual vacancy rate?
- What's the average days-on-market for RENTAL listings here right now (not sales)? A rising rental-DOM trend means longer vacancies and softer asking-rent achievability than the comps imply.
- What's the recent tenant-quality profile in this submarket — average credit score on applications, eviction rate, late-payment / NSF rate, and stable-employment percentage? A property-management company in the area should have these aggregated.
- How much new for-sale + rental construction is in the pipeline within 1–3 miles? Heavy new supply typically softens prices + rents 12–24 months out; constrained supply supports both.
Investment metrics
- 1% rule
- 2.03% ✓
- Cap rate
- 14.35%
- Cash-on-cash
- 28.77%
- DSCR
- 2.28
- GRM
- 4.1
CMA / ARV
- ARV (on-the-fly)
- $245,072
- Comps found
- 1
Show comp detail 1 sale within ~0.75 mi
| Address | Dist | Beds/Ba | Sqft | Sold | Price | $/sf | Match |
|---|---|---|---|---|---|---|---|
| 20420 Valley View Rd | 0.00mi | 4/2.0 (+1) | 1,802 (0%) | 22mo | $245,000 | $136 | 76 |
Match score weights: distance 35% · size 25% · config 20% · recency 20%. Top-matched comps best support the ARV.
Projected returns pro-forma
7.39% appreciation · 3.0% rent growth · sell at horizon
- IRR
- 42.1%
- Equity multiple
- 3.87×
- Total profit
- $48,175
- Equity at exit
- $43,137
- IRR
- 38.1%
- Equity multiple
- 8.20×
- Total profit
- $120,940
- Equity at exit
- $83,392
Cash invested: $16,800 (down + closing). Projections, not guarantees.
Landlord ↔ Tenant lean methodology
- Overall (STATE)
- 83 Strongly Landlord-Friendly
- State Oklahoma
- 83 Strongly Landlord-Friendly · R+20
- County
- — inherits STATE
- City
- — inherits STATE
ZIP-level market 74840
- Home prices YoY
- 2.1%
- Active inventory
- 24
- Price-to-rent
- 4.1×
Monthly cashflow live
- Estimated rent
- $1,217 medium interval (Pro) →
- Mortgage (P&I)
- −$315
- Tax from tax record
- −$219 /mo · $2,632/yr
- Insurance
- −$25
- HOA
- −$0
- Vacancy / Maint / Mgmt
- −$256
- Net cashflow
- $403
Break-even live
Sensitivity live
| Price | -10% $437 | -5% $420 | +0% $403 | +5% $386 | +10% $369 |
|---|---|---|---|---|---|
| Rent | -10% $307 | -5% $355 | +0% $403 | +5% $451 | +10% $499 |
| Rate | -1.0pp $433 | -0.5pp $418 | base $403 | +0.5pp $387 | +1.0pp $371 |
UW: 25.0% down · 7.5% · 30yr · 1.5% tax · 5.0% vac · 8.0% maint · 8.0% mgmt
Financing live
Cash to close
- Down payment
- $15,000
- Closing costs
- $1,800
- Reserves months
- —
- Total cash needed
- —
Loan-product check · same deal, 3 products live
Conventional
25% down · 7.5% · 30yr
- Down + closing
- —
- Monthly P&I
- —
- Monthly cashflow
- —
- DSCR
- —
- Eligible?
- —
Personal DTI + credit; lowest rate.
DSCR
20% down · 8.5% · 30yr
- Down + closing
- —
- Monthly P&I
- —
- Monthly cashflow
- —
- DSCR
- —
- Eligible?
- —
No personal income docs; deal must DSCR.
Hard money
10% down · 12.0% · 12mo
- Down + closing
- —
- Monthly P&I
- —
- Monthly cashflow
- —
- DSCR
- —
- Eligible?
- —
Short-term bridge; refi at stabilization.
Listing history 2 events
-
2026-06-12remarks 683-char remark
-
2026-06-12$60,000 Pending
ⓘ Source: listings_history table (triggers on properties + properties_extension) + one-shot
backfill from property_details.listing_events for pre-trigger history.
Tax reassessment forecast OK · Resets to sale price
- Current annual tax
- $2,632 · $219/mo
- Projected year-2 tax
- $2,632 · $219/mo
- Expected delta
- $0/yr ($0/mo · 0.0%)
ⓘ Screening estimate from a state-policy table — verify with the county assessor before closing.
Climate risk First Street
- Flood 1/10 Low FEMA zone X (unshaded) · 0% chance over 30 yrs
- Wildfire 9/10 Extreme
- Heat 5/10 Major 7 d/yr ≥110°F today · 19 d/yr by 30 yrs out
- Wind 3/10 Moderate 7% chance of damaging wind over 30 yrs
- Air quality 2/10 Low 1 unhealthy d/yr today · 1 by 30 yrs out
Nearby sold comps map
Loading sold comps map…
Walkable amenities ~0.75 mi
Loading nearby amenities…
Taxation est. · year 1
- Rental income
- $14,608
- − Mortgage interest
- −$3,361
- − Property taxes
- −$2,632
- − Insurance
- −$300
- − Repairs & maintenance
- −$1,169
- − Management
- −$1,169
- − Depreciation
- −$1,745
- Taxable income
- $4,233
- Est. tax owed @ 24.0%
- −$1,016
- After-tax cash flow
- $3,817/yr
For passive investors: Depreciation is non-cash, so a rental often shows a tax loss while cash-flowing — sheltering income. Rental losses are passive: they offset passive income freely, and up to $25,000/yr can offset ordinary (W-2) income if you actively participate and your MAGI is under $100k (phasing out to $0 by $150k); unused losses carry forward. On sale, claimed depreciation is recaptured at up to 25%, and gains may owe capital-gains tax (a 1031 exchange can defer both). Figures are a year-1 estimate at your 24.0% rate — not tax advice; consult a CPA.
Schools (NCES district)
- District
- Earlsboro
- NCES district ID
- 4010500
- Math proficiency
- 6% ▬ 0.00%
- Reading proficiency
- 15% ▼ -5.00%
- Median HH income
- $44,796
- Composite
- 13.16/100
- National rank
- #14513
- State rank
- #490 of 513 in OK
Livability — Earlsboro
- Score
- 67/100
- State rank
- #81
- US rank
- #10182
Category grades
Schools grade is shown separately in the Schools card above.
Census & demographics
- Population (ZIP)
- 1,993
Population outlook (Pottawatomie County) Hauer SSP2
- Today (2025)
- 76,622 people
- By 2030
- 78,816 · +2.9%
- By 2040
- 82,766 · +8.0%
- By 2050
- 86,031 · +12.3%
- By 2075
- 93,316 · +21.8%
- By 2100
- 95,820 · +25.1%
Race, ethnicity, and origin ACS 2023
- Neighborhood character
- Predominantly White (67%)
- Race & ethnicity
- White 67% Native American 20% Two or more races 6% Hispanic / Latino 5% Black 2%
- Hispanic origin (detail)
- Mexican 4%
- Common ancestry
- Slovak 1% Lithuanian 1% Romanian 1%
- Foreign-born
- 0% · Canada
- Languages at home
- 98% English-only · Spanish 1% German/W. Germanic 1%
Political lean MEDSL · Pottawatomie
- 2024 margin
- Solid R (+47.4) · D 25.2% · R 72.7% · Other 2.1%
- 2008→2024 swing
- -9.1pp toward R · 2008: -38.4pp · 2024: -47.4pp
- All cycles
- 2024: R+47.4 2020: R+46.0 2016: R+46.5 2012: R+38.7 2008: R+38.4
Not yet ingested
- Civics
- —
Market trends
- HPI YoY
- ▲ 7.39%
- Current HPI
- 365.2182
- Rent YoY
- —
- Metro
- —
- State GDP YoY
- ▲ 1.55%
- F500 in state
- 6
Industry mix (Fortune 500 HQ in OK)
| Industry | F500 HQs | Revenue |
|---|---|---|
| Energy | 3 | $48B |
|
||
Price history
-89.1% since first listed14 events — show timeline
- 2026-06-10 Listed $60,000 MLSOK
- 2026-06-10 Listing Removed — MLSOK
- 2026-04-25 Listing Removed — MLSOK
- 2026-04-18 Price Changed $60,000 MLSOK
- 2026-03-31 Price Changed $75,000 MLSOK
- 2026-03-17 Price Changed $85,000 MLSOK
- 2026-03-16 Listed $2 MLSOK
- 2024-08-16 Sold (MLS) $245,000 MLSOK
- 2024-07-18 Pending — MLSOK
- 2024-07-11 Listed $255,000 MLSOK
- 2024-07-05 Listing Removed — MLSOK
- 2024-07-01 Listing Removed — MLSOK
- 2024-01-10 Listed $235,000 MLSOK
- 2023-09-14 Listed $550,000 MLSOK
Cash-flow waterfall
monthlySold comps — $/sqft
last 12 mo · ≤1 miLoading sold comps…