 Multi-family
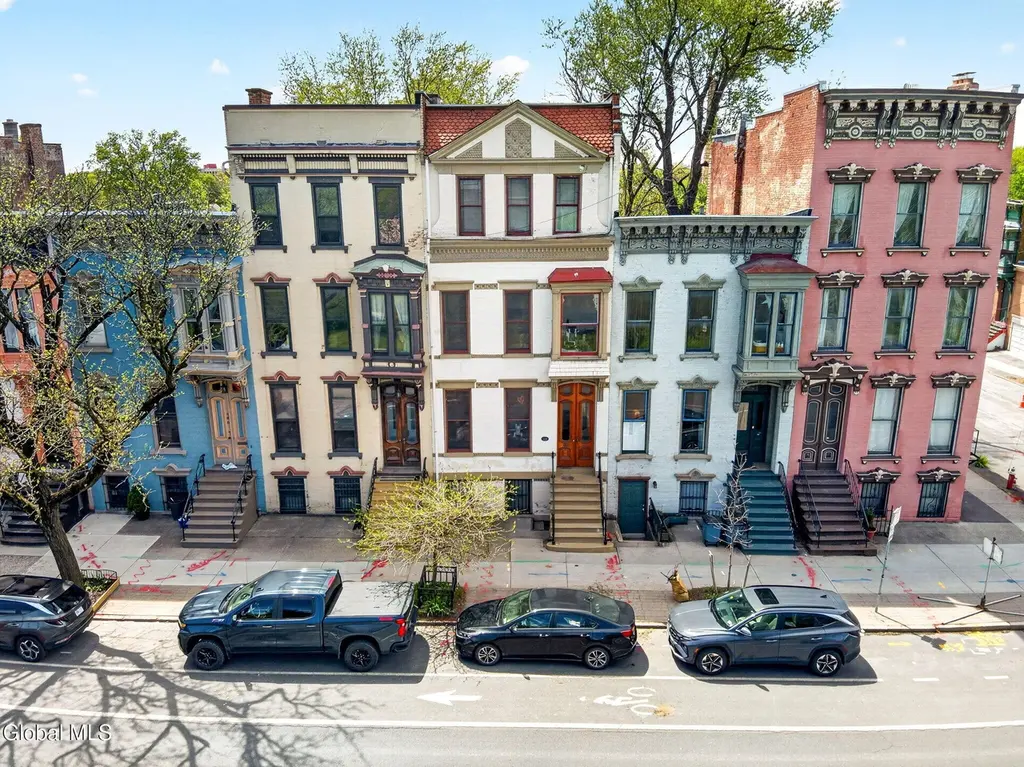
490 Madison Ave · Albany, NY
Flood risk 1/10 · Minimal
- FEMA flood zone
- X (unshaded)
- Chance of flooding over 30 yrs
- 0.0%
- Est. flood insurance / yr
- $473 – $860
Fire risk 1/10 · Minimal
- Est. fire insurance / yr
- $691 – $1,283
Heat risk 4/10 · Minor
- Hot days now (above 97°F)
- 7 days/yr
- Hot days in 30 yrs
- 16 days/yr
Wind risk 3/10 · Minor
- Chance of severe wind over 30 yrs
- 6.0%
Air-quality risk 1/10 · Minimal
- Unhealthy air days now
- 0 days/yr
- Unhealthy air days in 30 yrs
- 0 days/yr
Risk factors via First Street. Map © Google.
Why this score? — see what drove the C- grade
The composite is a weighted blend of 9 inputs, each scored 0–100. Each bar is that input's sub-score; the figure is the points it added to the 100-point composite (weight × sub-score).
- Cash flow +15.9/30.0
- ARV discount +15.0/15.0
- DSCR +4.9/10.0
- 1% rule +4.5/10.0
- Livability +4.0/5.0
- Rent growth +3.8/5.0
- Schools +3.2/10.0
- Condition / age +2.5/5.0
- Appreciation +0.0/10.0
$649,000
🖨 Deal sheet 📄 Offer letter ✓ Due diligence
Multi-family units
County records classify this as Multi-Family (5+ Unit). Listing-text estimate: 1 unit. estimate disagrees with records
5+ unit building — per-unit beds/baths from public records are typically unavailable; the breakdown below (if shown) is an estimate from the listing text.
Listing remarks MLS
This Beautiful brick building had a complete face lift in 2008 with additional updates to the roof drain and exterior entrance in 2011 and 2012. The 3 story building faces Washington Park in Center Square Albany -- Excellent Condition
Key facts
- 5,662 sq ft lot
- Built 1875
- Listed 12 days
Property features AI
Finance
- Financial info: Four total units
Exterior
- Utilities: Public water; Public sewer
- Home design: Quadruplex; Below-grade finished area present
- Construction: Brick construction
- Exterior features: Wood fencing; Fenced yard
Interior
- Bedrooms: Four 1-bedroom units (each unit listed as 1 bedroom)
- Bathrooms: Four full bathrooms (one per unit)
- Heating & cooling: Natural gas heating; Cooling present (type listed as Other)
- Interior features: Basement unit apartment
Neighborhood map
What this means for you Summary
Snapshot
- This is a 4-bed/4.0-bath multifamily listed at $649k.
Deal economics
- At list price, monthly cash flow is $307 ($4k/yr) — positive.
- The deal already cash-flows at list — no discount required.
- To meet the 1% rule (rent ≥ 1% of price), the offer needs to be $617k (5.0% below list).
- Recommended offer: $617k (5.0% below list) — sets the bar for 1% rule.
Location & tenants
- Location reads 79/100 on livability (#129 in NY, #2,083 nationally) — a middle-class / working-renter tenant base. Strengths: amenities A+, commute A+, housing A+; Watch: employment C-, crime F.
- Albany City School District (urban): math 37% / reading 40% proficiency, ranked #543 of 590 in NY (top 92%) — families likely to look elsewhere, expect single-tenant / working-renter base with shorter leases; 66% free/reduced lunch — lower-income household profile, screen leases tightly.
- Zoned schools: Albany High School (math 74% / reading 67%, grade B+, #710 of 1,100 statewide, top 65%, 2,676 students, 69% FRL) — zoned schools at 69% FRL track the district average.
- Zoned-school proficiency averages 70% at this address vs 38% district-wide (+32 pts) — the actual schools serving this property are materially stronger than the Albany City School District average implies; a family-tenant draw the district grade alone would hide.
- Market conditions: Rents rising fast (+5.0%/yr); 99 active listings in the ZIP; 2 comparable units currently listed for rent nearby; 675 units permitted in Albany County in 2024 (451 in 5+ unit buildings).
- At $6,168/mo this rent would consume 105% of the median local household income ($70k/yr) (locally 1952% of renters already pay >50% of income on rent) — very limited rent-growth headroom before tenants either downsize or default.
Forward outlook
- Local home prices are declining (-3.0%/yr); year-one equity from $4k of loan paydown is wiped out by about $19k of value loss. Plan a longer hold.
- Albany County population projected at +9% by 2050 — modest demand growth; plan on rents tracking national, not racing it.
Negotiation context
- Only 12 days on market — expect competitive offers; lowballing is unlikely to land.
- 7 sale attempts since 24y ago with the ask held roughly flat each time — persistent listings suggest the price (not the market) is what's stuck; bring a comps-based counter.
- Current owner paid $365k; list at $649k implies a 78% gain — meaningful room to come down on a strong offer.
Risks & watch-outs
- Watch-outs: built in 1875 — expect roof / HVAC / electrical / plumbing capex.
Questions for the listing agent
- Built in 1875 — when were the roof, HVAC, electrical panel, plumbing, and water heater last replaced?
- Is there a deadline driving the sale (1031 exchange, divorce, estate, relocation)? That informs how much negotiation room exists.
- Crime grade is F in this area — have there been break-ins, vandalism, or insurance claims at this property in the last 3 years? What carrier currently insures it and at what premium?
- What's the average days-on-market for RENTAL listings here right now (not sales)? A rising rental-DOM trend means longer vacancies and softer asking-rent achievability than the comps imply.
- What's the recent tenant-quality profile in this submarket — average credit score on applications, eviction rate, late-payment / NSF rate, and stable-employment percentage? A property-management company in the area should have these aggregated.
- How much new apartment / multifamily construction is in the pipeline within 1–3 miles? Heavy new supply (>2% of stock underway) typically softens rents 12–24 months out; light construction supports rent growth.
Investment metrics
- 1% rule
- 0.95% ✗
- Cap rate
- 6.86%
- Cash-on-cash
- 2.03%
- DSCR
- 1.09
- GRM
- 8.8
CMA / ARV
- ARV (median comp)
- $819,956
- List price
- $649,000
- Delta
- -20.85%
- Verdict
- UNDERPRICED
- Comps
- 20 within 1.0 mi
Show comp detail 6 sales within ~0.75 mi
| Address | Dist | Beds/Ba | Sqft | Sold | Price | $/sf | Match |
|---|---|---|---|---|---|---|---|
| 136 Lancaster St | 0.39mi | 4/4.0 | 4,234 (+7%) | 19mo | $415,000 | $98 | 55 |
| 335 Madison Ave | 0.38mi | 4/3.5 | 3,372 (-15%) | 3mo | $240,000 | $71 | 53 |
| 368 Madison Ave | 0.28mi | 4/3.0 | 4,422 (+12%) | 13mo | $515,000 | $116 | 52 |
| 121 Dove St | 0.26mi | 5/4.0 (+1) | 4,296 (+8%) | 24mo | $435,000 | $101 | 49 |
| 66 Elm St | 0.71mi | 4/3.5 | 4,048 (+2%) | 16mo | $525,000 | $130 | 48 |
| 58 Elm St | 0.72mi | 5/3.0 (+1) | 4,368 (+10%) | 2mo | $352,650 | $81 | 38 |
Match score weights: distance 35% · size 25% · config 20% · recency 20%. Top-matched comps best support the ARV.
Projected returns pro-forma
-3.0% appreciation · 5.05% rent growth · sell at horizon
- IRR
- -10.7%
- Equity multiple
- 0.60×
- Total profit
- $-72,501
- Equity at exit
- $96,768
- IRR
- 1.3%
- Equity multiple
- 1.10×
- Total profit
- $18,162
- Equity at exit
- $56,114
Cash invested: $181,720 (down + closing). Projections, not guarantees.
Landlord ↔ Tenant lean methodology
- Overall (STATE)
- 15 Strongly Tenant-Friendly
- State New York
- 15 Strongly Tenant-Friendly · D+10
- County
- — inherits STATE
- City
- — inherits STATE
ZIP-level market 12208
- Home prices YoY
- -30.1%
- Rents YoY
- 5.0%
- Active inventory
- 99
- Price-to-rent
- 35.1×
Monthly cashflow live
- Estimated rent
- $6,168 high interval (Pro) →
- Mortgage (P&I)
- −$3,403
- Tax from tax record
- −$892 /mo · $10,705/yr
- Insurance
- −$270
- HOA
- −$0
- Vacancy / Maint / Mgmt
- −$1,295
- Net cashflow
- $307
Break-even live
4-unit breakdown (identical units grouped — click to expand)
| Units | Beds | Baths | Est. rent |
|---|---|---|---|
| 4× units | 1 | 1 | $6,168 |
| #1 | 1 | 1 | $1,542 |
| #2 | 1 | 1 | $1,542 |
| #3 | 1 | 1 | $1,542 |
| #4 | 1 | 1 | $1,542 |
| Total (4 units) | $6,168 | ||
UW: 25.0% down · 7.5% · 30yr · 1.5% tax · 5.0% vac · 8.0% maint · 8.0% mgmt
Financing live
Cash to close
- Down payment
- $162,250
- Closing costs
- $19,470
- Reserves months
- —
- Total cash needed
- —
Loan-product check · same deal, 3 products live
Conventional
25% down · 7.5% · 30yr
- Down + closing
- —
- Monthly P&I
- —
- Monthly cashflow
- —
- DSCR
- —
- Eligible?
- —
Personal DTI + credit; lowest rate.
DSCR
20% down · 8.5% · 30yr
- Down + closing
- —
- Monthly P&I
- —
- Monthly cashflow
- —
- DSCR
- —
- Eligible?
- —
No personal income docs; deal must DSCR.
Hard money
10% down · 12.0% · 12mo
- Down + closing
- —
- Monthly P&I
- —
- Monthly cashflow
- —
- DSCR
- —
- Eligible?
- —
Short-term bridge; refi at stabilization.
Rent comps 2 comps
| Address | Beds | Baths | Sqft | Rent | $/sqft | DOM | Units | Dist |
|---|---|---|---|---|---|---|---|---|
| 32 Peyster St Unit 1st floor Albany, NY | 3.0 | 2.0 | 2714 | $2,500 | $0.92 | 44d | 1 | 1.19mi |
| 57 S Main Ave Albany, NY | 4.0 | 1.0 | 2695 | $1,600 | $0.59 | 44d | 1 | 1.28mi |
Listing history 16 events
-
2026-05-16status Pending 192-char remark
-
2026-05-04$649,000 Active 192-char remark
-
2013-08-27soldstatus $365,000 234-char remark
Show marketing remark (234 chars)
This Beautiful brick building had a complete face lift in 2008 with additional updates to the roof drain and exterior entrance in 2011 and 2012. The 3 story building faces Washington Park in Center Square Albany -- Excellent Condition
-
2013-05-02historical 234-char remark
Show marketing remark (234 chars)
This Beautiful brick building had a complete face lift in 2008 with additional updates to the roof drain and exterior entrance in 2011 and 2012. The 3 story building faces Washington Park in Center Square Albany -- Excellent Condition
-
2012-12-15$409,900 234-char remark
Show marketing remark (234 chars)
This Beautiful brick building had a complete face lift in 2008 with additional updates to the roof drain and exterior entrance in 2011 and 2012. The 3 story building faces Washington Park in Center Square Albany -- Excellent Condition
-
2012-11-12historical
-
2012-05-11$429,900
-
2011-07-21historical
-
2011-03-30$429,000
-
2011-03-30historical
-
2010-10-05$439,000
-
2010-09-28historical
-
2009-11-25$459,900
-
2002-10-08soldstatus $147,500
-
2002-09-04historical
-
2002-08-15$147,500
ⓘ Source: listings_history table (triggers on properties + properties_extension) + one-shot
backfill from property_details.listing_events for pre-trigger history.
Tax reassessment forecast NY · Partial reset (capped growth)
- Current annual tax
- $10,705 · $892/mo
- Projected year-2 tax
- $10,837 · $903/mo
- Expected delta
- +$132/yr (+$11/mo · 1.2%)
ⓘ Screening estimate from a state-policy table — verify with the county assessor before closing.
Climate risk First Street
- Flood 1/10 Low FEMA zone X (unshaded) · 0% chance over 30 yrs
- Wildfire 1/10 Low
- Heat 4/10 Moderate 7 d/yr ≥97°F today · 16 d/yr by 30 yrs out
- Wind 3/10 Moderate 6% chance of damaging wind over 30 yrs
- Air quality 1/10 Low 0 unhealthy d/yr today · 0 by 30 yrs out
Nearby sold comps map
Loading sold comps map…
Walkable amenities ~0.75 mi
Loading nearby amenities…
Taxation est. · year 1
- Rental income
- $74,016
- − Mortgage interest
- −$36,354
- − Property taxes
- −$10,705
- − Insurance
- −$3,245
- − Repairs & maintenance
- −$5,921
- − Management
- −$5,921
- − Depreciation
- −$18,880
- Taxable loss
- −$7,011
- Est. tax savings @ 24.0%
- +$1,683
- After-tax cash flow
- $5,364/yr
For passive investors: Depreciation is non-cash, so a rental often shows a tax loss while cash-flowing — sheltering income. Rental losses are passive: they offset passive income freely, and up to $25,000/yr can offset ordinary (W-2) income if you actively participate and your MAGI is under $100k (phasing out to $0 by $150k); unused losses carry forward. On sale, claimed depreciation is recaptured at up to 25%, and gains may owe capital-gains tax (a 1031 exchange can defer both). Figures are a year-1 estimate at your 24.0% rate — not tax advice; consult a CPA.
Schools (NCES district)
- District
- Albany City School District
- NCES district ID
- 3602460
- Math proficiency
- 37% ▲ 6.00%
- Reading proficiency
- 40% ▲ 7.00%
- Median HH income
- $40,568
- Composite
- 32.34/100
- National rank
- #5744
- State rank
- #543 of 590 in NY
Livability — Albany
- Score
- 79/100
- State rank
- #129
- US rank
- #2083
Category grades
Schools grade is shown separately in the Schools card above.
Census & demographics
- Census place
- Albany, NY
- County
- Albany County · 196,626 people
- City population
- 116,921
- Metro
- Albany-Schenectady-Troy, NY
- Population (ZIP)
- 23,289
- Household income
- $70,413
- Rent vs Own
- Severe rent burden
- 1952.0
Population outlook (Albany County) Hauer SSP2
- Today (2025)
- 320,794 people
- By 2030
- 327,401 · +2.1%
- By 2040
- 338,218 · +5.4%
- By 2050
- 348,467 · +8.6%
- By 2075
- 381,693 · +19.0%
- By 2100
- 393,809 · +22.8%
Race, ethnicity, and origin ACS 2023
- Neighborhood character
- Predominantly White (66%)
- Race & ethnicity
- White 66% Black 12% Asian 10% Hispanic / Latino 7% Two or more races 7%
- Hispanic origin (detail)
- Puerto Rican 3%
- Common ancestry
- Romanian 5% Italian 3% Scotch-Irish 3%
- Foreign-born
- 16% · Canada, China, Philippines
- Languages at home
- 83% English-only · Other Indo-European 4% Other Asian/Pacific 3% French/Haitian/Cajun 2%
Political lean MEDSL · Albany
- 2024 margin
- Strong D (+25.8) · D 62.9% · R 37.1%
- 2008→2024 swing
- -3.6pp toward R · 2008: 29.4pp · 2024: 25.8pp
- All cycles
- 2024: D+25.8 2020: D+31.4 2016: D+24.3 2012: D+31.0 2008: D+29.4
Not yet ingested
- Civics
- —
Market trends
- HPI YoY
- ▼ -120.46%
- Current HPI
- 279.716
- Rent YoY
- ▲ 5.05%
- Metro
- Albany-Schenectady-Troy, NY
- State GDP YoY
- ▲ 2.60%
- F500 in state
- 92
Industry mix (Fortune 500 HQ in NY)
| Industry | F500 HQs | Revenue |
|---|---|---|
| Financial Services | 10 | $950B |
|
||
| Consumer Goods | 9 | $162B |
|
||
| Insurance | 4 | $225B |
|
||
| Telecommunications | 2 | $144B |
|
||
| Pharmaceuticals | 2 | $112B |
|
||
| Media / Entertainment | 2 | $69B |
|
||
Price history
+340.0% since first listed16 events — show timeline
- 2026-05-16 Pending — Global MLS
- 2026-05-04 Listed $649,000 Global MLS
- 2013-08-27 Sold (MLS) $365,000 Global MLS
- 2013-05-02 Listing Removed — Global MLS
- 2012-12-15 Listed $409,900 Global MLS
- 2012-11-12 Listing Removed — Global MLS
- 2012-05-11 Listed $429,900 Global MLS
- 2011-07-21 Listing Removed — Global MLS
- 2011-03-30 Listing Removed — Global MLS
- 2011-03-30 Listed $429,000 Global MLS
- 2010-10-05 Listed $439,000 Global MLS
- 2010-09-28 Listing Removed — Global MLS
- 2009-11-25 Listed $459,900 Global MLS
- 2002-10-08 Sold (MLS) $147,500 Global MLS
- 2002-09-04 Listing Removed — Global MLS
- 2002-08-15 Listed $147,500 Global MLS
Property tax history
+3.1%/yrLatest (2025): $10,705 · +8.2% YoY. Source: county tax records.
Cash-flow waterfall
monthlySold comps — $/sqft
last 12 mo · ≤1 miLoading sold comps…