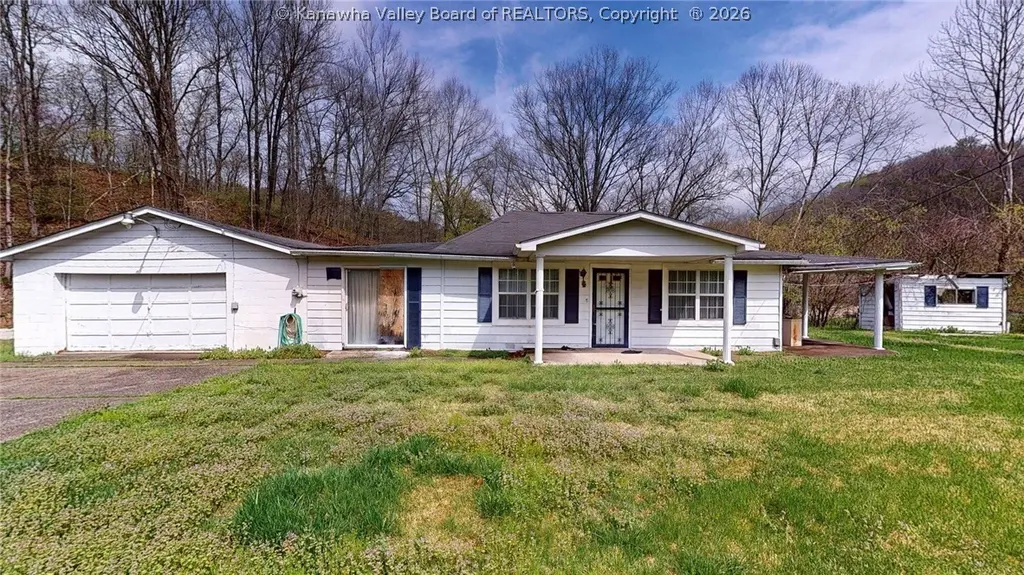
2008 Bear Creek Rd · Salt Rock, WV
Flood risk 10/10 · Severe
- FEMA flood zone
- X (unshaded)
- Chance of flooding over 30 yrs
- 0.99%
- Est. flood insurance / yr
- $507 – $1,088
Fire risk 6/10 · Moderate
- Est. fire insurance / yr
- $787 – $1,461
Heat risk 5/10 · Moderate
- Hot days now (above 101°F)
- 7 days/yr
- Hot days in 30 yrs
- 20 days/yr
Wind risk 2/10 · Minimal
- Chance of severe wind over 30 yrs
- 1.0%
Air-quality risk 1/10 · Minimal
- Unhealthy air days now
- 0 days/yr
- Unhealthy air days in 30 yrs
- 0 days/yr
Risk factors via First Street. Map © Google.
Why this score? — see what drove the B- grade
The composite is a weighted blend of 9 inputs, each scored 0–100. Each bar is that input's sub-score; the figure is the points it added to the 100-point composite (weight × sub-score).
- Cash flow +30.0/30.0
- 1% rule +10.0/10.0
- DSCR +10.0/10.0
- ARV discount +7.5/15.0
- Livability +2.7/5.0
- Rent growth +2.5/5.0
- Schools +1.8/10.0
- Condition / age +1.5/5.0
- Appreciation +1.3/10.0
$64,500
🖨 Deal sheet 📄 Offer letter ✓ Due diligence
Listing remarks MLS
Numerous possibilities await! This approximately 1.5 acre property offers incredible potential. It features an older 3 bedroom home with a 2 car attached garage that would be customized to your needs with a full renovation or as a starting point to build your dream home from the ground up. Public water is available. The home is being sold "as is" with no repairs to be made by the seller. Priced to sell and ready for your vision. Don't miss this opportunity!
Key facts
- 1.5 acre lot
- 2 garage spots
- Built 1905
Property features AI
Exterior
- Parking: Attached 2-car garage
- Utilities: Public water
- Home design: Single-family residence; One story
- Construction: Aluminum siding; Composition shingle roof
- Exterior features: Porch
Interior
- Bathrooms: 1 full bathroom
- Heating & cooling: Forced air heating
- Interior features: 7 total rooms; No basement
Neighborhood map
What this means for you Summary
Snapshot
- This is a 3-bed/1.0-bath single-family listed at $64k. Condition is rated poor.
Deal economics
- At list price, monthly cash flow is $364 ($4k/yr) — positive.
- The deal already cash-flows at list — no discount required.
- Meets the 1% rule at list price ($1k rent vs $64k).
- Recommended offer: $61k (6.0% below list) — sets the bar for market timing.
Location & tenants
- Location reads 53/100 on livability (#304 in WV) — a working-class tenant base; expect higher turnover. Strengths: cost of living A+, crime A; Watch: employment D+, amenities F, commute F.
- Lincoln County Schools (rural): math 17% / reading 28% proficiency, ranked #54 of 55 in WV (top 98%) — low school quality limits family demand, transient renter base, plan for 1-2y turnover.
- Zoned schools: West Hamlin Elementary (math 12% / reading 17%, grade F, #370 of 377 statewide, top 99%, 435 students, 0% FRL); Guyan Valley Middle (math 9% / reading 28%, grade F, #107 of 109 statewide, top 98%, 235 students, 0% FRL); Lincoln County High School (math 12% / reading 42%, grade F, #79 of 110 statewide, top 78%, 852 students, 0% FRL) — zoned schools average 0% FRL vs 55% district-wide (55 pts lower); this property's tenant base skews higher-income than the district average.
- Market conditions: 7 active listings in the ZIP; 12 units permitted in Lincoln County in 2024 (0 in 5+ unit buildings).
Forward outlook
- Local home prices are declining (-3.0%/yr); year-one equity from $446 of loan paydown is wiped out by about $2k of value loss. Plan a longer hold.
- Lincoln County population projected at -23% by 2050 — secular population decline; favor cash flow + early exit over multi-decade hold.
- At projected returns (-3.0% appreciation + 3.0% rent growth), your $18k cash investment doubles in ~6 years — after that, you're playing with house money.
Negotiation context
- It's been on market 73 days — a 6% lower offer ($61k) is reasonable based on typical stale-listing flexibility.
- 4 sale attempts with the ask held roughly flat each time — persistent listings suggest the price (not the market) is what's stuck; bring a comps-based counter.
Risks & watch-outs
- Watch-outs: flood insurance adds $66/mo; built in 1905 — expect roof / HVAC / electrical / plumbing capex.
- Climate carrying-cost: severe flood risk; major wildfire risk; extreme-heat days projected 7→20/yr by 2055 (HVAC capex compounding) — expect insurance premiums to compound above CPI over the hold.
Questions for the listing agent
- It's been on market 73 days. Have you received any prior offers? Is the seller open to a 6% concession, seller financing, or rate buy-down credit?
- Have any recent inspections been done? Can we get a copy of the seller's disclosures and any deferred-maintenance estimates?
- Built in 1905 — when were the roof, HVAC, electrical panel, plumbing, and water heater last replaced?
- What's the actual annual flood-insurance premium (NFIP or private), and is the property in a SFHA with mandatory coverage?
- Why hasn't it sold? Are there any deal-killer items the seller is aware of (foundation, flood, title, zoning, code violations)?
- Is there a deadline driving the sale (1031 exchange, divorce, estate, relocation)? That informs how much negotiation room exists.
- Schools are F-rated, which usually means shorter tenancies and higher turnover. Who's the typical renter profile here, and what's been the actual vacancy rate?
- What's the average days-on-market for RENTAL listings here right now (not sales)? A rising rental-DOM trend means longer vacancies and softer asking-rent achievability than the comps imply.
- What's the recent tenant-quality profile in this submarket — average credit score on applications, eviction rate, late-payment / NSF rate, and stable-employment percentage? A property-management company in the area should have these aggregated.
- How much new for-sale + rental construction is in the pipeline within 1–3 miles? Heavy new supply typically softens prices + rents 12–24 months out; constrained supply supports both.
Investment metrics
- 1% rule
- 1.72% ✓
- Cap rate
- 14.30%
- Cash-on-cash
- 28.59%
- DSCR
- 2.27
- GRM
- 4.8
CMA / ARV
No comps found within radius.
Projected returns pro-forma
-3.0% appreciation · 3.0% rent growth · sell at horizon
- IRR
- 17.5%
- Equity multiple
- 1.71×
- Total profit
- $12,781
- Equity at exit
- $9,617
- IRR
- 26.0%
- Equity multiple
- 3.28×
- Total profit
- $41,206
- Equity at exit
- $5,577
Cash invested: $18,060 (down + closing). Projections, not guarantees.
Landlord ↔ Tenant lean methodology
- Overall (STATE)
- 83 Strongly Landlord-Friendly
- State West Virginia
- 83 Strongly Landlord-Friendly · R+22
- County
- — inherits STATE
- City
- — inherits STATE
ZIP-level market 25571
- Home prices YoY
- -6.4%
- Active inventory
- 7
- Price-to-rent
- 4.8×
Monthly cashflow live
- Estimated rent
- $1,109 medium interval (Pro) →
- Mortgage (P&I)
- −$338
- Tax est. 1.5%
- −$81 /mo · $968/yr
- Insurance
- −$27
- Flood insurance flood zone
- −$66 /mo · $798/yr
- HOA
- −$0
- Vacancy / Maint / Mgmt
- −$233
- Net cashflow
- $364
Break-even live
UW: 25.0% down · 7.5% · 30yr · 1.5% tax · 5.0% vac · 8.0% maint · 8.0% mgmt
Financing live
Cash to close
- Down payment
- $16,125
- Closing costs
- $1,935
- Reserves months
- —
- Total cash needed
- —
Loan-product check · same deal, 3 products live
Conventional
25% down · 7.5% · 30yr
- Down + closing
- —
- Monthly P&I
- —
- Monthly cashflow
- —
- DSCR
- —
- Eligible?
- —
Personal DTI + credit; lowest rate.
DSCR
20% down · 8.5% · 30yr
- Down + closing
- —
- Monthly P&I
- —
- Monthly cashflow
- —
- DSCR
- —
- Eligible?
- —
No personal income docs; deal must DSCR.
Hard money
10% down · 12.0% · 12mo
- Down + closing
- —
- Monthly P&I
- —
- Monthly cashflow
- —
- DSCR
- —
- Eligible?
- —
Short-term bridge; refi at stabilization.
Listing history 21 events
-
2026-06-19days on market $64,500 Active 73 DOM
-
2026-06-18days on market $64,500 Active 72 DOM
-
2026-06-17days on market $64,500 Active 71 DOM
-
2026-06-16days on market $64,500 Active 70 DOM
-
2026-06-15days on market $64,500 Active 69 DOM
-
2026-06-14days on market $64,500 Active 67 DOM
-
2026-06-12days on market $64,500 Active 66 DOM
-
2026-06-09days on market $64,500 Active 63 DOM
-
2026-06-08days on market $64,500 Active 62 DOM
-
2026-06-07days on market $64,500 Active 61 DOM
-
2026-06-02days on market $64,500 Active 56 DOM
-
2026-06-01days on market $64,500 Active 55 DOM
-
2026-05-31days on market $64,500 Active 54 DOM
-
2026-05-30days on market $64,500 Active 53 DOM
-
2026-04-07$64,500 Active
-
2026-04-02$64,500 Active 472-char remark
Show marketing remark (472 chars)
Numerous possibilities await! This approximately 1.5 acre property offers incredible potential. It features an older 3 bedroom home with a 2 car attached garage that would be customized to your needs with a full renovation or as a starting point to build your dream home from the ground up. Public water is available. The home is being sold "as is" with no repairs to be made by the seller. Priced to sell and ready for your vision. Don't miss this opportunity!
-
2025-12-15price $69,900
-
2025-10-16price $72,500
-
2025-06-09status Active
-
2025-05-08status Pending
-
2025-04-09$79,900 Active
ⓘ Source: listings_history table (triggers on properties + properties_extension) + one-shot
backfill from property_details.listing_events for pre-trigger history.
Climate risk First Street
- Flood 10/10 Extreme FEMA zone X (unshaded) · 99% chance over 30 yrs
- Wildfire 6/10 Major
- Heat 5/10 Major 7 d/yr ≥101°F today · 20 d/yr by 30 yrs out
- Wind 2/10 Low 100% chance of damaging wind over 30 yrs
- Air quality 1/10 Low 0 unhealthy d/yr today · 0 by 30 yrs out
Nearby sold comps map
Loading sold comps map…
Walkable amenities ~0.75 mi
Loading nearby amenities…
Taxation est. · year 1
- Rental income
- $13,308
- − Mortgage interest
- −$3,613
- − Property taxes
- −$968
- − Insurance
- −$1,120
- − Repairs & maintenance
- −$1,065
- − Management
- −$1,065
- − Depreciation
- −$1,876
- Taxable income
- $3,601
- Est. tax owed @ 24.0%
- −$864
- After-tax cash flow
- $3,502/yr
For passive investors: Depreciation is non-cash, so a rental often shows a tax loss while cash-flowing — sheltering income. Rental losses are passive: they offset passive income freely, and up to $25,000/yr can offset ordinary (W-2) income if you actively participate and your MAGI is under $100k (phasing out to $0 by $150k); unused losses carry forward. On sale, claimed depreciation is recaptured at up to 25%, and gains may owe capital-gains tax (a 1031 exchange can defer both). Figures are a year-1 estimate at your 24.0% rate — not tax advice; consult a CPA.
Condition & rehab AI · 12 photos
This property requires extensive renovation to improve its condition and increase its value. A full renovation of the kitchen and bathroom, along with updates to the exterior and HVAC system, would significantly enhance its resale and rental value.
Repairs flagged
- Major kitchen cabinets — severely dated and worn
- Major bathroom fixtures — outdated and worn
- Major roof — visible wear and tear
- Major exterior siding — peeling paint and damage
- Major flooring — dated and worn carpet
- Major interior walls — dated paneling and peeling paint
- Major windows — old, possibly single-pane windows
- Major HVAC system — old, possibly inefficient system
Value-add opportunities
- Resale kitchen renovation — modern kitchen increases appeal
- Resale bathroom renovation — modern bathroom enhances appeal
- Resale exterior siding and paint — new siding and paint improves curb appeal
- Both HVAC system — modern HVAC system improves comfort and energy efficiency
- Both landscaping — landscaping enhances curb appeal and property value
Renovation cost estimate screening
| Repair item | Severity | Est. cost |
|---|---|---|
| kitchen cabinets · severely dated and worn | Major | $15,000–50,000 |
| bathroom fixtures · outdated and worn | Major | $15,000–50,000 |
| roof · visible wear and tear | Major | $15,000–50,000 |
| exterior siding · peeling paint and damage | Major | $15,000–50,000 |
| flooring · dated and worn carpet | Major | $15,000–50,000 |
| interior walls · dated paneling and peeling paint | Major | $15,000–50,000 |
| windows · old, possibly single-pane windows | Major | $15,000–50,000 |
| HVAC system · old, possibly inefficient system | Major | $15,000–50,000 |
| Total estimated repair cost · 8 items | $120,000–400,000 |
Value-add ROI direction
- Resale kitchen renovation — modern kitchen increases appeal ↑
- Resale bathroom renovation — modern bathroom enhances appeal ↑
- Resale exterior siding and paint — new siding and paint improves curb appeal ↑
- Both HVAC system — modern HVAC system improves comfort and energy efficiency ↑
- Both landscaping — landscaping enhances curb appeal and property value ↑
ⓘ Cost ranges are severity-bucket heuristics (US national rule-of-thumb). Get contractor quotes + a written scope before underwriting a rehab budget.
Schools (NCES district)
- District
- Lincoln County Schools
- NCES district ID
- 5400660
- Math proficiency
- 17% ▼ -10.00%
- Reading proficiency
- 28% ▼ -10.00%
- Median HH income
- $34,693
- Composite
- 18.48/100
- National rank
- #8925
- State rank
- #54 of 55 in WV
Livability — Salt Rock
- Score
- 53/100
- State rank
- #304
- US rank
- #24515
Category grades
Schools grade is shown separately in the Schools card above.
Census & demographics
- City population
- 1,501
- Population (ZIP)
- 1,874
Population outlook (Lincoln County) Hauer SSP2
- Today (2025)
- 20,193 people
- By 2030
- 19,294 · -4.5%
- By 2040
- 17,358 · -14.0%
- By 2050
- 15,464 · -23.4%
- By 2075
- 11,491 · -43.1%
- By 2100
- 8,039 · -60.2%
Race, ethnicity, and origin ACS 2023
- Neighborhood character
- Predominantly White (98%)
- Race & ethnicity
- White 98% Two or more races 1%
- Common ancestry
- Slovak 5% Serbian 2% Italian 1%
- Foreign-born
- 0%
Political lean MEDSL · Lincoln
- 2024 margin
- Solid R (+62.5) · D 17.8% · R 80.3% · Other 1.9%
- 2008→2024 swing
- -53.6pp toward R · 2008: -8.9pp · 2024: -62.5pp
- All cycles
- 2024: R+62.5 2020: R+54.9 2016: R+54.7 2012: R+31.6 2008: R+8.9
Not yet ingested
- Civics
- —
Market trends
- HPI YoY
- ▼ -7.35%
- Current HPI
- 107.2878
- Rent YoY
- —
- Metro
- —
- State GDP YoY
- —
- F500 in state
- 0
Price history
-19.3% since first listed7 events — show timeline
- 2026-04-07 Listed $64,500 KVBOR
- 2026-04-02 Listed $64,500 HBRMLS
- 2025-12-15 Price Changed $69,900 KVBOR
- 2025-10-16 Price Changed $72,500 KVBOR
- 2025-06-09 Relisted — KVBOR
- 2025-05-08 Pending — KVBOR
- 2025-04-09 Listed $79,900 KVBOR
Cash-flow waterfall
monthlySold comps — $/sqft
last 12 mo · ≤1 miLoading sold comps…