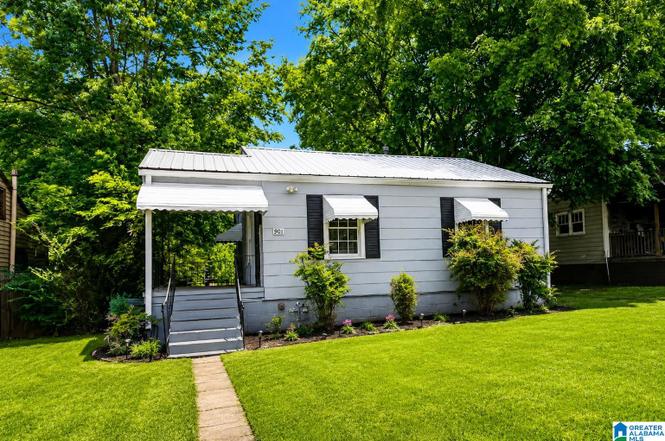
901 47th St N · Birmingham, AL
Flood risk 1/10 · Minimal
- FEMA flood zone
- X (unshaded)
- Chance of flooding over 30 yrs
- 0.0%
- Est. flood insurance / yr
- $507 – $1,088
Fire risk 1/10 · Minimal
- Est. fire insurance / yr
- $916 – $1,700
Heat risk 6/10 · Moderate
- Hot days now (above 106°F)
- 7 days/yr
- Hot days in 30 yrs
- 19 days/yr
Wind risk 6/10 · Moderate
- Chance of severe wind over 30 yrs
- 27.0%
Air-quality risk 4/10 · Minor
- Unhealthy air days now
- 6 days/yr
- Unhealthy air days in 30 yrs
- 8 days/yr
Risk factors via First Street. Map © Google.
Why this score? — see what drove the C- grade
The composite is a weighted blend of 9 inputs, each scored 0–100. Each bar is that input's sub-score; the figure is the points it added to the 100-point composite (weight × sub-score).
- Cash flow +21.9/30.0
- ARV discount +7.5/15.0
- DSCR +7.0/10.0
- 1% rule +4.4/10.0
- Livability +3.4/5.0
- Rent growth +2.5/5.0
- Condition / age +2.5/5.0
- Schools +0.9/10.0
- Appreciation +0.0/10.0
$100,000
🖨 Deal sheet 📄 Offer letter ✓ Due diligence
Listing remarks MLS
AMAZING INVESTMENT OPPORTUNITY!!! Come and see this move-in ready home that has recently been updated with NEW FLOORS, NEW SHOWER, NEW PAINT and NEW FURNACE! 2 bedrooms with 1 full bath. Walk through the front door into the den area which leads into the kitchen. Tucked in the back are two more bedrooms and a full bath. Lastly is the laundry room with space for storage. Out back you will find a one car garage. This property is located just over 1 mile from the Shuttlesworth International Airport, 3 miles from the center of downtown Birmingham, Top Golf, Brand new $164 Million Protective Stadium, $60M Amazon fulfillment center, and so much more. The Woodlawn neighbor is exploding with opportunity between newer home developments and the brand new Church of the Highlands campus in the area. This is a one of a kind opportunity that you don't want to miss!
Key facts
- Renovated shower
- Detached garage
- 7,840 sq ft lot
Tags
Property features AI
Finance
- Other: Parcel ID available
- Financial info: No financial details provided
- HOA & community: No subdivision listed
Exterior
- Parking: Driveway parking
- Security: No security features listed
- Utilities: Public water; Connected sewer; Electric water heater; Internet service availability
- Home design: Single-story layout (all main-level rooms listed); Existing (previously built) structure
- Construction: Vinyl siding; Crawl space foundation
- Exterior features: No pool, patio, deck, or garden/patio listed; Not waterfront
Interior
- Kitchen: Laminate countertops
- Bedrooms: Master bedroom on main level; Additional bedroom on main level
- Flooring: Hardwood and hardwood laminate flooring
- Bathrooms: One full bathroom with tub/shower combo on main level
- Heating & cooling: Central heating; Window air conditioning units
- Interior features: Smooth ceilings; No additional interior features listed
- Laundry & utility: Main-level laundry with washer hookup and electric dryer hookup; Has laundry
Neighborhood map
What this means for you Summary
Snapshot
- This is a 2-bed/1.0-bath single-family listed at $100k.
Deal economics
- At list price, monthly cash flow is $157 ($2k/yr) — positive.
- The deal already cash-flows at list — no discount required.
- To meet the 1% rule (rent ≥ 1% of price), the offer needs to be $94k (5.7% below list).
- Recommended offer: $94k (5.7% below list) — sets the bar for 1% rule.
- Cap rate 8.2% vs local median 6.2% in Birmingham — top-decile yield for the area; either an underpriced asset or a hidden risk that comps aren't pricing in. Stress-test before assuming the spread holds.
Location & tenants
- Location reads 67/100 on livability (#78 in AL) — a middle-class / working-renter tenant base. Strengths: commute A+, cost of living A+, housing A+; Watch: amenities C-, crime F, employment F.
- Birmingham City (urban): math 4% / reading 20% proficiency, ranked #116 of 129 in AL (top 90%) — low school quality limits family demand, transient renter base, plan for 1-2y turnover; 82% free/reduced lunch — lower-income household profile, screen leases tightly.
- Zoned schools: Hayes K8 (math 0% / reading 12%, grade F, #616 of 627 statewide, top 98%, 658 students, 91% FRL); Woodlawn High Schoolmagnet (math 2% / reading 2%, grade F, #291 of 305 statewide, top 100%, 738 students, 91% FRL).
- Market conditions: 81 active listings in the ZIP; 15 comparable units currently listed for rent nearby; rentals lingering (median 44d on market — plan ~5-8 weeks vacancy on turnover, expect pricing pressure); 60% of comp listings sitting > 30 days — soft ceiling on asking rent; lower-income renter base — watch delinquency; 2,114 units permitted in Jefferson County in 2024 (556 in 5+ unit buildings).
- This rent runs 31% of the median local income ($37k/yr) — at the standard rent-burdened threshold; future hikes will face affordability resistance.
Forward outlook
- Local home prices are declining (-3.0%/yr); year-one equity from $691 of loan paydown is wiped out by about $3k of value loss. Plan a longer hold.
- Jefferson County population projected to shrink 4% by 2050 — rents likely to lag national; underwrite the cash flow, not the appreciation.
Negotiation context
- Only 8 days on market — expect competitive offers; lowballing is unlikely to land.
- 4 sale attempts since 3y ago with the ask held roughly flat each time — persistent listings suggest the price (not the market) is what's stuck; bring a comps-based counter.
- Current owner paid $56k; list at $100k implies a 77% gain — meaningful room to come down on a strong offer.
Risks & watch-outs
- Watch-outs: built in 1950 — expect roof / HVAC / electrical / plumbing capex.
- Climate carrying-cost: major wind risk, 27% chance of damaging wind over 30y; extreme-heat days projected 7→19/yr by 2055 (HVAC capex compounding) — expect insurance premiums to compound above CPI over the hold.
Questions for the listing agent
- Built in 1950 — when were the roof, HVAC, electrical panel, plumbing, and water heater last replaced?
- Is there a deadline driving the sale (1031 exchange, divorce, estate, relocation)? That informs how much negotiation room exists.
- Schools are F-rated, which usually means shorter tenancies and higher turnover. Who's the typical renter profile here, and what's been the actual vacancy rate?
- Crime grade is F in this area — have there been break-ins, vandalism, or insurance claims at this property in the last 3 years? What carrier currently insures it and at what premium?
- What's the average days-on-market for RENTAL listings here right now (not sales)? A rising rental-DOM trend means longer vacancies and softer asking-rent achievability than the comps imply.
- What's the recent tenant-quality profile in this submarket — average credit score on applications, eviction rate, late-payment / NSF rate, and stable-employment percentage? A property-management company in the area should have these aggregated.
- How much new for-sale + rental construction is in the pipeline within 1–3 miles? Heavy new supply typically softens prices + rents 12–24 months out; constrained supply supports both.
Investment metrics
- 1% rule
- 0.94% ✗
- Cap rate
- 8.17%
- Cash-on-cash
- 6.71%
- DSCR
- 1.30
- GRM
- 8.8
CMA / ARV
- ARV (on-the-fly)
- $35,598
- Comps found
- 1
Show comp detail 1 sale within ~0.75 mi
| Address | Dist | Beds/Ba | Sqft | Sold | Price | $/sf | Match |
|---|---|---|---|---|---|---|---|
| 4513 13th Ave | 0.47mi | 2/1.0 | 778 (+12%) | 3mo | $40,000 | $51 | 56 |
Match score weights: distance 35% · size 25% · config 20% · recency 20%. Top-matched comps best support the ARV.
Projected returns pro-forma
-3.0% appreciation · 3.0% rent growth · sell at horizon
- IRR
- -6.0%
- Equity multiple
- 0.78×
- Total profit
- $-6,280
- Equity at exit
- $14,910
- IRR
- 3.5%
- Equity multiple
- 1.26×
- Total profit
- $7,174
- Equity at exit
- $8,646
Cash invested: $28,000 (down + closing). Projections, not guarantees.
Landlord ↔ Tenant lean methodology
- Overall (STATE)
- 90 Strongly Landlord-Friendly
- State Alabama
- 90 Strongly Landlord-Friendly · R+15
- County
- — inherits STATE
- City
- — inherits STATE
ZIP-level market 35212
- Active inventory
- 81
- Price-to-rent
- 8.8×
Monthly cashflow live
- Estimated rent
- $943 high interval (Pro) →
- Mortgage (P&I)
- −$524
- Tax from tax record
- −$22 /mo · $266/yr
- Insurance
- −$42
- HOA
- −$0
- Vacancy / Maint / Mgmt
- −$198
- Net cashflow
- $157
Break-even live
UW: 25.0% down · 7.5% · 30yr · 1.5% tax · 5.0% vac · 8.0% maint · 8.0% mgmt
Financing live
Cash to close
- Down payment
- $25,000
- Closing costs
- $3,000
- Reserves months
- —
- Total cash needed
- —
Loan-product check · same deal, 3 products live
Conventional
25% down · 7.5% · 30yr
- Down + closing
- —
- Monthly P&I
- —
- Monthly cashflow
- —
- DSCR
- —
- Eligible?
- —
Personal DTI + credit; lowest rate.
DSCR
20% down · 8.5% · 30yr
- Down + closing
- —
- Monthly P&I
- —
- Monthly cashflow
- —
- DSCR
- —
- Eligible?
- —
No personal income docs; deal must DSCR.
Hard money
10% down · 12.0% · 12mo
- Down + closing
- —
- Monthly P&I
- —
- Monthly cashflow
- —
- DSCR
- —
- Eligible?
- —
Short-term bridge; refi at stabilization.
Rent comps 15 comps
| Address | Beds | Baths | Sqft | Rent | $/sqft | DOM | Units | Dist |
|---|---|---|---|---|---|---|---|---|
| 737 47th St N Unit B Birmingham, AL | 2.0 | 1.0 | 706 | $750 | $1.06 | 23d | 1 | 0.13mi |
| 1217 43rd St N Birmingham, AL | 2.0 | 1.0 | 750 | $850 | $1.13 | 43d | 1 | 0.52mi |
| 4420 5th Ave S Birmingham, AL | 2.0 | 1.0 | 667 | $1,126 | $1.69 | 14d | 2 | 0.97mi |
| 4416 5th Ave S Unit 4420-8 Birmingham, AL | 2.0 | 1.0 | 667 | $1,032 | $1.55 | 21d | 1 | 0.98mi |
| 4416 5th Ave S Unit 4420-5 Birmingham, AL | 2.0 | 1.0 | 667 | $1,062 | $1.59 | 10d | 1 | 0.98mi |
| 4332 5th Ave S Unit 201 Birmingham, AL | 2.0 | 1.0 | 691 | $754 | $1.09 | 10d | 1 | 1.03mi |
| 4332 5th Ave S Apt 106 Birmingham, AL | 2.0 | 1.0 | 691 | $1,069 | $1.55 | 43d | 1 | 1.03mi |
| 4262 4th Ave S Birmingham, AL | 1.0 | 1.0 | 676 | $1,095 | $1.62 | 43d | 1 | 1.04mi |
| 4264 4th Ave S Birmingham, AL | 1.0 | 1.0 | 676 | $1,095 | $1.62 | 43d | 1 | 1.07mi |
| 4233 3rd Ave S Birmingham, AL | 2.0 | 1.0 | 750 | $1,150 | $1.53 | 43d | 1 | 1.10mi |
| 4237 5th Ave S Unit 4241-F Birmingham, AL | 2.0 | 1.0 | 725 | $1,098 | $1.51 | 43d | 1 | 1.18mi |
| 4237 5th Ave S Unit 4241-H Birmingham, AL | 2.0 | 1.0 | 725 | $1,115 | $1.54 | 43d | 1 | 1.18mi |
| 4237 5th Ave S Unit 4237-E Birmingham, AL | 2.0 | 1.0 | 725 | $1,135 | $1.57 | 2d | 1 | 1.18mi |
| 3824 5th Ave S Unit G01C Birmingham, AL | 1.0 | 1.0 | 623 | $845 | $1.36 | 43d | 1 | 1.44mi |
| 3824 5th Ave S Unit 203B Birmingham, AL | 1.0 | 1.0 | 623 | $830 | $1.33 | 43d | 1 | 1.45mi |
Listing history 6 events
-
2026-06-18days on market $100,000 Active 8 DOM
-
2026-06-17days on market $100,000 Active 7 DOM
-
2026-06-16days on market $100,000 Active 6 DOM
-
2026-06-15days on market $100,000 Active 5 DOM
-
2026-06-13remarks 603-char remark
-
2026-06-13$100,000 Active 3 DOM
ⓘ Source: listings_history table (triggers on properties + properties_extension) + one-shot
backfill from property_details.listing_events for pre-trigger history.
Tax reassessment forecast AL · Resets to sale price
- Current annual tax
- $266 · $22/mo
- Projected year-2 tax
- $410 · $34/mo
- Expected delta
- +$144/yr (+$12/mo · 54.0%)
ⓘ Screening estimate from a state-policy table — verify with the county assessor before closing.
Climate risk First Street
- Flood 1/10 Low FEMA zone X (unshaded) · 0% chance over 30 yrs
- Wildfire 1/10 Low
- Heat 6/10 Major 7 d/yr ≥106°F today · 19 d/yr by 30 yrs out
- Wind 6/10 Major 27% chance of damaging wind over 30 yrs
- Air quality 4/10 Moderate 6 unhealthy d/yr today · 8 by 30 yrs out
Nearby sold comps map
Loading sold comps map…
Walkable amenities ~0.75 mi
Loading nearby amenities…
Taxation est. · year 1
- Rental income
- $11,314
- − Mortgage interest
- −$5,602
- − Property taxes
- −$266
- − Insurance
- −$500
- − Repairs & maintenance
- −$905
- − Management
- −$905
- − Depreciation
- −$2,909
- Taxable income
- $227
- Est. tax owed @ 24.0%
- −$54
- After-tax cash flow
- $1,825/yr
For passive investors: Depreciation is non-cash, so a rental often shows a tax loss while cash-flowing — sheltering income. Rental losses are passive: they offset passive income freely, and up to $25,000/yr can offset ordinary (W-2) income if you actively participate and your MAGI is under $100k (phasing out to $0 by $150k); unused losses carry forward. On sale, claimed depreciation is recaptured at up to 25%, and gains may owe capital-gains tax (a 1031 exchange can defer both). Figures are a year-1 estimate at your 24.0% rate — not tax advice; consult a CPA.
Schools (NCES district)
- District
- Birmingham City
- NCES district ID
- 0100390
- Math proficiency
- 4% ▼ -17.00%
- Reading proficiency
- 20% ▼ -4.00%
- Median HH income
- $31,988
- Composite
- 9.49/100
- National rank
- #9850
- State rank
- #116 of 129 in AL
Livability — Birmingham
- Score
- 67/100
- State rank
- #78
- US rank
- #10412
Category grades
Schools grade is shown separately in the Schools card above.
Census & demographics
- Census place
- Birmingham, AL
- County
- Jefferson County · 527,445 people
- City population
- 210,422
- Metro
- Birmingham-Hoover, AL
- Population (ZIP)
- 10,160
- Household income
- $36,633
- Rent vs Own
- Severe rent burden
- 798.0
Population outlook (Jefferson County) Hauer SSP2
- Today (2025)
- 669,185 people
- By 2030
- 669,694 · +0.1%
- By 2040
- 661,388 · -1.2%
- By 2050
- 643,086 · -3.9%
- By 2075
- 577,267 · -13.7%
- By 2100
- 474,758 · -29.1%
Race, ethnicity, and origin ACS 2023
- Neighborhood character
- Predominantly Black (68%)
- Race & ethnicity
- Black 68% White 24% Hispanic / Latino 6% Two or more races 3% Asian 1%
- Hispanic origin (detail)
- Mexican 3%
- Common ancestry
- Italian 2% Slovak 2% Hispanic 1%
- Foreign-born
- 3% · Canada
- Languages at home
- 95% English-only · Spanish 3% French/Haitian/Cajun 1%
Political lean MEDSL · Jefferson
- 2024 margin
- D (+10.4) · D 54.6% · R 44.2% · Other 1.2%
- 2008→2024 swing
- +5.4pp toward D · 2008: 5.1pp · 2024: 10.4pp
- All cycles
- 2024: D+10.4 2020: D+13.2 2016: D+7.2 2012: D+6.0 2008: D+5.1
Not yet ingested
- Civics
- —
Market trends
- HPI YoY
- ▼ -190.24%
- Current HPI
- 120.1264
- Rent YoY
- —
- Metro
- Birmingham-Hoover, AL
- State GDP YoY
- ▲ 2.94%
- F500 in state
- 4
Industry mix (Fortune 500 HQ in AL)
| Industry | F500 HQs | Revenue |
|---|---|---|
| Financial Services | 1 | $8B |
|
||
| Healthcare | 1 | $5B |
|
||
Price history
+81.8% since first listed9 events — show timeline
- 2026-06-10 Listed $100,000 Greater Alabama MLS
- 2023-08-08 Sold (MLS) $56,500 Greater Alabama MLS
- 2023-08-07 Sold (Public Records) $56,500 Public Records
- 2023-07-17 Contingent — Greater Alabama MLS
- 2023-06-12 Relisted — Greater Alabama MLS
- 2023-06-05 Contingent — Greater Alabama MLS
- 2023-05-30 Relisted — Greater Alabama MLS
- 2023-05-20 Pending — Greater Alabama MLS
- 2023-05-16 Listed $55,000 Greater Alabama MLS
Property tax history
-5.2%/yrLatest (2025): $266 · +0.0% YoY. Source: county tax records.
Cash-flow waterfall
monthlySold comps — $/sqft
last 12 mo · ≤1 miLoading sold comps…