2721 Hemphill St · Fort Worth, TX
Flood risk No data
- FEMA flood zone
- —
- Chance of flooding over 30 yrs
- —
- Est. flood insurance / yr
- —
Fire risk No data
- Est. fire insurance / yr
- —
Heat risk No data
- Hot days now (above threshold)
- —
- Hot days in 30 yrs
- —
Wind risk No data
- Chance of severe wind over 30 yrs
- —
Air-quality risk No data
- Unhealthy air days now
- —
- Unhealthy air days in 30 yrs
- —
Risk factors via First Street. Map © Google.
Why this score? — see what drove the D grade
The composite is a weighted blend of 9 inputs, each scored 0–100. Each bar is that input's sub-score; the figure is the points it added to the 100-point composite (weight × sub-score).
- Cash flow +12.7/30.0
- ARV discount +10.8/15.0
- Livability +4.0/5.0
- DSCR +3.8/10.0
- 1% rule +3.6/10.0
- Rent growth +2.7/5.0
- Condition / age +2.5/5.0
- Schools +2.0/10.0
- Appreciation +0.0/10.0
$254,900
🖨 Deal sheet (PDF) 📄 Offer letter ✓ Due diligence
Listing remarks MLS
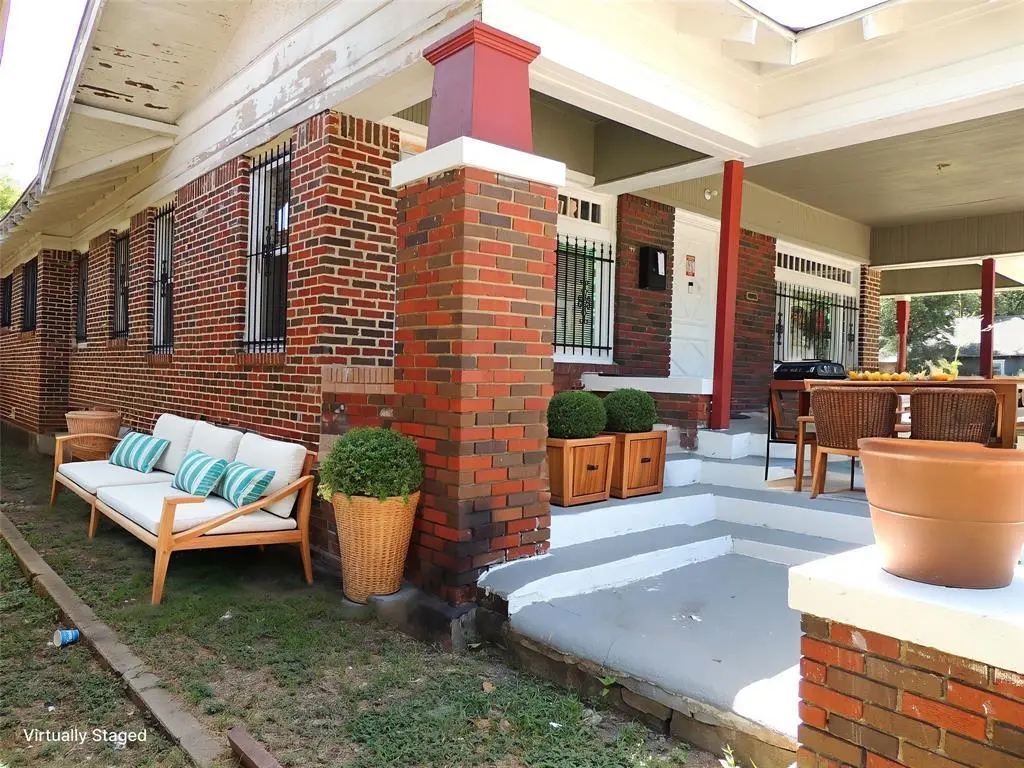
Imagine the stories held within these walls. Built in 1927, this enchanting Hemphill home welcomes you with its original wood floors and an abundance of natural light. The grand front porch provides the perfect sanctuary for sipping your morning coffee or unwinding with a book. Its generous interior offers ample space for family living, while its zoning versatility also presents a unique investment opportunity. Whether you envision it as a peaceful residence or a high-traffic business, this property offers a beautiful foundation for your future.
Key facts
- Zoning versatility
- Original wood floors
- Grand front porch
Tags
Neighborhood map
What this means for you Summary
Snapshot
- This is a 3-bed/1.5-bath single-family listed at $255k.
Deal economics
- At list price, monthly cash flow is $-26 ($-310/yr) — negative.
- To cash-flow at today's rent, offer at most $251k (1.5% below list).
- To meet the 1% rule (rent ≥ 1% of price), the offer needs to be $220k (13.8% below list).
- Recommended offer: $220k (13.8% below list) — sets the bar for 1% rule.
- Cap rate 6.2% vs local median 3.9% in Fort Worth — top-decile yield for the area; either an underpriced asset or a hidden risk that comps aren't pricing in. Stress-test before assuming the spread holds.
Location & tenants
- Location reads 80/100 on livability (#49 in TX, #1,954 nationally) — a professional / high-income tenant draw. Strengths: amenities A+, cost of living A+, housing A+; Watch: schools D+, crime F.
- Fort Worth ISD (urban): math 18% / reading 28% proficiency, ranked #742 of 826 in TX (top 90%) — low school quality limits family demand, transient renter base, plan for 1-2y turnover; 73% free/reduced lunch — lower-income household profile, screen leases tightly.
- Market conditions: Rents flat; 150 active listings in the ZIP; 40 comparable units currently listed for rent nearby; rentals at typical pace (median 21d on market — plan ~3-4 weeks tenant-placement turnaround); 18,938 units permitted in Tarrant County in 2024 (8,336 in 5+ unit buildings).
- This rent runs 38% of the median local income ($70k/yr) — at the standard rent-burdened threshold; future hikes will face affordability resistance.
Forward outlook
- Local home prices are declining (-3.0%/yr); year-one equity from $2k of loan paydown is wiped out by about $8k of value loss. Plan a longer hold.
- Tarrant County population projected at +41% by 2050 — long-run rental-demand tailwind backs the buy-and-hold thesis.
Negotiation context
- It's been on market 156 days — a 12% lower offer ($224k) is reasonable based on typical stale-listing flexibility.
- 3 sale attempts since 23y ago with the ask held roughly flat each time — persistent listings suggest the price (not the market) is what's stuck; bring a comps-based counter.
Risks & watch-outs
- Watch-outs: built in 1928 — expect roof / HVAC / electrical / plumbing capex.
Questions for the listing agent
- What do current leases actually rent for vs. the listed asking? Can we see a recent rent roll and the last 12 months of T-12 income?
- It's been on market 156 days. Have you received any prior offers? Is the seller open to a 14% concession, seller financing, or rate buy-down credit?
- Built in 1928 — when were the roof, HVAC, electrical panel, plumbing, and water heater last replaced?
- Why hasn't it sold? Are there any deal-killer items the seller is aware of (foundation, flood, title, zoning, code violations)?
- Is there a deadline driving the sale (1031 exchange, divorce, estate, relocation)? That informs how much negotiation room exists.
- Schools are D-rated, which usually means shorter tenancies and higher turnover. Who's the typical renter profile here, and what's been the actual vacancy rate?
- Crime grade is F in this area — have there been break-ins, vandalism, or insurance claims at this property in the last 3 years? What carrier currently insures it and at what premium?
- The area grade is low — what's the realistic commute time and amenity access for the typical tenant pool here? Any planned neighborhood developments (good or bad) we should know about?
- What's the average days-on-market for RENTAL listings here right now (not sales)? A rising rental-DOM trend means longer vacancies and softer asking-rent achievability than the comps imply.
- What's the recent tenant-quality profile in this submarket — average credit score on applications, eviction rate, late-payment / NSF rate, and stable-employment percentage? A property-management company in the area should have these aggregated.
- How much new for-sale + rental construction is in the pipeline within 1–3 miles? Heavy new supply typically softens prices + rents 12–24 months out; constrained supply supports both.
Investment metrics
- 1% rule
- 0.86% ✗
- Cap rate
- 6.17%
- Cash-on-cash
- -0.43%
- DSCR
- 0.98
- GRM
- 9.7
CMA / ARV
- ARV (median comp)
- $274,894
- List price
- $254,900
- Delta
- -7.27%
- Verdict
- FAIR
- Comps
- 20 within 1.0 mi
Show comp detail 12 sales within ~0.75 mi
| Address | Dist | Beds/Ba | Sqft | Sold | Price | $/sf | Match |
|---|---|---|---|---|---|---|---|
| 2809 Travis Ave | 0.13mi | 3/2.0 | 1,469 (-12%) | 1mo | $269,900 | $184 | 71 |
| 3104 S Adams St | 0.57mi | 2/1.0 (-1) | 1,704 (+2%) | 0mo | $229,000 | $134 | 62 |
| 3108 S Adams St | 0.58mi | 3/1.0 | 1,576 (-6%) | 2mo | $250,000 | $159 | 60 |
| 3137 Hemphill St | 0.54mi | 3/2.0 | 1,756 (+5%) | 6mo | $139,900 | $80 | 59 |
| 2105 Lipscomb St | 0.60mi | 2/2.0 (-1) | 1,586 (-5%) | 1mo | $385,000 | $243 | 56 |
| 2233 Fairmount Ave | 0.75mi | 3/2.0 | 1,596 (-4%) | 1mo | $539,500 | $338 | 55 |
| 2000 College Ave | 0.72mi | 2/2.0 (-1) | 1,700 (+2%) | 7mo | $525,000 | $309 | 51 |
| 3001 Willing Ave | 0.68mi | 3/2.0 | 1,802 (+8%) | 4mo | $625,000 | $347 | 49 |
| 504 E Robert St | 0.51mi | 4/3.0 (+1) | 1,521 (-9%) | 2mo | $252,900 | $166 | 49 |
| 3033 6th Ave | 0.66mi | 3/2.0 | 1,886 (+13%) | 3mo | $515,000 | $273 | 43 |
| 803 Hawthorne Ave | 0.61mi | 2/2.0 (-1) | 1,447 (-13%) | 3mo | $399,000 | $276 | 40 |
| 2220 5th Ave | 0.69mi | 2/2.0 (-1) | 1,437 (-14%) | 1mo | $410,000 | $285 | 37 |
Match score weights: distance 35% · size 25% · config 20% · recency 20%. Top-matched comps best support the ARV.
Projected returns pro-forma
-3.0% appreciation · 0.7% rent growth · sell at horizon
- IRR
- -19.6%
- Equity multiple
- 0.33×
- Total profit
- $-47,887
- Equity at exit
- $38,006
- IRR
- -18.2%
- Equity multiple
- 0.12×
- Total profit
- $-63,161
- Equity at exit
- $22,039
Cash invested: $71,372 (down + closing). Projections, not guarantees.
Landlord ↔ Tenant lean methodology
- Overall (STATE)
- 87 Strongly Landlord-Friendly
- State Texas
- 87 Strongly Landlord-Friendly · R+5
- County
- — inherits STATE
- City
- — inherits STATE
ZIP-level market 76110
- Rents YoY
- 0.7%
- Active inventory
- 150
- Price-to-rent
- 9.7×
Monthly cashflow live
- Estimated rent
- $2,197 high interval (Pro) →
- Mortgage (P&I)
- −$1,337
- Tax est. 1.5%
- −$319 /mo · $3,824/yr
- Insurance
- −$106
- HOA
- −$0
- Vacancy / Maint / Mgmt
- −$461
- Net cashflow
- $-26
Break-even live
Sensitivity live
| Price | -10% $150 | -5% $62 | +0% $-26 | +5% $-114 | +10% $-202 |
|---|---|---|---|---|---|
| Rent | -10% $-199 | -5% $-113 | +0% $-26 | +5% $61 | +10% $148 |
| Rate | -1.0pp $103 | -0.5pp $39 | base $-26 | +0.5pp $-92 | +1.0pp $-159 |
UW: 25.0% down · 7.5% · 30yr · 1.5% tax · 5.0% vac · 8.0% maint · 8.0% mgmt
Financing live
Cash to close
- Down payment
- $63,725
- Closing costs
- $7,647
- Reserves months
- —
- Total cash needed
- —
Loan-product check · same deal, 3 products live
Conventional
25% down · 7.5% · 30yr
- Down + closing
- —
- Monthly P&I
- —
- Monthly cashflow
- —
- DSCR
- —
- Eligible?
- —
Personal DTI + credit; lowest rate.
DSCR
20% down · 8.5% · 30yr
- Down + closing
- —
- Monthly P&I
- —
- Monthly cashflow
- —
- DSCR
- —
- Eligible?
- —
No personal income docs; deal must DSCR.
Hard money
10% down · 12.0% · 12mo
- Down + closing
- —
- Monthly P&I
- —
- Monthly cashflow
- —
- DSCR
- —
- Eligible?
- —
Short-term bridge; refi at stabilization.
Rent comps 40 comps
| Address | Beds | Baths | Sqft | Rent | $/sqft | DOM | Units | Dist |
|---|---|---|---|---|---|---|---|---|
| 2837 Hemphill St Unit 203 Fort Worth, TX | 2.0 | 2.0 | 1297 | $1,875 | $1.45 | 21d | 1 | 0.14mi |
| 2837 Hemphill St Unit 202 Fort Worth, TX | 2.0 | 2.0 | 1297 | $1,800 | $1.39 | 21d | 1 | 0.15mi |
| 2901 Travis Ave Fort Worth, TX | 1.0–2.0 | 1.0–2.0 | 975 | $1,340 | $1.37 | 25d | 5 | 0.23mi |
| 2932 Travis Ave Unit 2932 Fort Worth, TX | 3.0 | 2.0 | 1600 | $1,700 | $1.06 | 21d | 1 | 0.29mi |
| 2701 Stuart Dr Fort Worth, TX | 3.0 | 3.0 | 2104 | $1,800 | $0.86 | 44d | 1 | 0.41mi |
| 2812 Ryan Place Dr Fort Worth, TX | 2.0 | 1.0 | 1234 | $2,795 | $2.26 | 18d | 1 | 0.43mi |
| 3225 S Adams St Fort Worth, TX | 4.0 | 2.0 | 1948 | $2,395 | $1.23 | 25d | 1 | 0.69mi |
| 2911 Ryan Ave Fort Worth, TX | 3.0 | 2.0 | 1790 | $1,750 | $0.98 | 6d | 1 | 0.70mi |
| 2532 Ryan Ave Fort Worth, TX | 3.0 | 2.0 | 1416 | $2,100 | $1.48 | 44d | 1 | 0.72mi |
| 1246 Lowe St Fort Worth, TX | 3.0 | 2.5 | 1752 | $1,895 | $1.08 | 15d | 1 | 0.75mi |
| 3329 Hemphill St Fort Worth, TX | 3.0 | 2.0 | 1425 | $2,950 | $2.07 | 44d | 1 | 0.75mi |
| 1925 Saint Louis Ave Fort Worth, TX | 3.0 | 1.0 | 1219 | $1,695 | $1.39 | 44d | 1 | 0.75mi |
| 1920 Saint Louis Ave Fort Worth, TX | 4.0 | 3.0 | 1484 | $1,745 | $1.18 | 44d | 1 | 0.76mi |
| 642 E Harvey Ave Fort Worth, TX | 4.0 | 2.0 | 1755 | $2,099 | $1.20 | 44d | 1 | 0.77mi |
| 2200 6th Ave Fort Worth, TX | 3.0 | 3.0 | 1552 | $2,650 | $1.71 | 44d | 1 | 0.80mi |
| 2828 Addison Park Ln Fort Worth, TX | 3.0 | 3.5 | 1936 | $2,495 | $1.29 | 21d | 1 | 0.86mi |
| 2807 Stanley Ave Fort Worth, TX | 3.0 | 2.5 | 1906 | $2,395 | $1.26 | 25d | 1 | 0.87mi |
| 1741 W Cantey St Fort Worth, TX | 3.0 | 3.5 | 1882 | $2,400 | $1.28 | 3d | 1 | 0.87mi |
| 3201 Ryan Ave Fort Worth, TX | 4.0 | 2.0 | 2000 | $2,100 | $1.05 | 44d | 1 | 0.87mi |
| 2101 Fairmount Ave Fort Worth, TX | 3.0 | 2.5 | 1516 | $3,200 | $2.11 | 2d | 1 | 0.87mi |
| 2901 Stanley Ave Fort Worth, TX | 2.0 | 1.0–2.0 | 829 | $2,000 | $2.41 | 4d | 4 | 0.88mi |
| 2828 Livingston Ave Fort Worth, TX | 4.0 | 2.5 | 2208 | $3,700 | $1.68 | 44d | 1 | 0.96mi |
| 823 E Arlington Ave Fort Worth, TX | 4.0 | 2.5 | 1720 | $2,350 | $1.37 | 25d | 1 | 0.97mi |
| 1037 Colvin St Fort Worth, TX | 2.0 | 1.0 | 1092 | $1,500 | $1.37 | 20d | 1 | 1.00mi |
| 3303 8th Ave Fort Worth, TX | 3.0 | 2.0 | 1348 | $2,000 | $1.48 | 25d | 1 | 1.00mi |
| 2311 Warner Rd Fort Worth, TX | 3.0 | 2.0 | 2114 | $3,750 | $1.77 | 19d | 1 | 1.01mi |
| 2311 Warner Rd Fort Worth, TX | 3.0 | 2.0 | 2114 | $3,750 | $1.77 | 6d | 1 | 1.01mi |
| 2816 Gordon Ave Fort Worth, TX | 3.0 | 3.0 | 1570 | $3,000 | $1.91 | 6d | 1 | 1.01mi |
| 1108 E Robert St Fort Worth, TX | 3.0 | 1.0 | 1444 | $1,825 | $1.26 | 22d | 1 | 1.04mi |
| 2001 Park Hill Dr Fort Worth, TX | 1.0–3.0 | 1.0–2.0 | 1024 | $2,459 | $2.40 | 2d | 50 | 1.08mi |
| 2821 Frazier Ave Unit 2823 Fort Worth, TX | 3.0 | 2.0 | 1200 | $1,600 | $1.33 | 19d | 1 | 1.10mi |
| 3411 8th Ave Fort Worth, TX | 3.0 | 2.0 | 1280 | $1,700 | $1.33 | 5d | 1 | 1.11mi |
| 2712 Frazier Ave Fort Worth, TX | 3.0 | 2.0 | 1099 | $2,625 | $2.39 | 19d | 1 | 1.13mi |
| 1605 5th Ave Fort Worth, TX | 2.0 | 2.0 | 1050 | $1,495 | $1.42 | 19d | 1 | 1.16mi |
| 2803 Wayside Ave Fort Worth, TX | 3.0 | 2.0 | 1190 | $1,700 | $1.43 | 25d | 1 | 1.16mi |
| 2205 Park Hill Dr Fort Worth, TX | 2.0 | 2.0 | 1368 | $1,950 | $1.43 | 44d | 1 | 1.16mi |
| 1921 Ben Hall Ct Fort Worth, TX | 3.0 | 1.0 | 1507 | $2,850 | $1.89 | 11d | 1 | 1.24mi |
| 315 W Magnolia Ave Fort Worth, TX | 2.0 | 1.0–2.0 | 827 | $2,118 | $2.56 | 2d | 40 | 1.27mi |
| 958 E Allen Ave Fort Worth, TX | 3.0 | 3.0 | 1568 | $4,300 | $2.74 | 44d | 1 | 1.28mi |
| 2920 Pima Ln Fort Worth, TX | 3.0 | 2.5 | 1540 | $1,800 | $1.17 | 14d | 1 | 1.28mi |
Listing history 19 events
-
2026-06-18days on market $254,900 Active 156 DOM
-
2026-06-17days on market $254,900 Active 155 DOM
-
2026-06-16days on market $254,900 Active 154 DOM
-
2026-06-15days on market $254,900 Active 153 DOM
-
2026-06-13days on market $254,900 Active 151 DOM
-
2026-06-09days on market $254,900 Active 147 DOM
-
2026-06-08days on market $254,900 Active 146 DOM
-
2026-06-07days on market $254,900 Active 145 DOM
-
2026-06-04days on market $254,900 Active 142 DOM
-
2026-06-03days on market $254,900 Active 141 DOM
-
2026-06-02days on market $254,900 Active 140 DOM
-
2026-06-02days on market $254,900 Active 139 DOM
-
2026-05-31days on market $254,900 Active 138 DOM
-
2026-03-12price $254,900 551-char remark
Show marketing remark (551 chars)
Imagine the stories held within these walls. Built in 1927, this enchanting Hemphill home welcomes you with its original wood floors and an abundance of natural light. The grand front porch provides the perfect sanctuary for sipping your morning coffee or unwinding with a book. Its generous interior offers ample space for family living, while its zoning versatility also presents a unique investment opportunity. Whether you envision it as a peaceful residence or a high-traffic business, this property offers a beautiful foundation for your future.
-
2026-03-11status Active 551-char remark
Show marketing remark (551 chars)
Imagine the stories held within these walls. Built in 1927, this enchanting Hemphill home welcomes you with its original wood floors and an abundance of natural light. The grand front porch provides the perfect sanctuary for sipping your morning coffee or unwinding with a book. Its generous interior offers ample space for family living, while its zoning versatility also presents a unique investment opportunity. Whether you envision it as a peaceful residence or a high-traffic business, this property offers a beautiful foundation for your future.
-
2025-12-14historical Active Option Contract 551-char remark
Show marketing remark (551 chars)
Imagine the stories held within these walls. Built in 1927, this enchanting Hemphill home welcomes you with its original wood floors and an abundance of natural light. The grand front porch provides the perfect sanctuary for sipping your morning coffee or unwinding with a book. Its generous interior offers ample space for family living, while its zoning versatility also presents a unique investment opportunity. Whether you envision it as a peaceful residence or a high-traffic business, this property offers a beautiful foundation for your future.
-
2025-10-10$259,900 Active 551-char remark
Show marketing remark (551 chars)
Imagine the stories held within these walls. Built in 1927, this enchanting Hemphill home welcomes you with its original wood floors and an abundance of natural light. The grand front porch provides the perfect sanctuary for sipping your morning coffee or unwinding with a book. Its generous interior offers ample space for family living, while its zoning versatility also presents a unique investment opportunity. Whether you envision it as a peaceful residence or a high-traffic business, this property offers a beautiful foundation for your future.
-
2003-11-21historical
-
2003-10-30$69,500
ⓘ Source: listings_history table (triggers on properties + properties_extension) + one-shot
backfill from property_details.listing_events for pre-trigger history.
Nearby sold comps map
Loading sold comps map…
Walkable amenities ~0.75 mi
Loading nearby amenities…
Taxation est. · year 1
- Rental income
- $26,365
- − Mortgage interest
- −$14,278
- − Property taxes
- −$3,824
- − Insurance
- −$1,274
- − Repairs & maintenance
- −$2,109
- − Management
- −$2,109
- − Depreciation
- −$7,415
- Taxable loss
- −$4,645
- Est. tax savings @ 24.0%
- +$1,115
- After-tax cash flow
- $805/yr
For passive investors: Depreciation is non-cash, so a rental often shows a tax loss while cash-flowing — sheltering income. Rental losses are passive: they offset passive income freely, and up to $25,000/yr can offset ordinary (W-2) income if you actively participate and your MAGI is under $100k (phasing out to $0 by $150k); unused losses carry forward. On sale, claimed depreciation is recaptured at up to 25%, and gains may owe capital-gains tax (a 1031 exchange can defer both). Figures are a year-1 estimate at your 24.0% rate — not tax advice; consult a CPA.
Schools (NCES district)
- District
- Fort Worth ISD
- NCES district ID
- 4819700
- Math proficiency
- 18% ▼ -16.00%
- Reading proficiency
- 28% ▼ -6.00%
- Median HH income
- $42,109
- Composite
- 19.61/100
- National rank
- #8753
- State rank
- #742 of 826 in TX
Livability — Fort Worth
- Score
- 80/100
- State rank
- #49
- US rank
- #1954
Category grades
Schools grade is shown separately in the Schools card above.
Census & demographics
- Census place
- Fort Worth, TX
- County
- Tarrant County · 2,033,669 people
- City population
- 911,619
- Metro
- Dallas-Fort Worth-Arlington, TX
- Population (ZIP)
- 33,441
- Household income
- $69,790
- Rent vs Own
- Severe rent burden
- 1471.0
Population outlook (Tarrant County) Hauer SSP2
- Today (2025)
- 2,380,417 people
- By 2030
- 2,578,900 · +8.3%
- By 2040
- 2,974,995 · +25.0%
- By 2050
- 3,350,489 · +40.8%
- By 2075
- 4,216,909 · +77.2%
- By 2100
- 4,741,527 · +99.2%
Race, ethnicity, and origin ACS 2023
- Neighborhood character
- Majority Hispanic (63%)
- Race & ethnicity
- Hispanic / Latino 63% White 30% Two or more races 24% Black 2% Asian 2%
- Hispanic origin (detail)
- Mexican 57%
- Common ancestry
- Slovak 1% Italian 1% Lithuanian 1%
- Foreign-born
- 26% · Canada, China
- Languages at home
- 45% English-only · Spanish 52% Other Asian/Pacific 1% Other Indo-European 1%
Political lean MEDSL · Tarrant
- 2024 margin
- Lean R (+5.1) · D 46.7% · R 51.9% · Other 1.4%
- 2008→2024 swing
- +6.6pp toward D · 2008: -11.7pp · 2024: -5.1pp
- All cycles
- 2024: R+5.1 2020: D+0.2 2016: R+8.7 2012: R+15.7 2008: R+11.7
Not yet ingested
- Civics
- —
Market trends
- HPI YoY
- ▼ -194.46%
- Current HPI
- 274.8888
- Rent YoY
- ▲ 0.70%
- Metro
- Dallas-Fort Worth-Arlington, TX
- State GDP YoY
- ▲ 3.95%
- F500 in state
- 110
Industry mix (Fortune 500 HQ in TX)
| Industry | F500 HQs | Revenue |
|---|---|---|
| Energy | 16 | $1,198B |
|
||
| Technology | 5 | $198B |
|
||
| Engineering / Construction | 4 | $72B |
|
||
| Energy Services | 3 | $60B |
|
||
| Utilities | 3 | $41B |
|
||
| Healthcare | 2 | $330B |
|
||
Price history
+266.8% since first listed6 events — show timeline
- 2026-03-12 Price Changed $254,900 NTREIS
- 2026-03-11 Relisted — NTREIS
- 2025-12-14 Contingent — NTREIS
- 2025-10-10 Listed $259,900 NTREIS
- 2003-11-21 Listing Removed — NTREIS
- 2003-10-30 Listed $69,500 NTREIS
Cash-flow waterfall
monthlySold comps — $/sqft
last 12 mo · ≤1 miLoading sold comps…