5711 W Columbia Way Spc 99 · Quartz Hill, CA
Flood risk 4/10 · Minor
- FEMA flood zone
- X (unshaded)
- Chance of flooding over 30 yrs
- 0.22%
- Est. flood insurance / yr
- $507 – $1,088
Fire risk 8/10 · Major
- Est. fire insurance / yr
- $659 – $1,223
Heat risk 6/10 · Moderate
- Hot days now (above 97°F)
- 4 days/yr
- Hot days in 30 yrs
- 9 days/yr
Wind risk 1/10 · Minimal
- Chance of severe wind over 30 yrs
- —
Air-quality risk 10/10 · Severe
- Unhealthy air days now
- 28 days/yr
- Unhealthy air days in 30 yrs
- 33 days/yr
Risk factors via First Street. Map © Google.
Why this score? — see what drove the B grade
The composite is a weighted blend of 9 inputs, each scored 0–100. Each bar is that input's sub-score; the figure is the points it added to the 100-point composite (weight × sub-score).
- Cash flow +30.0/30.0
- ARV discount +12.2/15.0
- 1% rule +10.0/10.0
- DSCR +10.0/10.0
- Schools +4.1/10.0
- Livability +2.9/5.0
- Condition / age +2.5/5.0
- Rent growth +2.2/5.0
- Appreciation +0.0/10.0
$130,000
🖨 Deal sheet 📄 Offer letter ✓ Due diligence
Listing remarks
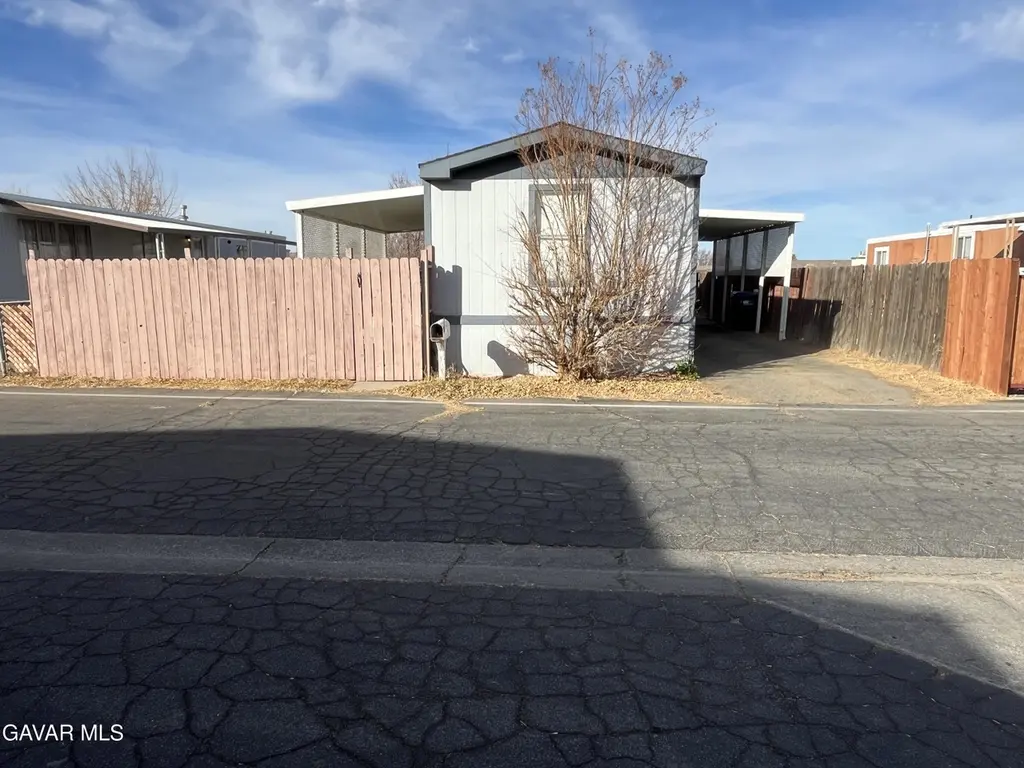
Excellent investment opportunity in the desirable Quartz Hill Mobile Home Park in Lancaster! This well-maintained home offers 2 bedrooms and 2 bathrooms with a functional layout ideal for comfortable living or rental income. The property features a covered parking area, plus a separate storage shed for added convenience. Interior has been recently updated with fresh paint, creating a clean and inviting atmosphere. The yard is fully fenced and landscaped, offering privacy and low maintenance. Each bedroom is thoughtfully positioned on opposite sides of the home, providing maximum privacy--perfect for tenants or shared living. The master bedroom includes its own private bathroom. Community am
Key facts
- Clubhouse
- Community amenities
- Landscaped yard
Tags
Property features AI
Finance
- Other: APN 8950-116-099; Serial/Dec/Label numbers on file; Sq. Ft. source: Assessor
- Financial info: Income producing
- HOA & community: Park rent listed as $560 (buyer to verify new space rent); Park deposit: buyer to check; Deposit amount listed as $2,000
Exterior
- Utilities: 220V electric; Natural gas; Cable TV
- Home design: Manufactured/mobile home (model: Granville, trade name: Granville); All-ages park; Space number Spc 99
- Construction: Metal roof; Siding exterior; Skirted; Manufactured in 1986 (date of manufacture: 1986-10-02); Length 77 ft, Width 12 ft; Manufacturer: REDMAN, Model: GRANVILLE
- Exterior features: Chain link and wood fencing; Awning; Shed; Recreation area, clubhouse/rec room, and pool in the mobile home park
Interior
- Kitchen: Dishwasher; Gas range; Disposal; Window-mounted refrigerator
- Bathrooms: 2 full bathrooms
- Heating & cooling: Central gas heating; Natural gas
- Interior features: Dishwasher; Gas range; Disposal; Refrigerator wall/window (window-mounted refrigerator)
Neighborhood map
What this means for you Summary
Snapshot
- This is a 2-bed/2.0-bath manufactured listed at $130k.
Deal economics
- At list price, monthly cash flow is $950 ($11k/yr) — positive.
- The deal already cash-flows at list — no discount required.
- Meets the 1% rule at list price ($2k rent vs $130k).
- Recommended offer: $122k (6.0% below list) — sets the bar for market timing.
- Cap rate 15.1% vs local median 4.1% in Quartz Hill — top-decile yield for the area; either an underpriced asset or a hidden risk that comps aren't pricing in. Stress-test before assuming the spread holds.
Location & tenants
- Location reads 58/100 on livability (#703 in CA) — a working-class tenant base; expect higher turnover. Strengths: employment A+, housing A+; Watch: schools D-, crime D-, amenities F.
- Westside Union Elementary (suburban): math 34% / reading 49% proficiency, ranked #565 of 1,400 in CA (top 40%) — families likely to look elsewhere, expect single-tenant / working-renter base with shorter leases.
- Market conditions: Rents soft (-1.2%/yr); 1129 active listings in the ZIP; 6 comparable units currently listed for rent nearby; rentals leasing fast (median 1d on market — plan ~1-2 weeks tenant-placement turnaround); solid renter incomes; 19,697 units permitted in Los Angeles County in 2024 (9,426 in 5+ unit buildings).
Forward outlook
- Local home prices are declining (-3.0%/yr); year-one equity from $899 of loan paydown is wiped out by about $4k of value loss. Plan a longer hold.
- Los Angeles County population projected at +9% by 2050 — modest demand growth; plan on rents tracking national, not racing it.
- At projected returns (-3.0% appreciation + 0.0% rent growth), your $36k cash investment doubles in ~5 years — after that, you're playing with house money.
Negotiation context
- It's been on market 85 days — a 6% lower offer ($122k) is reasonable based on typical stale-listing flexibility.
- 3 sale attempts since 8y ago with the ask held roughly flat each time — persistent listings suggest the price (not the market) is what's stuck; bring a comps-based counter.
- Current owner paid $29k; list at $130k implies a 348% gain — meaningful room to come down on a strong offer.
Risks & watch-outs
- Climate carrying-cost: severe wildfire risk; extreme-heat days projected 4→9/yr by 2055 (HVAC capex compounding) — expect insurance premiums to compound above CPI over the hold.
Questions for the listing agent
- It's been on market 85 days. Have you received any prior offers? Is the seller open to a 6% concession, seller financing, or rate buy-down credit?
- Why hasn't it sold? Are there any deal-killer items the seller is aware of (foundation, flood, title, zoning, code violations)?
- Is there a deadline driving the sale (1031 exchange, divorce, estate, relocation)? That informs how much negotiation room exists.
- Schools are D-rated, which usually means shorter tenancies and higher turnover. Who's the typical renter profile here, and what's been the actual vacancy rate?
- Crime grade is D in this area — have there been break-ins, vandalism, or insurance claims at this property in the last 3 years? What carrier currently insures it and at what premium?
- What's the average days-on-market for RENTAL listings here right now (not sales)? A rising rental-DOM trend means longer vacancies and softer asking-rent achievability than the comps imply.
- What's the recent tenant-quality profile in this submarket — average credit score on applications, eviction rate, late-payment / NSF rate, and stable-employment percentage? A property-management company in the area should have these aggregated.
- How much new for-sale + rental construction is in the pipeline within 1–3 miles? Heavy new supply typically softens prices + rents 12–24 months out; constrained supply supports both.
Investment metrics
- 1% rule
- 1.67% ✓
- Cap rate
- 15.06%
- Cash-on-cash
- 31.31%
- DSCR
- 2.39
- GRM
- 5.0
CMA / ARV
- ARV (on-the-fly)
- $145,068
- Comps found
- 3
Show comp detail 3 sales within ~0.75 mi
| Address | Dist | Beds/Ba | Sqft | Sold | Price | $/sf | Match |
|---|---|---|---|---|---|---|---|
| 5711 Columbia Way #137 | 0.00mi | 3/2.0 (+1) | 924 (0%) | 3mo | $145,000 | $157 | 92 |
| 5711 W Columbia Way #216 | 0.00mi | 2/2.0 | 924 (0%) | 12mo | $110,000 | $119 | 90 |
| 5711 Columbia Way #77 | 0.00mi | 2/2.0 | 960 (+4%) | 20mo | $170,000 | $177 | 77 |
Match score weights: distance 35% · size 25% · config 20% · recency 20%. Top-matched comps best support the ARV.
Projected returns pro-forma
-3.0% appreciation · 0.0% rent growth · sell at horizon
- IRR
- 22.9%
- Equity multiple
- 1.91×
- Total profit
- $33,009
- Equity at exit
- $19,383
- IRR
- 29.0%
- Equity multiple
- 3.25×
- Total profit
- $81,839
- Equity at exit
- $11,240
Cash invested: $36,400 (down + closing). Projections, not guarantees.
Landlord ↔ Tenant lean methodology
- Overall (STATE)
- 18 Strongly Tenant-Friendly
- State California
- 18 Strongly Tenant-Friendly · D+13
- County
- — inherits STATE
- City
- — inherits STATE
ZIP-level market 93536
- Rents YoY
- -1.2%
- Active inventory
- 1129
- Price-to-rent
- 5.0×
Monthly cashflow live
- Estimated rent
- $2,171 high interval (Pro) →
- Mortgage (P&I)
- −$682
- Tax from tax record
- −$30 /mo · $358/yr
- Insurance
- −$54
- HOA
- −$0
- Vacancy / Maint / Mgmt
- −$456
- Net cashflow
- $950
Break-even live
UW: 25.0% down · 7.5% · 30yr · 1.5% tax · 5.0% vac · 8.0% maint · 8.0% mgmt
Financing live
Cash to close
- Down payment
- $32,500
- Closing costs
- $3,900
- Reserves months
- —
- Total cash needed
- —
Loan-product check · same deal, 3 products live
Conventional
25% down · 7.5% · 30yr
- Down + closing
- —
- Monthly P&I
- —
- Monthly cashflow
- —
- DSCR
- —
- Eligible?
- —
Personal DTI + credit; lowest rate.
DSCR
20% down · 8.5% · 30yr
- Down + closing
- —
- Monthly P&I
- —
- Monthly cashflow
- —
- DSCR
- —
- Eligible?
- —
No personal income docs; deal must DSCR.
Hard money
10% down · 12.0% · 12mo
- Down + closing
- —
- Monthly P&I
- —
- Monthly cashflow
- —
- DSCR
- —
- Eligible?
- —
Short-term bridge; refi at stabilization.
Rent comps 6 comps
| Address | Beds | Baths | Sqft | Rent | $/sqft | DOM | Units | Dist |
|---|---|---|---|---|---|---|---|---|
| 6570 West Avenue L Lancaster, CA | 1.0 | 1.0 | 531 | $1,645 | $3.10 | 1d | 1 | 0.68mi |
| 42347 52nd St W Lancaster, CA | 2.0 | 1.0 | 837 | $2,300 | $2.75 | 12d | 1 | 0.77mi |
| 5036 West Avenue L8 Unit 20 Quartz Hill, CA | 1.0 | 1.0 | 800 | $1,395 | $1.74 | 1d | 1 | 0.93mi |
| 5637 Redwood Ave Unit B Palmdale, CA | 2.0 | 1.0 | 760 | $2,445 | $3.22 | 1d | 1 | 0.97mi |
| 4849 Avenue L-14 Quartz Hill, CA | 2.0 | 1.0 | 900 | $1,695 | $1.88 | 1d | 1 | 1.01mi |
| 42603 50th St W Lancaster, CA | 2.0 | 1.0 | 786 | $2,300 | $2.93 | 1d | 1 | 1.13mi |
Listing history 26 events
-
2026-06-18days on market $130,000 Active 85 DOM
-
2026-06-17days on market $130,000 Active 84 DOM
-
2026-06-16days on market $130,000 Active 83 DOM
-
2026-06-15days on market $130,000 Active 82 DOM
-
2026-06-13days on market $130,000 Active 80 DOM
-
2026-06-13days on market $130,000 Active 79 DOM
-
2026-06-09days on market $130,000 Active 76 DOM
-
2026-06-08days on market $130,000 Active 75 DOM
-
2026-06-07days on market $130,000 Active 74 DOM
-
2026-06-04days on market $130,000 Active 71 DOM
-
2026-06-03days on market $130,000 Active 70 DOM
-
2026-06-02days on market $130,000 Active 69 DOM
-
2026-06-01days on market $130,000 Active 68 DOM
-
2026-05-31days on market $130,000 Active 67 DOM
-
2026-03-25$130,000 Active
-
2025-06-17price $115,000
-
2025-04-25price $125,000
-
2025-04-01price $115,000
-
2025-03-18price $125,000
-
2025-03-03price $135,000
-
2024-12-17historical
-
2024-12-16$170,000 Active
-
2018-03-15historical
-
2018-03-12soldstatus $29,000 Closed
-
2018-02-27status Pending
-
2018-02-20$30,000 Active
ⓘ Source: listings_history table (triggers on properties + properties_extension) + one-shot
backfill from property_details.listing_events for pre-trigger history.
Tax reassessment forecast CA · Resets to sale price
- Current annual tax
- $358 · $30/mo
- Projected year-2 tax
- $988 · $82/mo
- Expected delta
- +$630/yr (+$53/mo · 176.2%)
ⓘ Screening estimate from a state-policy table — verify with the county assessor before closing.
Climate risk First Street
- Flood 4/10 Moderate FEMA zone X (unshaded) · 22% chance over 30 yrs
- Wildfire 8/10 Severe
- Heat 6/10 Major 4 d/yr ≥97°F today · 9 d/yr by 30 yrs out
- Wind 1/10 Low
- Air quality 10/10 Extreme 28 unhealthy d/yr today · 33 by 30 yrs out
Nearby sold comps map
Loading sold comps map…
Walkable amenities ~0.75 mi
Loading nearby amenities…
Taxation est. · year 1
- Rental income
- $26,057
- − Mortgage interest
- −$7,282
- − Property taxes
- −$358
- − Insurance
- −$650
- − Repairs & maintenance
- −$2,085
- − Management
- −$2,085
- − Depreciation
- −$3,782
- Taxable income
- $9,816
- Est. tax owed @ 24.0%
- −$2,356
- After-tax cash flow
- $9,040/yr
For passive investors: Depreciation is non-cash, so a rental often shows a tax loss while cash-flowing — sheltering income. Rental losses are passive: they offset passive income freely, and up to $25,000/yr can offset ordinary (W-2) income if you actively participate and your MAGI is under $100k (phasing out to $0 by $150k); unused losses carry forward. On sale, claimed depreciation is recaptured at up to 25%, and gains may owe capital-gains tax (a 1031 exchange can defer both). Figures are a year-1 estimate at your 24.0% rate — not tax advice; consult a CPA.
Schools (NCES district)
- District
- Westside Union Elementary
- NCES district ID
- 0642120
- Math proficiency
- 34% ▲ 1.00%
- Reading proficiency
- 49% ▲ 1.00%
- Median HH income
- $80,763
- Composite
- 41.01/100
- National rank
- #7473
- State rank
- #565 of 1400 in CA
Livability — Quartz Hill
- Score
- 58/100
- State rank
- #703
- US rank
- #21208
Category grades
Schools grade is shown separately in the Schools card above.
Census & demographics
- Census place
- Quartz Hill, CA
- County
- Los Angeles County · 9,444,647 people
- Metro
- Los Angeles-Long Beach-Anaheim, CA
- Population (ZIP)
- 73,412
- Household income
- $106,903
- Rent vs Own
- Severe rent burden
- 1998.0
Population outlook (Los Angeles County) Hauer SSP2
- Today (2025)
- 10,940,515 people
- By 2030
- 11,256,481 · +2.9%
- By 2040
- 11,729,929 · +7.2%
- By 2050
- 11,948,407 · +9.2%
- By 2075
- 11,818,114 · +8.0%
- By 2100
- 10,842,928 · -0.9%
Race, ethnicity, and origin ACS 2023
- Neighborhood character
- Diverse neighborhood (Simpson 0.69)
- Race & ethnicity
- White 39% Hispanic / Latino 37% Two or more races 19% Black 13% Asian 5% Native American 1%
- Hispanic origin (detail)
- Mexican 28%
- Common ancestry
- Lithuanian 2% Slovak 1% Italian 1%
- Foreign-born
- 14% · Canada, China
- Languages at home
- 75% English-only · Spanish 19% Tagalog/Filipino 2% Arabic 1%
Political lean MEDSL · Los Angeles
- 2024 margin
- Solid D (+32.9) · D 64.8% · R 31.9% · Other 3.3%
- 2008→2024 swing
- -7.4pp toward R · 2008: 40.4pp · 2024: 32.9pp
- All cycles
- 2024: D+32.9 2020: D+44.2 2016: D+48.0 2012: D+40.0 2008: D+40.4
Not yet ingested
- Civics
- —
Market trends
- HPI YoY
- ▼ -268.64%
- Current HPI
- 357.0605
- Rent YoY
- ▼ -1.20%
- Metro
- Los Angeles-Long Beach-Anaheim, CA
- State GDP YoY
- ▲ 3.21%
- F500 in state
- 116
Industry mix (Fortune 500 HQ in CA)
| Industry | F500 HQs | Revenue |
|---|---|---|
| Technology | 27 | $1,492B |
|
||
| Financial Services | 3 | $174B |
|
||
| Retail | 3 | $44B |
|
||
| Insurance | 3 | $26B |
|
||
| Media / Entertainment | 2 | $115B |
|
||
| Pharmaceuticals / Biotech | 2 | $62B |
|
||
Price history
+333.3% since first listed12 events — show timeline
- 2026-03-25 Listed $130,000 AVMLS
- 2025-06-17 Price Changed $115,000 AVMLS
- 2025-04-25 Price Changed $125,000 AVMLS
- 2025-04-01 Price Changed $115,000 AVMLS
- 2025-03-18 Price Changed $125,000 AVMLS
- 2025-03-03 Price Changed $135,000 AVMLS
- 2024-12-17 Listing Removed — SDMLS
- 2024-12-16 Listed $170,000 SDMLS
- 2018-03-15 Listing Removed — AVMLS
- 2018-03-12 Sold (MLS) $29,000 AVMLS
- 2018-02-27 Pending — AVMLS
- 2018-02-20 Listed $30,000 AVMLS
Property tax history
+5.1%/yrLatest (2025): $358 · +5.1% YoY. Source: county tax records.
Cash-flow waterfall
monthlySold comps — $/sqft
last 12 mo · ≤1 miLoading sold comps…