2650 W Union Hills Dr · Phoenix, AZ
Flood risk 1/10 · Minimal
- FEMA flood zone
- X (shaded)
- Chance of flooding over 30 yrs
- 0.0%
- Est. flood insurance / yr
- $507 – $1,088
Fire risk 1/10 · Minimal
- Est. fire insurance / yr
- $610 – $1,132
Heat risk 8/10 · Major
- Hot days now (above 111°F)
- 5 days/yr
- Hot days in 30 yrs
- 14 days/yr
Wind risk 1/10 · Minimal
- Chance of severe wind over 30 yrs
- —
Air-quality risk 3/10 · Minor
- Unhealthy air days now
- 2 days/yr
- Unhealthy air days in 30 yrs
- 3 days/yr
Risk factors via First Street. Map © Google.
Why this score? — see what drove the B- grade
The composite is a weighted blend of 9 inputs, each scored 0–100. Each bar is that input's sub-score; the figure is the points it added to the 100-point composite (weight × sub-score).
- Cash flow +30.0/30.0
- 1% rule +10.0/10.0
- DSCR +10.0/10.0
- ARV discount +5.0/15.0
- Schools +4.7/10.0
- Livability +3.8/5.0
- Condition / age +2.5/5.0
- Rent growth +1.8/5.0
- Appreciation +0.0/10.0
$56,000
🖨 Deal sheet (PDF) 📄 Offer letter ✓ Due diligence
Listing remarks MLS
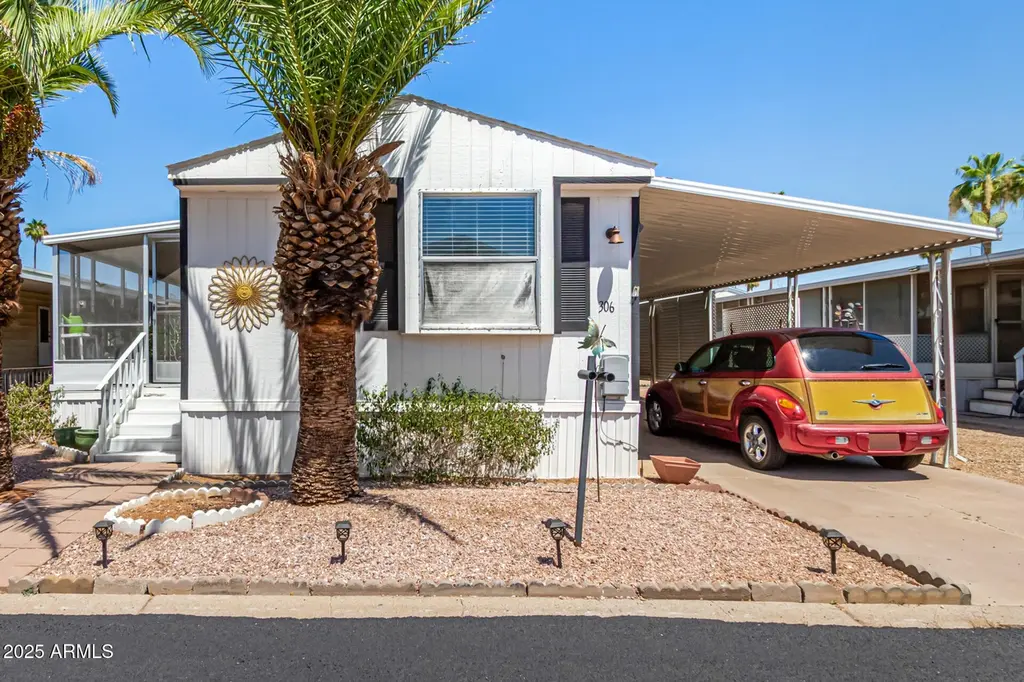
Welcome to our charming, spacious 3-bedroom, 2-full bath home, beautifully updated with a brand-new roof and freshly painted walls and cabinets throughout. This wonderful fixer-upper presents an excellent opportunity to personalize your dream home. Nestled within a secure, gated 55+ community, enjoy a lifestyle enriched with a wide array of amenities designed for comfort and active living.
Key facts
- Community pool
- Built 1969
Property features AI
Finance
- Other: Directions: Head west on W Union Hills Dr. Turn left to enter the community.
- HOA & community: Land lease (approximately $1,048 monthly); No association fees; Community pool; Community spa (heated); Golf access; Fitness center; Coin-operated laundry
Exterior
- Parking: Separate storage area
- Security: Gated community
- Utilities: City water; Public sewer
- Home design: Manufactured / Mobile home; Leasehold ownership
- Construction: Vertical siding; Wood frame construction; Painted exterior; Composition roof; Building area reported by owner
- Exterior features: Storage; Corner lot; Natural desert front; Natural desert back; Asphalt road access
Interior
- Kitchen: Refrigerator; Disposal; Built-in electric oven
- Bedrooms: 2 bedrooms
- Flooring: Carpet; Vinyl
- Bathrooms: 2 full bathrooms
- Heating & cooling: Electric heating; Central air; Ceiling fans
- Interior features: 3/4 bath in master bedroom; Storage
Neighborhood map
What this means for you Summary
Snapshot
- This is a 2-bed/2.0-bath land listed at $56k.
Deal economics
- At list price, monthly cash flow is $745 ($9k/yr) — positive.
- The deal already cash-flows at list — no discount required.
- Meets the 1% rule at list price ($1k rent vs $56k).
- Cap rate 22.3% vs local median 3.3% in Phoenix — top-decile yield for the area; either an underpriced asset or a hidden risk that comps aren't pricing in. Stress-test before assuming the spread holds.
Location & tenants
- Location reads 75/100 on livability (#16 in AZ, #3,924 nationally) — a middle-class / working-renter tenant base. Strengths: amenities A+, commute A+, housing A+; Watch: health & safety C-, crime F.
- Deer Valley Unified District (4246) (urban): math 50% / reading 55% proficiency, ranked #33 of 249 in AZ (top 13%) — acceptable for families but not a draw, mixed tenant base, ~2y average lease.
- Zoned schools: Park Meadows Elementary School (math 47% / reading 51%, grade D, #289 of 1,109 statewide, top 27%, 600 students, 54% FRL); Deer Valley Middle School (math 20% / reading 30%, grade F, #105 of 218 statewide, top 49%, 537 students, 65% FRL); Barry Goldwater High School (math 24% / reading 29%, grade F, #147 of 381 statewide, top 38%, 1,641 students, 52% FRL) — zoned schools average 57% FRL vs 21% district-wide (36 pts higher); higher-poverty schools than district average — tighter screening recommended.
- Zoned-school proficiency averages 34% at this address vs 52% district-wide (-19 pts) — the specific schools serving this property underperform the Deer Valley Unified District (4246) average; the district grade overstates school quality for this exact location.
- Market conditions: Rents soft (-2.8%/yr); 174 active listings in the ZIP; 40 comparable units currently listed for rent nearby; rentals at typical pace (median 17d on market — plan ~3-4 weeks tenant-placement turnaround); solid renter incomes; 36,011 units permitted in Maricopa County in 2024 (12,801 in 5+ unit buildings).
Forward outlook
- Local home prices are declining (-3.0%/yr); year-one equity from $387 of loan paydown is wiped out by about $2k of value loss. Plan a longer hold.
- Maricopa County population projected at +38% by 2050 — long-run rental-demand tailwind backs the buy-and-hold thesis.
- At projected returns (-3.0% appreciation + 0.0% rent growth), your $16k cash investment doubles in ~3 years — after that, you're playing with house money.
Negotiation context
- Only 1 days on market — expect competitive offers; lowballing is unlikely to land.
- 10 sale attempts since 7y ago with the ask held roughly flat each time — persistent listings suggest the price (not the market) is what's stuck; bring a comps-based counter.
Risks & watch-outs
- Climate carrying-cost: extreme-heat days projected 5→14/yr by 2055 (HVAC capex compounding) — expect insurance premiums to compound above CPI over the hold.
Questions for the listing agent
- Built in 1969 — when were the roof, HVAC, electrical panel, plumbing, and water heater last replaced?
- Is there a deadline driving the sale (1031 exchange, divorce, estate, relocation)? That informs how much negotiation room exists.
- Crime grade is F in this area — have there been break-ins, vandalism, or insurance claims at this property in the last 3 years? What carrier currently insures it and at what premium?
- What's the average days-on-market for RENTAL listings here right now (not sales)? A rising rental-DOM trend means longer vacancies and softer asking-rent achievability than the comps imply.
- What's the recent tenant-quality profile in this submarket — average credit score on applications, eviction rate, late-payment / NSF rate, and stable-employment percentage? A property-management company in the area should have these aggregated.
- How much new for-sale + rental construction is in the pipeline within 1–3 miles? Heavy new supply typically softens prices + rents 12–24 months out; constrained supply supports both.
Investment metrics
- 1% rule
- 2.56% ✓
- Cap rate
- 22.26%
- Cash-on-cash
- 57.02%
- DSCR
- 3.54
- GRM
- 3.3
CMA / ARV
- ARV (median comp)
- $53,000
- List price
- $56,000
- Delta
- 16.98%
- Verdict
- OVERPRICED
- Comps
- 9 within 1.0 mi
Projected returns pro-forma
-3.0% appreciation · 0.0% rent growth · sell at horizon
- IRR
- 52.0%
- Equity multiple
- 3.18×
- Total profit
- $34,201
- Equity at exit
- $8,350
- IRR
- 56.2%
- Equity multiple
- 5.77×
- Total profit
- $74,743
- Equity at exit
- $4,842
Cash invested: $15,680 (down + closing). Projections, not guarantees.
Landlord ↔ Tenant lean methodology
- Overall (STATE)
- 87 Strongly Landlord-Friendly
- State Arizona
- 87 Strongly Landlord-Friendly · R+3
- County
- — inherits STATE
- City
- — inherits STATE
ZIP-level market 85027
- Rents YoY
- -2.8%
- Active inventory
- 174
- Price-to-rent
- 3.3×
Monthly cashflow live
- Estimated rent
- $1,433 high interval (Pro) →
- Mortgage (P&I)
- −$294
- Tax est. 1.5%
- −$70 /mo · $840/yr
- Insurance
- −$23
- HOA
- −$0
- Vacancy / Maint / Mgmt
- −$301
- Net cashflow
- $745
Break-even live
Sensitivity live
| Price | -10% $784 | -5% $764 | +0% $745 | +5% $726 | +10% $706 |
|---|---|---|---|---|---|
| Rent | -10% $632 | -5% $688 | +0% $745 | +5% $802 | +10% $858 |
| Rate | -1.0pp $773 | -0.5pp $759 | base $745 | +0.5pp $731 | +1.0pp $716 |
UW: 25.0% down · 7.5% · 30yr · 1.5% tax · 5.0% vac · 8.0% maint · 8.0% mgmt
Financing live
Cash to close
- Down payment
- $14,000
- Closing costs
- $1,680
- Reserves months
- —
- Total cash needed
- —
Loan-product check · same deal, 3 products live
Conventional
25% down · 7.5% · 30yr
- Down + closing
- —
- Monthly P&I
- —
- Monthly cashflow
- —
- DSCR
- —
- Eligible?
- —
Personal DTI + credit; lowest rate.
DSCR
20% down · 8.5% · 30yr
- Down + closing
- —
- Monthly P&I
- —
- Monthly cashflow
- —
- DSCR
- —
- Eligible?
- —
No personal income docs; deal must DSCR.
Hard money
10% down · 12.0% · 12mo
- Down + closing
- —
- Monthly P&I
- —
- Monthly cashflow
- —
- DSCR
- —
- Eligible?
- —
Short-term bridge; refi at stabilization.
Rent comps 40 comps
| Address | Beds | Baths | Sqft | Rent | $/sqft | DOM | Units | Dist |
|---|---|---|---|---|---|---|---|---|
| 18410 N 27th Ave Phoenix, AZ | 1.0 | 1.0 | 600 | $1,051 | $1.75 | 26d | 1 | 0.30mi |
| 18250 N 25th Ave Phoenix, AZ | 1.0–3.0 | 1.0–2.0 | 992 | $1,729 | $1.74 | 1d | 18 | 0.41mi |
| 2929 W Yorkshire Dr Phoenix, AZ | 1.0–3.0 | 1.0–2.0 | 915 | $1,498 | $1.64 | 20d | 2 | 0.49mi |
| 17840 N Black Canyon Hwy Phoenix, AZ | 1.0–2.0 | 1.0–2.0 | 880 | $1,655 | $1.88 | 5d | 19 | 0.57mi |
| 3010 W Yorkshire Dr Phoenix, AZ | 1.0–3.0 | 1.0–2.0 | 975 | $1,444 | $1.48 | 4d | 80 | 0.62mi |
| 2039 W Union Hills Dr Unit 39-117 Phoenix, AZ | 2.0 | 1.0 | 1000 | $1,000 | $1.00 | 10d | 1 | 0.67mi |
| 2039 W Union Hills Dr Unit 39-143 Phoenix, AZ | 2.0 | 2.0 | 1100 | $1,345 | $1.22 | 10d | 1 | 0.67mi |
| 2039 W Union Hills Dr Unit 15-001 Phoenix, AZ | 2.0 | 2.0 | 1100 | $1,345 | $1.22 | 17d | 1 | 0.67mi |
| 2039 W Union Hills Dr Unit 15-204 Phoenix, AZ | 2.0 | 1.0 | 1000 | $1,245 | $1.25 | 17d | 1 | 0.67mi |
| 2020 W Union Hills Dr #254 Phoenix, AZ | 2.0 | 2.0 | 1049 | $1,650 | $1.57 | 46d | 1 | 0.70mi |
| 19940 N 23rd Ave Phoenix, AZ | 4.0 | 1.0–2.0 | 812 | $1,366 | $1.68 | 0d | 61 | 0.79mi |
| 3144 W Charleston Ave Phoenix, AZ | 3.0 | 2.0 | 1085 | $1,845 | $1.70 | 19d | 1 | 0.87mi |
| 20003 N 23rd Ave Phoenix, AZ | 2.0 | 2.0 | 860 | $1,440 | $1.67 | 26d | 1 | 0.89mi |
| 20003 N 23rd Ave Phoenix, AZ | 1.0 | 1.0 | 580 | $1,121 | $1.93 | 1d | 1 | 0.89mi |
| 20003 N 23rd Ave Phoenix, AZ | 1.0 | 1.0 | 620 | $1,132 | $1.83 | 24d | 1 | 0.89mi |
| 20003 N 23rd Ave Phoenix, AZ | 2.0 | 2.0 | 860 | $1,522 | $1.77 | 46d | 1 | 0.89mi |
| 18626 N 34th Ave #2 Phoenix, AZ | 2.0 | 2.5 | 570 | $1,595 | $2.80 | 46d | 1 | 0.94mi |
| 3411 W Morrow Dr #3 Phoenix, AZ | 2.0 | 1.5 | 1056 | $1,495 | $1.42 | 46d | 1 | 0.97mi |
| 18811 N 19th Ave Phoenix, AZ | 1.0–2.0 | 1.0–2.0 | 885 | $1,525 | $1.72 | 4d | 2 | 1.00mi |
| 18811 N 19th Ave Phoenix, AZ | 1.0–2.0 | 1.0–2.0 | 885 | $1,400 | $1.58 | 1d | 3 | 1.00mi |
| 2222 W Beardsley Rd Phoenix, AZ | 2.0 | 1.0–2.0 | 616 | $1,285 | $2.09 | 1d | 30 | 1.05mi |
| 20231 N 21st Ln Phoenix, AZ | 1.0 | 1.0 | 770 | $995 | $1.29 | 26d | 1 | 1.10mi |
| 20245 N 32nd Dr Phoenix, AZ | 1.0–2.0 | 1.0–2.0 | 834 | $1,530 | $1.83 | 1d | 11 | 1.19mi |
| 20808 N 27th Ave Phoenix, AZ | 1.0–3.0 | 1.0–2.0 | 962 | $1,560 | $1.62 | 1d | 15 | 1.21mi |
| 17609 N 19th Ave Unit 204 Phoenix, AZ | 2.0 | 2.0 | 935 | $1,199 | $1.28 | 46d | 1 | 1.23mi |
| 17609 N 19th Ave Apt 107 Phoenix, AZ | 2.0 | 2.0 | 935 | $1,325 | $1.42 | 5d | 1 | 1.24mi |
| 17609 N 19th Ave Unit 209 Phoenix, AZ | 2.0 | 2.0 | 935 | $1,099 | $1.18 | 26d | 1 | 1.24mi |
| 3202 W Bell Rd Phoenix, AZ | 1.0–2.0 | 1.0–2.0 | 719 | $1,299 | $1.81 | 0d | 33 | 1.27mi |
| 17216 N 33rd Ave Phoenix, AZ | 1.0–2.0 | 1.0–2.0 | 741 | $1,525 | $2.06 | 1d | 21 | 1.33mi |
| 17425 N 19th Ave Phoenix, AZ | 1.0–2.0 | 1.0–2.0 | 776 | $1,327 | $1.71 | 0d | 38 | 1.37mi |
| 2142 W Monona Dr Phoenix, AZ | 3.0 | 2.0 | 1092 | $1,790 | $1.64 | 24d | 1 | 1.37mi |
| 3420 W Danbury Dr Unit C113 Phoenix, AZ | 2.0 | 2.0 | 896 | $1,485 | $1.66 | 1d | 1 | 1.39mi |
| 20601 N 33rd Ave Phoenix, AZ | 3.0 | 2.0 | 1085 | $2,100 | $1.94 | 26d | 1 | 1.39mi |
| 3420 W Danbury Dr Phoenix, AZ | 1.0–2.0 | 1.0–2.0 | 810 | $1,485 | $1.83 | 26d | 2 | 1.39mi |
| 3420 W Danbury Dr Phoenix, AZ | 1.0–2.0 | 1.0–2.0 | 810 | $1,485 | $1.83 | 15d | 2 | 1.39mi |
| 3434 W Danbury Dr Unit A114 Phoenix, AZ | 2.0 | 2.0 | 896 | $1,485 | $1.66 | 26d | 1 | 1.41mi |
| 17211 N 35th Ave Phoenix, AZ | 1.0–2.0 | 1.0–2.0 | 827 | $1,500 | $1.81 | 20d | 2 | 1.41mi |
| 17239 N 19th Ave Phoenix, AZ | 1.0–2.0 | 1.0–2.0 | 801 | $1,371 | $1.71 | 1d | 34 | 1.44mi |
| 20401 N 19th Ave Phoenix, AZ | 1.0–2.0 | 1.0–2.0 | 834 | $1,637 | $1.96 | 1d | 12 | 1.44mi |
| 17211 N 35th Ave Unit A213 Phoenix, AZ | 1.0 | 1.0 | 758 | $1,495 | $1.97 | 46d | 1 | 1.45mi |
Listing history 34 events
-
2026-06-22remarks 627-char remark
-
2026-06-22pricedays on market $56,000 Active 1 DOM
-
2026-06-21days on market $62,000 Active 67 DOM
-
2026-06-18days on market $62,000 Active 64 DOM
-
2026-06-17days on market $62,000 Active 63 DOM
-
2026-06-16days on market $62,000 Active 62 DOM
-
2026-06-15days on market $62,000 Active 61 DOM
-
2026-06-13days on market $62,000 Active 59 DOM
-
2026-06-13days on market $62,000 Active 58 DOM
-
2026-06-09days on market $62,000 Active 55 DOM
-
2026-06-08days on market $62,000 Active 54 DOM
-
2026-06-07days on market $62,000 Active 53 DOM
-
2026-06-04days on market $62,000 Active 50 DOM
-
2026-06-03days on market $62,000 Active 49 DOM
-
2026-06-02days on market $62,000 Active 48 DOM
-
2026-06-01days on market $62,000 Active 47 DOM
-
2026-05-31days on market $62,000 Active 46 DOM
-
2026-04-15$62,000 Active 478-char remark
Show marketing remark (478 chars)
PRICED TO SELL! NEW ROOF 2026! Well cared for 2 bed 2 bath home in the quiet gated community of the Friendly Village of Orangewood. Great floor plan with split bedrooms, stainless steel appliances in the kitchen, wheelchair accessible entrance, laminate wood flooring throughout, his and her closets and an oversized enclosed patio for relaxing. Amenities include community pool, hot tub, golf course, gym and more! This property has it all to move in today! 55+ only community.
-
2026-04-03historical
-
2026-02-20status Active
-
2026-02-12historical Under Contract Accepting Backups
-
2025-12-03status Active
-
2025-12-03price $62,000
-
2025-12-01historical
-
2025-11-19historical $900
-
2025-10-18$900
-
2025-08-07price $65,000
-
2025-07-17$75,000 Active
-
2025-01-01historical
-
2024-12-04price $64,000
-
2024-06-08$65,000 Active
-
2019-08-16historical
-
2019-08-13$54,999 Active
-
1982-11-01soldstatus $6,923,468
ⓘ Source: listings_history table (triggers on properties + properties_extension) + one-shot
backfill from property_details.listing_events for pre-trigger history.
Climate risk First Street
- Flood 1/10 Low FEMA zone X (shaded) · 0% chance over 30 yrs
- Wildfire 1/10 Low
- Heat 8/10 Severe 5 d/yr ≥111°F today · 14 d/yr by 30 yrs out
- Wind 1/10 Low
- Air quality 3/10 Moderate 2 unhealthy d/yr today · 3 by 30 yrs out
Nearby sold comps map
Loading sold comps map…
Walkable amenities ~0.75 mi
Loading nearby amenities…
Taxation est. · year 1
- Rental income
- $17,196
- − Mortgage interest
- −$3,137
- − Property taxes
- −$840
- − Insurance
- −$280
- − Repairs & maintenance
- −$1,376
- − Management
- −$1,376
- − Depreciation
- −$1,629
- Taxable income
- $8,559
- Est. tax owed @ 24.0%
- −$2,054
- After-tax cash flow
- $6,887/yr
For passive investors: Depreciation is non-cash, so a rental often shows a tax loss while cash-flowing — sheltering income. Rental losses are passive: they offset passive income freely, and up to $25,000/yr can offset ordinary (W-2) income if you actively participate and your MAGI is under $100k (phasing out to $0 by $150k); unused losses carry forward. On sale, claimed depreciation is recaptured at up to 25%, and gains may owe capital-gains tax (a 1031 exchange can defer both). Figures are a year-1 estimate at your 24.0% rate — not tax advice; consult a CPA.
Schools (NCES district)
- District
- Deer Valley Unified District (4246)
- NCES district ID
- 0407750
- Math proficiency
- 50% ▼ -9.00%
- Reading proficiency
- 55% ▼ -6.00%
- Median HH income
- $72,516
- Composite
- 47.0/100
- National rank
- #2346
- State rank
- #33 of 249 in AZ
Livability — Phoenix
- Score
- 75/100
- State rank
- #16
- US rank
- #3924
Category grades
Schools grade is shown separately in the Schools card above.
Census & demographics
- Census place
- Phoenix, AZ
- County
- Maricopa County · 4,537,380 people
- City population
- 1,500,198
- Metro
- Phoenix-Mesa-Chandler, AZ
- Population (ZIP)
- 39,487
- Household income
- $76,605
- Rent vs Own
- Severe rent burden
- 1533.0
Population outlook (Maricopa County) Hauer SSP2
- Today (2025)
- 4,979,203 people
- By 2030
- 5,378,229 · +8.0%
- By 2040
- 6,156,598 · +23.6%
- By 2050
- 6,872,376 · +38.0%
- By 2075
- 8,401,270 · +68.7%
- By 2100
- 9,247,439 · +85.7%
Race, ethnicity, and origin ACS 2023
- Neighborhood character
- Diverse neighborhood (Simpson 0.58)
- Race & ethnicity
- White 61% Hispanic / Latino 22% Two or more races 13% Asian 7% Black 2% Native American 2%
- Hispanic origin (detail)
- Mexican 18% Puerto Rican 1%
- Common ancestry
- Lithuanian 2% Romanian 2% Italian 2%
- Foreign-born
- 16% · Canada, China
- Languages at home
- 77% English-only · Spanish 10% Other Indo-European 4% Other Asian/Pacific 3%
Political lean MEDSL · Maricopa
- 2024 margin
- Toss-up / Even · D 47.7% · R 51.2% · Other 1.1%
- 2008→2024 swing
- +7.1pp toward D · 2008: -10.6pp · 2024: -3.5pp
- All cycles
- 2024: R+3.5 2020: D+2.2 2016: R+3.5 2012: R+12.0 2008: R+10.6
Not yet ingested
- Civics
- —
Market trends
- HPI YoY
- ▼ -248.58%
- Current HPI
- 356.8851
- Rent YoY
- ▼ -2.75%
- Metro
- Phoenix-Mesa-Chandler, AZ
- State GDP YoY
- ▲ 4.54%
- F500 in state
- 20
Industry mix (Fortune 500 HQ in AZ)
| Industry | F500 HQs | Revenue |
|---|---|---|
| Technology | 2 | $13B |
|
||
| Mining / Metals | 1 | $23B |
|
||
| Environmental Services | 1 | $16B |
|
||
| Metals / Steel | 1 | $14B |
|
||
| Technology Distribution | 1 | $9B |
|
||
| Homebuilding | 1 | $8B |
|
||
Price history
-99.2% since first listed21 events — show timeline
- 2026-06-21 Relisted — ARMLS
- 2026-06-17 Listed $56,000 ARMLS
- 2026-06-17 Listing Removed — ARMLS
- 2026-05-26 Listed $27,500 FSBO.com
- 2026-04-15 Listed $62,000 ARMLS
- 2026-04-03 Listing Removed — ARMLS
- 2026-02-20 Relisted — ARMLS
- 2026-02-12 Contingent — ARMLS
- 2025-12-03 Relisted — ARMLS
- 2025-12-03 Price Changed $62,000 ARMLS
- 2025-12-01 Listing Removed — ARMLS
- 2025-11-19 Rental Removed $900 Avail
- 2025-10-18 Listed for Rent $900 Avail
- 2025-08-07 Price Changed $65,000 ARMLS
- 2025-07-17 Listed $75,000 ARMLS
- 2025-01-01 Listing Removed — ARMLS
- 2024-12-04 Price Changed $64,000 ARMLS
- 2024-06-08 Listed $65,000 ARMLS
- 2019-08-16 Listing Removed — ARMLS
- 2019-08-13 Listed $54,999 ARMLS
- 1982-11-01 Sold (Public Records) $6,923,468 Public Records
Property tax history
+1.9%/yrLatest (2025): $58,523 · +1.3% YoY. Source: county tax records.
Cash-flow waterfall
monthlySold comps — $/sqft
last 12 mo · ≤1 miLoading sold comps…