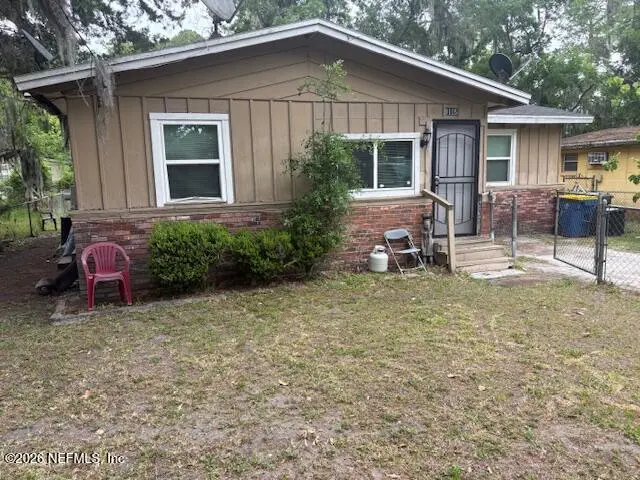
9115 12th Ave · Jacksonville, FL
Flood risk 7/10 · Major
- FEMA flood zone
- X (unshaded)
- Chance of flooding over 30 yrs
- 0.75%
- Est. flood insurance / yr
- $507 – $1,088
Fire risk 2/10 · Minimal
- Est. fire insurance / yr
- $947 – $1,759
Heat risk 9/10 · Severe
- Hot days now (above 107°F)
- 7 days/yr
- Hot days in 30 yrs
- 20 days/yr
Wind risk 9/10 · Severe
- Chance of severe wind over 30 yrs
- 99.0%
Air-quality risk 4/10 · Minor
- Unhealthy air days now
- 6 days/yr
- Unhealthy air days in 30 yrs
- 6 days/yr
Risk factors via First Street. Map © Google.
Why this score? — see what drove the D+ grade
The composite is a weighted blend of 9 inputs, each scored 0–100. Each bar is that input's sub-score; the figure is the points it added to the 100-point composite (weight × sub-score).
- Cash flow +22.9/30.0
- DSCR +7.4/10.0
- 1% rule +5.9/10.0
- Livability +4.2/5.0
- Schools +3.9/10.0
- Condition / age +2.5/5.0
- Rent growth +2.2/5.0
- ARV discount +0.0/15.0
- Appreciation +0.0/10.0
$135,000
🖨 Deal sheet 📄 Offer letter ✓ Due diligence
Listing remarks MLS
Investment property or 1st time home buyer. Large rooms, and rear yard, air conditioning and water softener installed within the last 2 years. No water/sewage bill!!
Key facts
- 5,227 sq ft lot
- Built 1962
- Listed 52 days
Property features AI
Finance
- HOA & community: Not a senior community
Exterior
- Parking: Additional off-street parking
- Security: Security fence; Smoke detector(s)
- Utilities: Sewer available
- Home design: Single family residence; One story; Faces west
- Construction: Frame construction with wood siding; Shingle roof
- Exterior features: Porch; Side porch; Security fence; Smoke detector(s); Back yard vinyl fencing; Irregular lot; City street frontage; Asphalt road surface
Interior
- Kitchen: Electric oven; Electric range; Microwave; Refrigerator; Water heater (electric)
- Bedrooms: 3 bedrooms
- Flooring: Carpet; Vinyl
- Bathrooms: 1 full bathroom
- Heating & cooling: Central heating; Electric heating; Hot water heating; Central air conditioning
- Interior features: Breakfast nook; Ceiling fan(s); Walk-in closet(s)
- Laundry & utility: Water softener (owned)
Neighborhood map
What this means for you Summary
Snapshot
- This is a 3-bed/1.0-bath single-family listed at $135k.
Deal economics
- At list price, monthly cash flow is $171 ($2k/yr) — positive.
- The deal already cash-flows at list — no discount required.
- Meets the 1% rule at list price ($1k rent vs $135k).
- Recommended offer: $131k (3.0% below list) — sets the bar for market timing.
- Cap rate 8.4% vs local median 4.0% in Jacksonville — top-decile yield for the area; either an underpriced asset or a hidden risk that comps aren't pricing in. Stress-test before assuming the spread holds.
Location & tenants
- Location reads 83/100 on livability (#50 in FL, #911 nationally) — a professional / high-income tenant draw. Strengths: amenities A+, commute A+, housing A+.
- Duval (urban): math 46% / reading 45% proficiency, ranked #48 of 73 in FL (top 66%) — families likely to look elsewhere, expect single-tenant / working-renter base with shorter leases.
- Market conditions: Rents soft (-1.4%/yr); 291 active listings in the ZIP; 40 comparable units currently listed for rent nearby; rentals at typical pace (median 24d on market — plan ~3-4 weeks tenant-placement turnaround); lower-income renter base — watch delinquency; 6,503 units permitted in Duval County in 2024 (1,131 in 5+ unit buildings).
- This rent runs 43% of the median local income ($41k/yr) — at the standard rent-burdened threshold; future hikes will face affordability resistance.
Forward outlook
- Local home prices are declining (-3.0%/yr); year-one equity from $933 of loan paydown is wiped out by about $4k of value loss. Plan a longer hold.
- Duval County population projected at +19% by 2050 — long-run rental-demand tailwind backs the buy-and-hold thesis.
Negotiation context
- It's been on market 52 days — a 3% lower offer ($131k) is reasonable based on typical stale-listing flexibility.
- 6 sale attempts since 14y ago with the ask held roughly flat each time — persistent listings suggest the price (not the market) is what's stuck; bring a comps-based counter.
- Current owner paid $43k; list at $135k implies a 214% gain — meaningful room to come down on a strong offer.
Risks & watch-outs
- Watch-outs: flood insurance adds $66/mo.
- Climate carrying-cost: major flood risk; severe wind risk, 99% chance of damaging wind over 30y; extreme-heat days projected 7→20/yr by 2055 (HVAC capex compounding) — expect insurance premiums to compound above CPI over the hold.
Questions for the listing agent
- It's been on market 52 days. Have you received any prior offers? Is the seller open to a 3% concession, seller financing, or rate buy-down credit?
- Built in 1962 — when were the roof, HVAC, electrical panel, plumbing, and water heater last replaced?
- What's the actual annual flood-insurance premium (NFIP or private), and is the property in a SFHA with mandatory coverage?
- Is there a deadline driving the sale (1031 exchange, divorce, estate, relocation)? That informs how much negotiation room exists.
- Schools are B-rated — typically a magnet for longer-tenancy family renters. What's the average tenant stay here, and is there a school-zone premium baked into asking?
- The area grade is low — what's the realistic commute time and amenity access for the typical tenant pool here? Any planned neighborhood developments (good or bad) we should know about?
- What's the average days-on-market for RENTAL listings here right now (not sales)? A rising rental-DOM trend means longer vacancies and softer asking-rent achievability than the comps imply.
- What's the recent tenant-quality profile in this submarket — average credit score on applications, eviction rate, late-payment / NSF rate, and stable-employment percentage? A property-management company in the area should have these aggregated.
- How much new for-sale + rental construction is in the pipeline within 1–3 miles? Heavy new supply typically softens prices + rents 12–24 months out; constrained supply supports both.
Investment metrics
- 1% rule
- 1.09% ✓
- Cap rate
- 8.41%
- Cash-on-cash
- 7.55%
- DSCR
- 1.34
- GRM
- 7.6
CMA / ARV
- ARV (on-the-fly)
- $113,360
- Comps found
- 12
Show comp detail 12 sales within ~0.75 mi
| Address | Dist | Beds/Ba | Sqft | Sold | Price | $/sf | Match |
|---|---|---|---|---|---|---|---|
| 8951 6th Ave | 0.34mi | 2/1.0 (-1) | 1,122 (+8%) | 3mo | $108,000 | $96 | 64 |
| 9224 10th Ave | 0.15mi | 4/2.0 (+1) | 1,170 (+12%) | 0mo | $169,000 | $144 | 63 |
| 9135 5th Ave | 0.33mi | 3/1.0 | 896 (-14%) | 1mo | $80,500 | $90 | 60 |
| 8949 8th Ave | 0.28mi | 3/2.0 | 1,152 (+11%) | 6mo | $125,000 | $109 | 60 |
| 8608 2nd Ave | 0.69mi | 3/2.0 | 1,045 (+0%) | 4mo | $155,000 | $148 | 60 |
| 1914 Grand St | 0.64mi | 3/1.0 | 1,084 (+4%) | 8mo | $115,000 | $106 | 57 |
| 3360 Lansdell Dr | 0.55mi | 3/2.0 | 1,124 (+8%) | 3mo | $215,000 | $191 | 55 |
| 9058 Jefferson Ave | 0.69mi | 3/1.0 | 936 (-10%) | 0mo | $94,250 | $101 | 51 |
| 6805 Restlawn Dr | 0.63mi | 3/2.0 | 1,134 (+9%) | 2mo | $139,999 | $123 | 50 |
| 6773 Restlawn Dr | 0.64mi | 3/1.0 | 1,153 (+11%) | 4mo | $110,000 | $95 | 49 |
| 7942 Helston Dr | 0.72mi | 3/2.0 | 1,170 (+12%) | 2mo | $202,000 | $173 | 39 |
| 8953 Adams Ave | 0.70mi | 3/2.0 | 1,176 (+13%) | 8mo | $90,000 | $77 | 35 |
Match score weights: distance 35% · size 25% · config 20% · recency 20%. Top-matched comps best support the ARV.
Projected returns pro-forma
-3.0% appreciation · 0.0% rent growth · sell at horizon
- IRR
- -11.5%
- Equity multiple
- 0.60×
- Total profit
- $-15,216
- Equity at exit
- $20,129
- IRR
- -7.6%
- Equity multiple
- 0.59×
- Total profit
- $-15,633
- Equity at exit
- $11,672
Cash invested: $37,800 (down + closing). Projections, not guarantees.
Landlord ↔ Tenant lean methodology
- Overall (STATE)
- 87 Strongly Landlord-Friendly
- State Florida
- 87 Strongly Landlord-Friendly · R+3
- County
- — inherits STATE
- City
- — inherits STATE
ZIP-level market 32208
- Home prices YoY
- -33.6%
- Rents YoY
- -1.4%
- Active inventory
- 291
- Price-to-rent
- 7.6×
Monthly cashflow live
- Estimated rent
- $1,473 high interval (Pro) →
- Mortgage (P&I)
- −$708
- Tax from tax record
- −$161 /mo · $1,935/yr
- Insurance
- −$56
- Flood insurance flood zone
- −$66 /mo · $798/yr
- HOA
- −$0
- Vacancy / Maint / Mgmt
- −$309
- Net cashflow
- $171
Break-even live
UW: 25.0% down · 7.5% · 30yr · 1.5% tax · 5.0% vac · 8.0% maint · 8.0% mgmt
Financing live
Cash to close
- Down payment
- $33,750
- Closing costs
- $4,050
- Reserves months
- —
- Total cash needed
- —
Loan-product check · same deal, 3 products live
Conventional
25% down · 7.5% · 30yr
- Down + closing
- —
- Monthly P&I
- —
- Monthly cashflow
- —
- DSCR
- —
- Eligible?
- —
Personal DTI + credit; lowest rate.
DSCR
20% down · 8.5% · 30yr
- Down + closing
- —
- Monthly P&I
- —
- Monthly cashflow
- —
- DSCR
- —
- Eligible?
- —
No personal income docs; deal must DSCR.
Hard money
10% down · 12.0% · 12mo
- Down + closing
- —
- Monthly P&I
- —
- Monthly cashflow
- —
- DSCR
- —
- Eligible?
- —
Short-term bridge; refi at stabilization.
Rent comps 40 comps
| Address | Beds | Baths | Sqft | Rent | $/sqft | DOM | Units | Dist |
|---|---|---|---|---|---|---|---|---|
| 9141 12th Ave Jacksonville, FL | 3.0 | 2.0 | 1209 | $1,598 | $1.32 | 20d | 1 | 0.05mi |
| 9148 13th Ave Jacksonville, FL | 3.0 | 1.0 | 1126 | $1,136 | $1.01 | 4d | 1 | 0.09mi |
| 9032 8th Ave Jacksonville, FL | 3.0 | 2.0 | 1300 | $1,500 | $1.15 | 23d | 1 | 0.19mi |
| 9050 7th Ave Jacksonville, FL | 3.0 | 1.0 | 896 | $1,485 | $1.66 | 23d | 1 | 0.22mi |
| 9346 10th Ave Jacksonville, FL | 3.0 | 1.0 | 985 | $1,825 | $1.85 | 23d | 1 | 0.29mi |
| 9037 6th Ave Jacksonville, FL | 3.0 | 2.0 | 1156 | $1,400 | $1.21 | 23d | 1 | 0.29mi |
| 9017 6th Ave Jacksonville, FL | 2.0 | 1.0 | 1038 | $1,098 | $1.06 | 23d | 1 | 0.30mi |
| 3015 Lansdell Dr Jacksonville, FL | 3.0 | 1.0 | 1150 | $1,350 | $1.17 | 23d | 1 | 0.32mi |
| 3250 Soutel Dr Jacksonville, FL | 3.0 | 2.0 | 1352 | $1,525 | $1.13 | 23d | 1 | 0.34mi |
| 9279 6th Ave Jacksonville, FL | 3.0 | 2.0 | 1150 | $1,245 | $1.08 | 4d | 1 | 0.34mi |
| 9131 4th Ave Jacksonville, FL | 3.0 | 2.0 | 1209 | $1,496 | $1.24 | 21d | 1 | 0.38mi |
| 8973 4th Ave Jacksonville, FL | 3.0 | 2.0 | 1230 | $1,438 | $1.17 | 14d | 1 | 0.41mi |
| 3344 Soutel Dr Jacksonville, FL | 3.0 | 1.0 | 1142 | $1,325 | $1.16 | 23d | 1 | 0.48mi |
| 2389 Hilly Rd Jacksonville, FL | 3.0 | 1.0 | 908 | $1,650 | $1.82 | 23d | 1 | 0.52mi |
| 8918 1st Ave Jacksonville, FL | 3.0 | 2.0 | 1435 | $1,321 | $0.92 | 16d | 1 | 0.55mi |
| 8721 4th Ave Jacksonville, FL | 3.0 | 1.5 | 1344 | $1,399 | $1.04 | 23d | 1 | 0.55mi |
| 8663 5th Ave Jacksonville, FL | 2.0 | 1.0 | 720 | $1,045 | $1.45 | 23d | 1 | 0.55mi |
| 9124 Adams Ave Jacksonville, FL | 3.0 | 3.0 | 1207 | $1,800 | $1.49 | 23d | 1 | 0.64mi |
| 8642 2nd Ave Jacksonville, FL | 3.0 | 2.0 | 1074 | $1,245 | $1.16 | 1d | 1 | 0.66mi |
| 1975 Rugby Rd Jacksonville, FL | 2.0 | 1.0 | 992 | $1,100 | $1.11 | 7d | 1 | 0.66mi |
| 8617 3rd Ave Jacksonville, FL | 3.0 | 1.0 | 1048 | $1,200 | $1.15 | 10d | 1 | 0.67mi |
| 8910 Adams Ave Jacksonville, FL | 4.0 | 2.0 | 1250 | $1,225 | $0.98 | 3d | 1 | 0.68mi |
| 9131 Jefferson Ave Jacksonville, FL | 3.0 | 1.0 | 910 | $1,350 | $1.48 | 4d | 1 | 0.71mi |
| 3848 Soutel Dr Jacksonville, FL | 3.0 | 2.0 | 1230 | $1,541 | $1.25 | 7d | 1 | 0.89mi |
| 2534 Aubrey Ave Jacksonville, FL | 4.0 | 2.0 | 759 | $1,250 | $1.65 | 23d | 1 | 0.91mi |
| 9565 Carbondale Dr W Unit B Jacksonville, FL | 3.0 | 2.0 | 1400 | $2,000 | $1.43 | 23d | 1 | 0.99mi |
| 2312 Palmdale St Jacksonville, FL | 3.0 | 2.0 | 972 | $1,231 | $1.27 | 23d | 1 | 0.99mi |
| 2818 Palmdale St Jacksonville, FL | 4.0 | 2.5 | 1484 | $1,900 | $1.28 | 23d | 1 | 1.04mi |
| 8516 Bermuda Rd Jacksonville, FL | 3.0 | 2.0 | 1492 | $1,625 | $1.09 | 20d | 1 | 1.15mi |
| 7927 Reid Ave Jacksonville, FL | 3.0 | 1.0 | 1055 | $1,500 | $1.42 | 23d | 1 | 1.20mi |
| 1021 Lake Forest Blvd Jacksonville, FL | 3.0 | 1.0 | 1393 | $1,290 | $0.93 | 3d | 1 | 1.28mi |
| 9658 Gibson Ave Jacksonville, FL | 3.0 | 1.5 | 977 | $1,225 | $1.25 | 23d | 1 | 1.30mi |
| 8253 Lexington Dr Jacksonville, FL | 3.0 | 1.0 | 910 | $1,330 | $1.46 | 23d | 1 | 1.36mi |
| 8509 Addison Rd Jacksonville, FL | 4.0 | 2.0 | 1494 | $1,675 | $1.12 | 23d | 1 | 1.36mi |
| 915 Wayne St Jacksonville, FL | 4.0 | 2.0 | 1220 | $1,313 | $1.08 | 3d | 1 | 1.38mi |
| 912 Saratoga Blvd Jacksonville, FL | 3.0 | 1.0 | 930 | $1,250 | $1.34 | 23d | 1 | 1.38mi |
| 8534 Addison Rd Jacksonville, FL | 4.0 | 2.0 | 1410 | $1,995 | $1.41 | 23d | 1 | 1.39mi |
| 2950 Bessent Rd Jacksonville, FL | 3.0 | 2.0 | 1446 | $1,779 | $1.23 | 21d | 1 | 1.42mi |
| 1010 Edgewood Ave W Jacksonville, FL | 4.0 | 2.0 | 1450 | $1,250 | $0.86 | 23d | 1 | 1.46mi |
| 1010 Edgewood Ave W Jacksonville, FL | 4.0 | 2.0 | 1450 | $1,250 | $0.86 | 14d | 1 | 1.46mi |
Listing history 12 events
-
2026-06-18days on market $135,000 Active 52 DOM
-
2026-06-17days on market $135,000 Active 51 DOM
-
2026-06-16days on market $135,000 Active 50 DOM
-
2026-06-15days on market $135,000 Active 49 DOM
-
2026-06-13days on market $135,000 Active 46 DOM
-
2026-06-10days on market $135,000 Active 43 DOM
-
2026-06-08days on market $135,000 Active 42 DOM
-
2026-06-07days on market $135,000 Active 41 DOM
-
2026-06-05days on market $135,000 Active 38 DOM
-
2026-06-03days on market $135,000 Active 37 DOM
-
2026-06-02remarks 182-char remark
-
2026-06-02$135,000 Active 36 DOM
ⓘ Source: listings_history table (triggers on properties + properties_extension) + one-shot
backfill from property_details.listing_events for pre-trigger history.
Tax reassessment forecast FL · Resets to sale price
- Current annual tax
- $1,935 · $161/mo
- Projected year-2 tax
- $1,935 · $161/mo
- Expected delta
- $0/yr ($0/mo · 0.0%)
ⓘ Screening estimate from a state-policy table — verify with the county assessor before closing.
Climate risk First Street
- Flood 7/10 Severe FEMA zone X (unshaded) · 75% chance over 30 yrs
- Wildfire 2/10 Low
- Heat 9/10 Extreme 7 d/yr ≥107°F today · 20 d/yr by 30 yrs out
- Wind 9/10 Extreme 99% chance of damaging wind over 30 yrs
- Air quality 4/10 Moderate 6 unhealthy d/yr today · 6 by 30 yrs out
Nearby sold comps map
Loading sold comps map…
Walkable amenities ~0.75 mi
Loading nearby amenities…
Taxation est. · year 1
- Rental income
- $17,671
- − Mortgage interest
- −$7,562
- − Property taxes
- −$1,935
- − Insurance
- −$1,472
- − Repairs & maintenance
- −$1,414
- − Management
- −$1,414
- − Depreciation
- −$3,927
- Taxable loss
- −$53
- Est. tax savings @ 24.0%
- +$13
- After-tax cash flow
- $2,070/yr
For passive investors: Depreciation is non-cash, so a rental often shows a tax loss while cash-flowing — sheltering income. Rental losses are passive: they offset passive income freely, and up to $25,000/yr can offset ordinary (W-2) income if you actively participate and your MAGI is under $100k (phasing out to $0 by $150k); unused losses carry forward. On sale, claimed depreciation is recaptured at up to 25%, and gains may owe capital-gains tax (a 1031 exchange can defer both). Figures are a year-1 estimate at your 24.0% rate — not tax advice; consult a CPA.
Schools (NCES district)
- District
- Duval
- NCES district ID
- 1200480
- Math proficiency
- 46% ▼ -11.00%
- Reading proficiency
- 45% ▼ -4.00%
- Median HH income
- $48,987
- Composite
- 38.97/100
- National rank
- #4076
- State rank
- #48 of 73 in FL
Livability — Jacksonville
- Score
- 83/100
- State rank
- #50
- US rank
- #911
Category grades
Schools grade is shown separately in the Schools card above.
Census & demographics
- Census place
- Jacksonville, FL
- County
- Duval County · 1,015,274 people
- City population
- 979,034
- Metro
- Jacksonville, FL
- Population (ZIP)
- 32,699
- Household income
- $41,324
- Rent vs Own
- Severe rent burden
- 1765.0
Population outlook (Duval County) Hauer SSP2
- Today (2025)
- 1,013,010 people
- By 2030
- 1,059,228 · +4.6%
- By 2040
- 1,141,439 · +12.7%
- By 2050
- 1,205,258 · +19.0%
- By 2075
- 1,324,282 · +30.7%
- By 2100
- 1,319,620 · +30.3%
Race, ethnicity, and origin ACS 2023
- Neighborhood character
- Predominantly Black (77%)
- Race & ethnicity
- Black 77% White 16% Two or more races 4% Hispanic / Latino 3%
- Common ancestry
- Italian 1%
- Foreign-born
- 2% · Canada
- Languages at home
- 97% English-only · Spanish 2%
Political lean MEDSL · Duval
- 2024 margin
- Toss-up / Even · D 48.7% · R 50.1% · Other 1.2%
- 2008→2024 swing
- +0.4pp no change · 2008: -1.9pp · 2024: -1.5pp
- All cycles
- 2024: R+1.5 2020: D+3.8 2016: R+1.5 2012: R+3.6 2008: R+1.9
Not yet ingested
- Civics
- —
Market trends
- HPI YoY
- ▼ -110.56%
- Current HPI
- 217.9706
- Rent YoY
- ▼ -1.36%
- Metro
- Jacksonville, FL
- State GDP YoY
- ▲ 3.28%
- F500 in state
- 36
Industry mix (Fortune 500 HQ in FL)
| Industry | F500 HQs | Revenue |
|---|---|---|
| Industrial Technology | 2 | $29B |
|
||
| Insurance | 2 | $17B |
|
||
| Retail | 1 | $60B |
|
||
| Technology Distribution | 1 | $58B |
|
||
| Homebuilding | 1 | $35B |
|
||
| Technology Manufacturing | 1 | $35B |
|
||
Price history
+214.0% since first listed14 events — show timeline
- 2026-04-27 Listed $135,000 realMLS
- 2022-10-31 Listing Removed — realMLS
- 2022-09-29 Relisted — realMLS
- 2022-09-17 Pending — realMLS
- 2022-09-15 Contingent — realMLS
- 2022-09-01 Relisted — realMLS
- 2022-09-01 Pending — realMLS
- 2022-08-23 Contingent — realMLS
- 2022-08-21 Listed $115,000 realMLS
- 2016-08-25 Listing Removed — realMLS
- 2016-04-15 Listed $52,500 realMLS
- 2012-06-21 Listed $110,000 realMLS
- 2000-09-28 Sold (Public Records) $43,000 Public Records
- 2000-09-28 Sold (Public Records) $43,000 Public Records
Property tax history
+6.5%/yrLatest (2025): $1,935 · +18.2% YoY. Source: county tax records.
Cash-flow waterfall
monthlySold comps — $/sqft
last 12 mo · ≤1 miLoading sold comps…