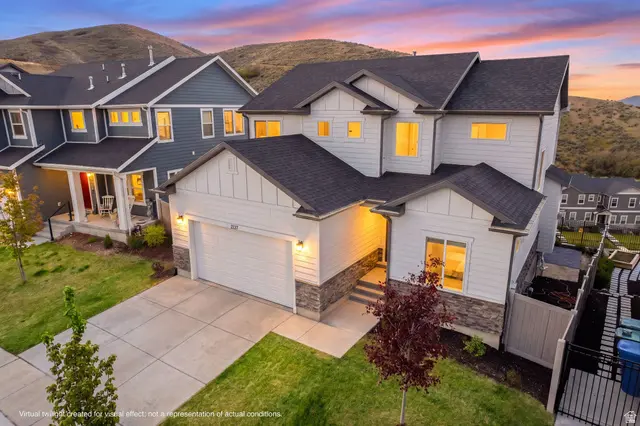
2137 W Northridge Dr · Lehi, UT
Flood risk 1/10 · Minimal
- FEMA flood zone
- X (unshaded)
- Chance of flooding over 30 yrs
- 0.0%
- Est. flood insurance / yr
- $473 – $860
Fire risk 7/10 · Major
- Est. fire insurance / yr
- $453 – $841
Heat risk 4/10 · Minor
- Hot days now (above 93°F)
- 7 days/yr
- Hot days in 30 yrs
- 21 days/yr
Wind risk 1/10 · Minimal
- Chance of severe wind over 30 yrs
- —
Air-quality risk 2/10 · Minimal
- Unhealthy air days now
- 2 days/yr
- Unhealthy air days in 30 yrs
- 2 days/yr
Risk factors via First Street. Map © Google.
Why this score? — see what drove the D- grade
The composite is a weighted blend of 9 inputs, each scored 0–100. Each bar is that input's sub-score; the figure is the points it added to the 100-point composite (weight × sub-score).
- Appreciation +10.0/10.0
- ARV discount +7.5/15.0
- Cash flow +6.2/30.0
- Livability +4.4/5.0
- Schools +4.2/10.0
- Rent growth +2.5/5.0
- Condition / age +2.5/5.0
- DSCR +0.5/10.0
- 1% rule +0.4/10.0
$775,000
🖨 Deal sheet 📄 Offer letter ✓ Due diligence
Listing remarks
* * Block Party Open House, Saturday, May 30th 11-1p. m. * * Beautiful Lehi home with stunning valley views in a highly desirable neighborhood, ideally situated above the inversion for cleaner air and clearer skies. This home offers thoughtful upgrades and a functional layout designed for comfortable living. Features include an A. O. Smith water softener with multi-stage filtration and UV filter, radon mitigation system, Ring security system with 6 cameras, and a 50-amp EV charger. The home is filled with natural light, featuring an open-concept layout that seamlessly connects the family room and kitchen. Large windows throughout bring in abundant natural light and showcase stunning view
Key facts
- 5,227 sq ft lot
- 2 garage spots
- Community pool
Property features AI
Finance
- Other: Subdivision: RIDGE
- HOA & community: Homeowners association with monthly fee ($94); Community amenities include clubhouse, fitness center, pool, tennis courts, playground, picnic area, biking and hiking trails; Pets permitted (subject to rules)
Exterior
- Parking: Attached garage; 2-car garage; 2 covered parking spaces; 2 open parking spaces; Total of 4 parking spaces
- Security: Video doorbell(s)
- Utilities: Natural gas connected; Electricity connected; Public sewer (connected); Culinary and irrigation water connected
- Home design: Two-story single-family home; Facing northeast; Currently built/standing
- Construction: Built with asphalt, stone, stucco, and cement siding; Asphalt roof; Full finished basement (100%)
- Exterior features: Basement entrance with walkout; Double-pane windows; Foyer entry; Sliding glass doors; Open patio; Fully fenced yard; Paved road and sidewalks; Automatic full sprinkler system; Drip irrigation (automatic); Mountain and valley views; Full landscaping
Interior
- Kitchen: Built-in range/oven; Microwave; Range hood; Refrigerator; Granite countertops
- Bedrooms: Includes multiple bedrooms (total rooms listed: 17); Basement level bedrooms possible (basement with full entrance and fully finished)
- Flooring: Carpet
- Bathrooms: 1 full bathroom; 2 three-quarter bathrooms; 1 partial/half bathroom
- Heating & cooling: Forced air heating (gas central); Central air conditioning
- Interior features: Wet bar; Walk-in closet(s); Den/office; Garbage disposal; Floor drains; Built-in range/oven; Vaulted ceilings; Granite countertops; Video doorbell(s); Blinds (full)
- Laundry & utility: Washer; Dryer (electric hookup); Water softener (owned)
Neighborhood map
What this means for you Summary
Snapshot
- This is a 3-bed/3.5-bath other listed at $775k.
Deal economics
- At list price, monthly cash flow is $-1k ($-17k/yr) — negative.
- To cash-flow at today's rent, offer at most $525k (32.2% below list).
- To meet the 1% rule (rent ≥ 1% of price), the offer needs to be $420k (45.9% below list).
- Recommended offer: $420k (45.9% below list) — sets the bar for 1% rule.
Location & tenants
- Location reads 88/100 on livability (#6 in UT, #242 nationally) — a professional / high-income tenant draw. Strengths: crime A+, commute A+, employment A+; Watch: cost of living F.
- Alpine District (suburban): math 45% / reading 50% proficiency, ranked #25 of 80 in UT (top 31%) — families likely to look elsewhere, expect single-tenant / working-renter base with shorter leases; only 18% free/reduced lunch — higher-income household profile.
- Zoned schools: Traverse Mountain School (math 62% / reading 52%, grade C+, #75 of 585 statewide, top 14%, 737 students, 11% FRL); Viewpoint Middle (1,790 students, 14% FRL); Lehi High (math 36% / reading 47%, grade F, #57 of 171 statewide, top 34%, 1,982 students, 12% FRL).
- Market conditions: 324 active listings in the ZIP; 3 comparable units currently listed for rent nearby; rentals at typical pace (median 24d on market — plan ~3-4 weeks tenant-placement turnaround); 6,326 units permitted in Utah County in 2024 (1,053 in 5+ unit buildings).
Forward outlook
- In year one you build about $83k of equity ($5k loan paydown + $78k appreciation (10.0% local appreciation)).
- Utah County population projected at +49% by 2050 — long-run rental-demand tailwind backs the buy-and-hold thesis.
- By year 2, paydown + projected appreciation supports a ~$133k cash-out refi (75% LTV) — recoverable capital for the next deal without selling this one.
Negotiation context
- It's been on market 44 days — a 3% lower offer ($752k) is reasonable based on typical stale-listing flexibility.
Risks & watch-outs
- Climate carrying-cost: major wildfire risk — expect insurance premiums to compound above CPI over the hold.
Questions for the listing agent
- What do current leases actually rent for vs. the listed asking? Can we see a recent rent roll and the last 12 months of T-12 income?
- It's been on market 44 days. Have you received any prior offers? Is the seller open to a 46% concession, seller financing, or rate buy-down credit?
- What does the HOA fee cover, when was the last increase, and are there any pending special assessments or reserve-fund shortfalls?
- Is there a deadline driving the sale (1031 exchange, divorce, estate, relocation)? That informs how much negotiation room exists.
- Schools are B-rated — typically a magnet for longer-tenancy family renters. What's the average tenant stay here, and is there a school-zone premium baked into asking?
- The area grade is low — what's the realistic commute time and amenity access for the typical tenant pool here? Any planned neighborhood developments (good or bad) we should know about?
- What's the average days-on-market for RENTAL listings here right now (not sales)? A rising rental-DOM trend means longer vacancies and softer asking-rent achievability than the comps imply.
- What's the recent tenant-quality profile in this submarket — average credit score on applications, eviction rate, late-payment / NSF rate, and stable-employment percentage? A property-management company in the area should have these aggregated.
- How much new for-sale + rental construction is in the pipeline within 1–3 miles? Heavy new supply typically softens prices + rents 12–24 months out; constrained supply supports both.
Investment metrics
- 1% rule
- 0.54% ✗
- Cap rate
- 4.10%
- Cash-on-cash
- -7.82%
- DSCR
- 0.65
- GRM
- 15.4
CMA / ARV
No comps found within radius.
Projected returns pro-forma
10.0% appreciation · 3.0% rent growth · sell at horizon
- IRR
- 18.8%
- Equity multiple
- 2.53×
- Total profit
- $331,740
- Equity at exit
- $698,181
- IRR
- 17.4%
- Equity multiple
- 5.83×
- Total profit
- $1,047,073
- Equity at exit
- $1,505,655
Cash invested: $217,000 (down + closing). Projections, not guarantees.
Landlord ↔ Tenant lean methodology
- Overall (STATE)
- 86 Strongly Landlord-Friendly
- State Utah
- 86 Strongly Landlord-Friendly · R+15
- County
- — inherits STATE
- City
- — inherits STATE
ZIP-level market 84048
- Home prices YoY
- 16.8%
- Active inventory
- 324
- Price-to-rent
- 15.4×
Monthly cashflow live
- Estimated rent
- $4,196 medium interval (Pro) →
- Mortgage (P&I)
- −$4,064
- Tax from tax record
- −$247 /mo · $2,969/yr
- Insurance
- −$323
- HOA
- −$94
- Vacancy / Maint / Mgmt
- −$881
- Net cashflow
- $-1,413
Break-even live
UW: 25.0% down · 7.5% · 30yr · 1.5% tax · 5.0% vac · 8.0% maint · 8.0% mgmt
Financing live
Cash to close
- Down payment
- $193,750
- Closing costs
- $23,250
- Reserves months
- —
- Total cash needed
- —
Loan-product check · same deal, 3 products live
Conventional
25% down · 7.5% · 30yr
- Down + closing
- —
- Monthly P&I
- —
- Monthly cashflow
- —
- DSCR
- —
- Eligible?
- —
Personal DTI + credit; lowest rate.
DSCR
20% down · 8.5% · 30yr
- Down + closing
- —
- Monthly P&I
- —
- Monthly cashflow
- —
- DSCR
- —
- Eligible?
- —
No personal income docs; deal must DSCR.
Hard money
10% down · 12.0% · 12mo
- Down + closing
- —
- Monthly P&I
- —
- Monthly cashflow
- —
- DSCR
- —
- Eligible?
- —
Short-term bridge; refi at stabilization.
Rent comps 3 comps
| Address | Beds | Baths | Sqft | Rent | $/sqft | DOM | Units | Dist |
|---|---|---|---|---|---|---|---|---|
| 1722 W Oakridge Cir Lehi, UT | 4.0 | 3.5 | 3494 | $5,500 | $1.57 | 2d | 1 | 0.34mi |
| 2227 W Aspen Wood Loop Lehi, UT | 3.0 | 2.5 | 4328 | $3,150 | $0.73 | 23d | 1 | 0.41mi |
| 2616 W Wildberry Ct Lehi, UT | 4.0 | 3.5 | 2400 | $2,695 | $1.12 | 23d | 1 | 0.72mi |
HOA detail
- Monthly dues
- $94 · $1,128/yr
- Likely covers
- watersecurity
Listing history 16 events
-
2026-06-18days on market $775,000 Active 44 DOM
-
2026-06-17days on market $775,000 Active 43 DOM
-
2026-06-16days on market $775,000 Active 42 DOM
-
2026-06-15days on market $775,000 Active 41 DOM
-
2026-06-14days on market $775,000 Active 39 DOM
-
2026-06-13days on market $775,000 Active 38 DOM
-
2026-06-10days on market $775,000 Active 36 DOM
-
2026-06-09days on market $775,000 Active 35 DOM
-
2026-06-08days on market $775,000 Active 34 DOM
-
2026-06-07days on market $775,000 Active 33 DOM
-
2026-06-03days on market $775,000 Active 29 DOM
-
2026-06-03days on market $775,000 Active 28 DOM
-
2026-06-01days on market $775,000 Active 27 DOM
-
2026-05-31days on market $775,000 Active 26 DOM
-
2026-05-31days on market $775,000 Active 25 DOM
-
2026-05-05$799,999 Active
ⓘ Source: listings_history table (triggers on properties + properties_extension) + one-shot
backfill from property_details.listing_events for pre-trigger history.
Tax reassessment forecast UT · Resets to sale price
- Current annual tax
- $2,969 · $247/mo
- Projected year-2 tax
- $5,115 · $426/mo
- Expected delta
- +$2,146/yr (+$179/mo · 72.3%)
ⓘ Screening estimate from a state-policy table — verify with the county assessor before closing.
Climate risk First Street
- Flood 1/10 Low FEMA zone X (unshaded) · 0% chance over 30 yrs
- Wildfire 7/10 Severe
- Heat 4/10 Moderate 7 d/yr ≥93°F today · 21 d/yr by 30 yrs out
- Wind 1/10 Low
- Air quality 2/10 Low 2 unhealthy d/yr today · 2 by 30 yrs out
Nearby sold comps map
Loading sold comps map…
Walkable amenities ~0.75 mi
Loading nearby amenities…
Taxation est. · year 1
- Rental income
- $50,355
- − Mortgage interest
- −$43,412
- − Property taxes
- −$2,969
- − Insurance
- −$3,875
- − Repairs & maintenance
- −$4,028
- − Management
- −$4,028
- − HOA
- −$1,128
- − Depreciation
- −$22,545
- Taxable loss
- −$31,631
- Est. tax savings @ 24.0%
- +$7,591
- After-tax cash flow
- $-9,370/yr
For passive investors: Depreciation is non-cash, so a rental often shows a tax loss while cash-flowing — sheltering income. Rental losses are passive: they offset passive income freely, and up to $25,000/yr can offset ordinary (W-2) income if you actively participate and your MAGI is under $100k (phasing out to $0 by $150k); unused losses carry forward. On sale, claimed depreciation is recaptured at up to 25%, and gains may owe capital-gains tax (a 1031 exchange can defer both). Figures are a year-1 estimate at your 24.0% rate — not tax advice; consult a CPA.
Schools (NCES district)
- District
- Alpine District
- NCES district ID
- 4900030
- Math proficiency
- 45% ▼ -4.00%
- Reading proficiency
- 50% ▼ -2.00%
- Median HH income
- $68,595
- Composite
- 42.48/100
- National rank
- #3213
- State rank
- #25 of 80 in UT
Livability — Lehi
- Score
- 88/100
- State rank
- #6
- US rank
- #242
Category grades
Schools grade is shown separately in the Schools card above.
Census & demographics
- Census place
- Lehi, UT
Population outlook (Utah County) Hauer SSP2
- Today (2025)
- 693,420 people
- By 2030
- 757,324 · +9.2%
- By 2040
- 893,178 · +28.8%
- By 2050
- 1,035,842 · +49.4%
- By 2075
- 1,376,733 · +98.5%
- By 2100
- 1,609,388 · +132.1%
Not yet ingested
- Political lean
- —
- Race & ethnicity
- —
- Common origin
- —
- Civics
- —
Market trends
- HPI YoY
- ▲ 37.66%
- Current HPI
- 262.22
- Rent YoY
- —
- Metro
- —
- State GDP YoY
- ▲ 3.54%
- F500 in state
- 2
Industry mix (Fortune 500 HQ in UT)
| Industry | F500 HQs | Revenue |
|---|---|---|
| Financial Services | 1 | $3B |
|
||
Price history
1 event — show timeline
- 2026-05-05 Listed $799,999 WFRMLS
Property tax history
+16.9%/yrLatest (2025): $2,969 · +9.7% YoY. Source: county tax records.
Cash-flow waterfall
monthlySold comps — $/sqft
last 12 mo · ≤1 miLoading sold comps…