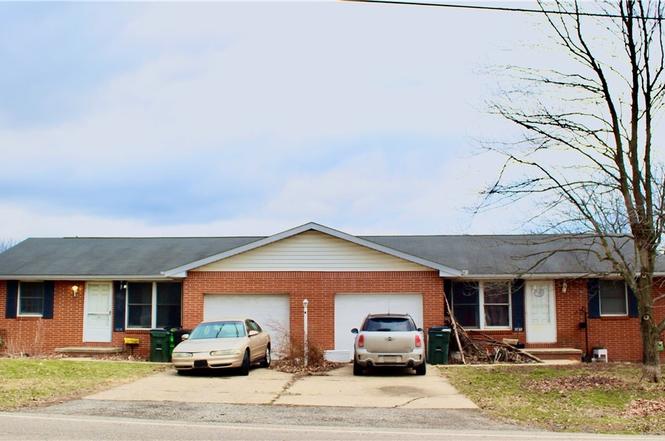
 Duplex
5620 Nave St SW · Richville, OH
Flood risk 1/10 · Minimal
- FEMA flood zone
- X (unshaded)
- Chance of flooding over 30 yrs
- 0.0%
- Est. flood insurance / yr
- $473 – $860
Fire risk 1/10 · Minimal
- Est. fire insurance / yr
- $713 – $1,323
Heat risk 3/10 · Minor
- Hot days now (above 96°F)
- 7 days/yr
- Hot days in 30 yrs
- 17 days/yr
Wind risk 1/10 · Minimal
- Chance of severe wind over 30 yrs
- 0.0%
Air-quality risk 2/10 · Minimal
- Unhealthy air days now
- 0 days/yr
- Unhealthy air days in 30 yrs
- 1 days/yr
Risk factors via First Street. Map © Google.
Why this score? — see what drove the D grade
The composite is a weighted blend of 9 inputs, each scored 0–100. Each bar is that input's sub-score; the figure is the points it added to the 100-point composite (weight × sub-score).
- Cash flow +14.1/30.0
- ARV discount +7.5/15.0
- Schools +5.8/10.0
- DSCR +4.3/10.0
- 1% rule +3.5/10.0
- Livability +3.2/5.0
- Rent growth +2.5/5.0
- Condition / age +2.5/5.0
- Appreciation +0.0/10.0
$254,000
🖨 Deal sheet 📄 Offer letter ✓ Due diligence
Multi-family units
County records classify this as Multi-Family (2-4 Unit). Listing-text estimate: 2 units. confirmed
Listing remarks MLS
Maintenance free all brick ranch duplex. 2 bedrooms each side with attached garage, additional driveway on one unit with shed. One unit rents for $670/mo. Tenant does mowing. Other unit rents for $695/mo. Great return on investment. Long term renters. HOA fee is $100/year. Handicap accessible.
Key facts
- 0.31 acre lot
- 2 garage spots
- Built 1976
Property features AI
Finance
- Other: Above-grade finished area reported as 2,002
- Financial info: Two leased 2-bedroom units with reported rents: $1,027.14 and $890.40
- HOA & community: No HOA information provided
Exterior
- Parking: Attached garage with 2 garage spaces; Direct access from garage
- Security: No security details provided
- Utilities: Public water; Public sewer
- Home design: Single-story building; One building on the parcel
- Construction: Built (year per public records); Asphalt/fiberglass roof
- Exterior features: Brick construction; 0.3053-acre lot
Interior
- Kitchen: No kitchen appliance details provided
- Bedrooms: Two 2-bedroom units (each unit has 2 bedrooms)
- Flooring: No flooring details provided
- Bathrooms: Each unit includes 2 bathrooms (total: full and half counts listed separately)
- Heating & cooling: Central air conditioning; Forced-air gas heating
- Interior features: Full unfinished basement
- Laundry & utility: No laundry or utility appliance details provided
Neighborhood map
What this means for you Summary
Snapshot
- This is a 2 × 2-bed/1.5-bath units multifamily listed at $254k.
Deal economics
- At list price, monthly cash flow is $36 ($427/yr) — positive. Per door: $18/mo.
- The deal already cash-flows at list — no discount required.
- To meet the 1% rule (rent ≥ 1% of price), the offer needs to be $215k (15.2% below list).
- Recommended offer: $215k (15.2% below list) — sets the bar for 1% rule.
Location & tenants
- Location reads 65/100 on livability (#739 in OH) — a middle-class / working-renter tenant base. Strengths: crime A+, cost of living A+, housing A+; Watch: schools F, amenities F, commute F.
- Perry Local (suburban): math 63% / reading 73% proficiency, ranked #173 of 656 in OH (top 26%) — acceptable for families but not a draw, mixed tenant base, ~2y average lease.
- Market conditions: 87 active listings in the ZIP; 528 units permitted in Stark County in 2024 (84 in 5+ unit buildings).
- This rent runs 44% of the median local income ($58k/yr) — at the standard rent-burdened threshold; future hikes will face affordability resistance.
Forward outlook
- Local home prices are declining (-3.0%/yr); year-one equity from $2k of loan paydown is wiped out by about $8k of value loss. Plan a longer hold.
- Stark County population projected to shrink 8% by 2050 — rents likely to lag national; underwrite the cash flow, not the appreciation.
Negotiation context
- It's been on market 116 days — a 9% lower offer ($231k) is reasonable based on typical stale-listing flexibility.
- 3 sale attempts since 18y ago; this cycle's ask has dropped $16k (6%) from the opening price — seller is motivated, your offer sets the floor, not the list.
- Current owner paid $140k; list at $254k implies a 81% gain — meaningful room to come down on a strong offer.
Questions for the listing agent
- It's been on market 116 days. Have you received any prior offers? Is the seller open to a 15% concession, seller financing, or rate buy-down credit?
- Can we see the unit-by-unit rent roll, current vacancy, and any below-market leases? What's the average tenancy length?
- What capital expenditures (roof, boiler, parking lot, exteriors) have been made in the last 5 years, and what's planned in the next 2?
- Built in 1976 — when were the roof, HVAC, electrical panel, plumbing, and water heater last replaced?
- Why hasn't it sold? Are there any deal-killer items the seller is aware of (foundation, flood, title, zoning, code violations)?
- Is there a deadline driving the sale (1031 exchange, divorce, estate, relocation)? That informs how much negotiation room exists.
- Schools are F-rated, which usually means shorter tenancies and higher turnover. Who's the typical renter profile here, and what's been the actual vacancy rate?
- The area grade is low — what's the realistic commute time and amenity access for the typical tenant pool here? Any planned neighborhood developments (good or bad) we should know about?
- What's the average days-on-market for RENTAL listings here right now (not sales)? A rising rental-DOM trend means longer vacancies and softer asking-rent achievability than the comps imply.
- What's the recent tenant-quality profile in this submarket — average credit score on applications, eviction rate, late-payment / NSF rate, and stable-employment percentage? A property-management company in the area should have these aggregated.
- How much new apartment / multifamily construction is in the pipeline within 1–3 miles? Heavy new supply (>2% of stock underway) typically softens rents 12–24 months out; light construction supports rent growth.
Investment metrics
- 1% rule
- 0.85% ✗
- Cap rate
- 6.46%
- Cash-on-cash
- 0.60%
- DSCR
- 1.03
- GRM
- 9.8
CMA / ARV
No comps found within radius.
Projected returns pro-forma
-3.0% appreciation · 3.0% rent growth · sell at horizon
- IRR
- -15.4%
- Equity multiple
- 0.45×
- Total profit
- $-38,916
- Equity at exit
- $37,872
- IRR
- -6.8%
- Equity multiple
- 0.56×
- Total profit
- $-31,061
- Equity at exit
- $21,961
Cash invested: $71,120 (down + closing). Projections, not guarantees.
Landlord ↔ Tenant lean methodology
- Overall (STATE)
- 73 Landlord-Friendly
- State Ohio
- 73 Landlord-Friendly · R+6
- County
- — inherits STATE
- City
- — inherits STATE
ZIP-level market 44706
- Active inventory
- 87
- Price-to-rent
- 19.7×
Monthly cashflow live
- Estimated rent
- $2,154 medium interval (Pro) →
- Mortgage (P&I)
- −$1,332
- Tax from tax record
- −$228 /mo · $2,739/yr
- Insurance
- −$106
- HOA
- −$0
- Vacancy / Maint / Mgmt
- −$452
- Net cashflow
- $36
Break-even live
2-unit breakdown (identical units grouped — click to expand)
| Units | Beds | Baths | Est. rent |
|---|---|---|---|
| 2× units | 2 | 1.5 | $2,154 |
| #1 | 2 | 1.5 | $1,077 |
| #2 | 2 | 1.5 | $1,077 |
| Total (2 units) | $2,154 | ||
UW: 25.0% down · 7.5% · 30yr · 1.5% tax · 5.0% vac · 8.0% maint · 8.0% mgmt
Financing live
Cash to close
- Down payment
- $63,500
- Closing costs
- $7,620
- Reserves months
- —
- Total cash needed
- —
Loan-product check · same deal, 3 products live
Conventional
25% down · 7.5% · 30yr
- Down + closing
- —
- Monthly P&I
- —
- Monthly cashflow
- —
- DSCR
- —
- Eligible?
- —
Personal DTI + credit; lowest rate.
DSCR
20% down · 8.5% · 30yr
- Down + closing
- —
- Monthly P&I
- —
- Monthly cashflow
- —
- DSCR
- —
- Eligible?
- —
No personal income docs; deal must DSCR.
Hard money
10% down · 12.0% · 12mo
- Down + closing
- —
- Monthly P&I
- —
- Monthly cashflow
- —
- DSCR
- —
- Eligible?
- —
Short-term bridge; refi at stabilization.
Listing history 10 events
-
2026-06-18days on market $254,000 Active 116 DOM
-
2026-06-17days on market $254,000 Active 115 DOM
-
2026-06-16days on market $254,000 Active 114 DOM
-
2026-06-15days on market $254,000 Active 113 DOM
-
2026-06-13days on market $254,000 Active 111 DOM
-
2026-06-12days on market $254,000 Active 110 DOM
-
2026-06-09days on market $254,000 Active 107 DOM
-
2026-06-08days on market $254,000 Active 106 DOM
-
2026-06-08remarks 699-char remark
-
2026-06-08$254,000 Active 105 DOM
ⓘ Source: listings_history table (triggers on properties + properties_extension) + one-shot
backfill from property_details.listing_events for pre-trigger history.
Tax reassessment forecast OH · Partial reset (capped growth)
- Current annual tax
- $2,739 · $228/mo
- Projected year-2 tax
- $3,351 · $279/mo
- Expected delta
- +$612/yr (+$51/mo · 22.3%)
ⓘ Screening estimate from a state-policy table — verify with the county assessor before closing.
Climate risk First Street
- Flood 1/10 Low FEMA zone X (unshaded) · 0% chance over 30 yrs
- Wildfire 1/10 Low
- Heat 3/10 Moderate 7 d/yr ≥96°F today · 17 d/yr by 30 yrs out
- Wind 1/10 Low 0% chance of damaging wind over 30 yrs
- Air quality 2/10 Low 0 unhealthy d/yr today · 1 by 30 yrs out
Nearby sold comps map
Loading sold comps map…
Walkable amenities ~0.75 mi
Loading nearby amenities…
Taxation est. · year 1
- Rental income
- $25,848
- − Mortgage interest
- −$14,228
- − Property taxes
- −$2,739
- − Insurance
- −$1,270
- − Repairs & maintenance
- −$2,068
- − Management
- −$2,068
- − Depreciation
- −$7,389
- Taxable loss
- −$3,914
- Est. tax savings @ 24.0%
- +$939
- After-tax cash flow
- $1,366/yr
For passive investors: Depreciation is non-cash, so a rental often shows a tax loss while cash-flowing — sheltering income. Rental losses are passive: they offset passive income freely, and up to $25,000/yr can offset ordinary (W-2) income if you actively participate and your MAGI is under $100k (phasing out to $0 by $150k); unused losses carry forward. On sale, claimed depreciation is recaptured at up to 25%, and gains may owe capital-gains tax (a 1031 exchange can defer both). Figures are a year-1 estimate at your 24.0% rate — not tax advice; consult a CPA.
Schools (NCES district)
- District
- Perry Local
- NCES district ID
- 3904992
- Math proficiency
- 63% ▼ -10.00%
- Reading proficiency
- 73% ▼ -4.00%
- Median HH income
- $51,700
- Composite
- 57.83/100
- National rank
- #1048
- State rank
- #173 of 656 in OH
Livability — Richville
- Score
- 65/100
- State rank
- #739
- US rank
- #13328
Category grades
Schools grade is shown separately in the Schools card above.
Census & demographics
- Census place
- Richville, OH
- County
- Stark County · 272,865 people
- City population
- 103,614
- Metro
- Canton-Massillon, OH
- Population (ZIP)
- 16,496
- Household income
- $58,228
- Rent vs Own
- Severe rent burden
- 502.0
Population outlook (Stark County) Hauer SSP2
- Today (2025)
- 373,708 people
- By 2030
- 371,245 · -0.7%
- By 2040
- 361,331 · -3.3%
- By 2050
- 345,290 · -7.6%
- By 2075
- 302,669 · -19.0%
- By 2100
- 238,870 · -36.1%
Race, ethnicity, and origin ACS 2023
- Neighborhood character
- Predominantly White (84%)
- Race & ethnicity
- White 84% Black 8% Two or more races 6% Hispanic / Latino 3%
- Common ancestry
- Romanian 4% Italian 3% Lithuanian 2%
- Foreign-born
- 1% · Canada
- Languages at home
- 98% English-only · Spanish 2%
Political lean MEDSL · Stark
- 2024 margin
- Strong R (+21.9) · D 38.6% · R 60.5%
- 2008→2024 swing
- -27.4pp toward R · 2008: 5.5pp · 2024: -21.9pp
- All cycles
- 2024: R+21.9 2020: R+18.5 2016: R+17.4 2012: R+0.4 2008: D+5.5
Not yet ingested
- Civics
- —
Market trends
- HPI YoY
- ▼ -156.35%
- Current HPI
- 239.851
- Rent YoY
- —
- Metro
- Canton-Massillon, OH
- State GDP YoY
- ▲ 1.98%
- F500 in state
- 48
Industry mix (Fortune 500 HQ in OH)
| Industry | F500 HQs | Revenue |
|---|---|---|
| Insurance | 3 | $145B |
|
||
| Industrial Machinery | 3 | $49B |
|
||
| Financial Services | 3 | $24B |
|
||
| Consumer Goods | 2 | $93B |
|
||
| Aerospace / Defense | 2 | $47B |
|
||
| Utilities | 2 | $33B |
|
||
Price history
+84.1% since first listed12 events — show timeline
- 2026-05-14 Price Changed $254,000 MLSNOW
- 2026-04-14 Price Changed $259,000 MLSNOW
- 2026-03-30 Price Changed $264,900 MLSNOW
- 2026-03-06 Price Changed $266,500 MLSNOW
- 2026-02-22 Listed $269,900 MLSNOW
- 2015-05-15 Sold (Public Records) $140,000 Public Records
- 2015-05-15 Sold (MLS) $140,000 MLSNOW
- 2015-04-07 Pending — MLSNOW
- 2015-03-12 Listed $139,900 MLSNOW
- 2009-04-27 Listing Removed — MLSNOW
- 2008-10-27 Listed $144,900 MLSNOW
- 2000-10-23 Sold (Public Records) $138,000 Public Records
Property tax history
+2.3%/yrLatest (2024): $2,739 · +0.4% YoY. Source: county tax records.
Cash-flow waterfall
monthlySold comps — $/sqft
last 12 mo · ≤1 miLoading sold comps…