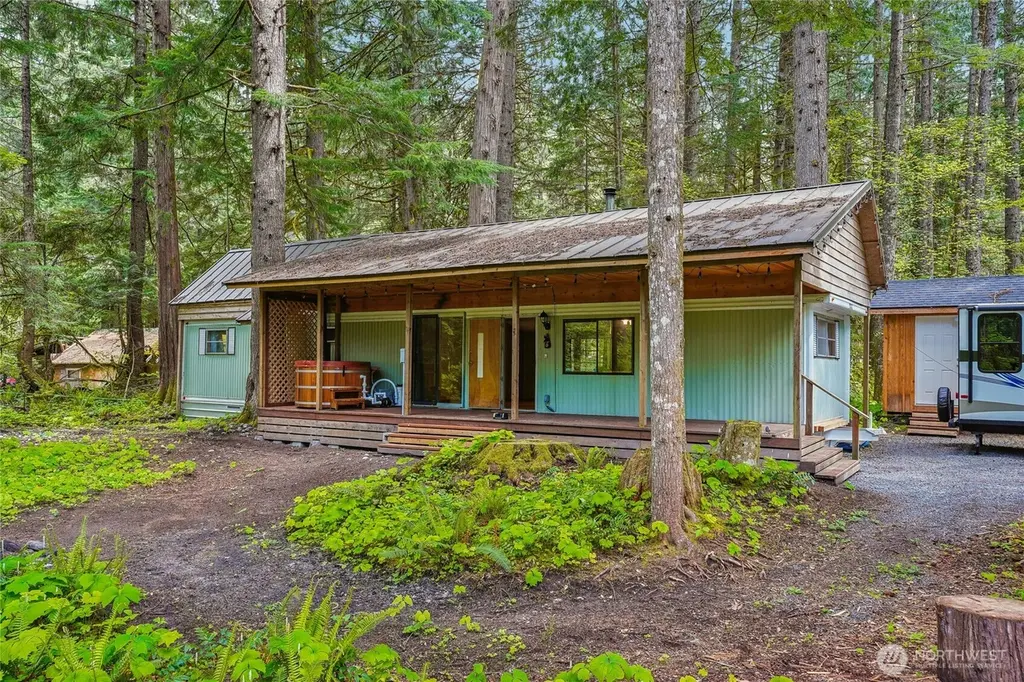
56620 381st Avenue Ct E · Ashford, WA
Flood risk 1/10 · Minimal
- FEMA flood zone
- X (unshaded)
- Chance of flooding over 30 yrs
- 0.0%
- Est. flood insurance / yr
- $507 – $1,088
Fire risk 3/10 · Minor
- Est. fire insurance / yr
- $604 – $1,122
Heat risk 1/10 · Minimal
- Hot days now (above 85°F)
- 11 days/yr
- Hot days in 30 yrs
- 23 days/yr
Wind risk 1/10 · Minimal
- Chance of severe wind over 30 yrs
- —
Air-quality risk 6/10 · Moderate
- Unhealthy air days now
- 7 days/yr
- Unhealthy air days in 30 yrs
- 9 days/yr
Risk factors via First Street. Map © Google.
Why this score? — see what drove the C+ grade
The composite is a weighted blend of 9 inputs, each scored 0–100. Each bar is that input's sub-score; the figure is the points it added to the 100-point composite (weight × sub-score).
- Cash flow +23.6/30.0
- DSCR +7.6/10.0
- ARV discount +7.2/15.0
- 1% rule +6.1/10.0
- Appreciation +6.0/10.0
- Schools +4.8/10.0
- Livability +2.8/5.0
- Rent growth +2.5/5.0
- Condition / age +2.5/5.0
$232,000
🖨 Deal sheet 📄 Offer letter ✓ Due diligence
Listing remarks
Welcome to your peaceful Mount Rainier escape — where mornings begin with coffee in the crisp mountain air, surrounded by towering evergreens and the quiet sounds of nature. Tucked away from the noise of the city, this cozy cabin retreat offers the slower pace and privacy so many dream about. Spend your days hiking nearby trails, fishing, exploring the outdoors, or simply enjoying the stillness and wildlife around you. Then come home to unwind beneath the trees in the brand new cedar soaking tub under the stars. Designed for comfortable off-grid style living, the property features a whole-home generator, propane system, Starlink internet, and space for guests with an RV hookup —
Key facts
- Whole-home generator
- Propane system
- Cedar soaking tub
Tags
Property features AI
Finance
- Other: Buyer brokerage compensation: 2.5%; Property listed as residential, manufactured on land
- Financial info: Listing terms: Cash, Conventional, see remarks
- HOA & community: Community features: park, trails
Exterior
- Parking: 3 uncovered parking spaces; Driveway; RV parking
- Security: Partially fenced
- Utilities: Water from community / shared well (Washington Water); Septic tank; Power from Lewis County PUD; Electric, propane, and wood energy sources; Starlink internet and cable connected
- Home design: Manufactured home on land (single wide); One story; Main entry; Southeast facing; Has view; Good condition
- Construction: Metal roof; Metal/vinyl and wood exterior; Tie-down foundation; Manufactured house, effective year built 1980
- Exterior features: Deck; Partially fenced; Hot tub / spa; Outbuildings; RV parking; High-speed internet; Wood/brush vegetation; Wooded setting; Cul-de-sac lot; Open space nearby; Paved access; Value in land
Interior
- Kitchen: Double oven; Microwave; Refrigerator; Stove / Range
- Bedrooms: 2 bedrooms (both on the main level)
- Flooring: Laminate
- Bathrooms: 1 full bathroom (main level); 1 bathtub; 1 shower
- Heating & cooling: Forced air heating; Wood stove / freestanding stove; No central cooling
- Interior features: Fireplace; Hot tub / spa; Water heater; Wired for generator
- Laundry & utility: Washer; Dryer; Electric water heater (outside, east side of home)
Neighborhood map
What this means for you Summary
Snapshot
- This is a 2-bed/1.0-bath manufactured listed at $232k.
Deal economics
- At list price, monthly cash flow is $437 ($5k/yr) — positive.
- The deal already cash-flows at list — no discount required.
- Meets the 1% rule at list price ($3k rent vs $232k).
- Recommended offer: $229k (1.5% below list) — sets the bar for market timing.
Location & tenants
- Location reads 56/100 on livability (#543 in WA) — a working-class tenant base; expect higher turnover. Strengths: crime A, cost of living A-, housing B; Watch: employment C-, health & safety C-, amenities F.
- Eatonville School District (rural): math 45% / reading 60% proficiency, ranked #116 of 291 in WA (top 40%) — acceptable for families but not a draw, mixed tenant base, ~2y average lease.
- Zoned schools: Columbia Crest A-Stem Academy (143 students, 66% FRL); Eatonville High School (560 students, 41% FRL) — zoned schools average 54% FRL vs 32% district-wide (22 pts higher); higher-poverty schools than district average — tighter screening recommended.
- Market conditions: 42 active listings in the ZIP; 3,209 units permitted in Pierce County in 2024 (1,269 in 5+ unit buildings).
Forward outlook
- In year one you build about $6k of equity ($2k loan paydown + $5k appreciation (2.0% local appreciation)).
- Pierce County population projected at +26% by 2050 — long-run rental-demand tailwind backs the buy-and-hold thesis.
- At projected returns (2.0% appreciation + 3.0% rent growth), your $65k cash investment doubles in ~5 years — after that, you're playing with house money.
- By year 6, paydown + projected appreciation supports a ~$34k cash-out refi (75% LTV) — recoverable capital for the next deal without selling this one.
Negotiation context
- It's been on market 16 days — a 2% lower offer ($229k) is reasonable based on typical stale-listing flexibility.
- Current owner paid $192k; 21% above their basis — modest negotiation headroom, anchor on the comps not their cost.
Questions for the listing agent
- Built in 1968 — when were the roof, HVAC, electrical panel, plumbing, and water heater last replaced?
- Is there a deadline driving the sale (1031 exchange, divorce, estate, relocation)? That informs how much negotiation room exists.
- Schools are F-rated, which usually means shorter tenancies and higher turnover. Who's the typical renter profile here, and what's been the actual vacancy rate?
- What's the average days-on-market for RENTAL listings here right now (not sales)? A rising rental-DOM trend means longer vacancies and softer asking-rent achievability than the comps imply.
- What's the recent tenant-quality profile in this submarket — average credit score on applications, eviction rate, late-payment / NSF rate, and stable-employment percentage? A property-management company in the area should have these aggregated.
- How much new for-sale + rental construction is in the pipeline within 1–3 miles? Heavy new supply typically softens prices + rents 12–24 months out; constrained supply supports both.
Investment metrics
- 1% rule
- 1.11% ✓
- Cap rate
- 8.55%
- Cash-on-cash
- 8.07%
- DSCR
- 1.36
- GRM
- 7.5
CMA / ARV
- ARV (on-the-fly)
- $230,552
- Comps found
- 2
Show comp detail 2 sales within ~0.75 mi
| Address | Dist | Beds/Ba | Sqft | Sold | Price | $/sf | Match |
|---|---|---|---|---|---|---|---|
| 56620 381st Avenue Ct E | 0.00mi | 2/1.0 | 720 (+1%) | 0mo | $232,000 | $322 | 99 |
| 56620 381st Ave Ct E | 0.00mi | 2/1.0 | 720 (+1%) | 21mo | $192,500 | $267 | 82 |
Match score weights: distance 35% · size 25% · config 20% · recency 20%. Top-matched comps best support the ARV.
Projected returns pro-forma
2.02% appreciation · 3.0% rent growth · sell at horizon
- IRR
- 12.5%
- Equity multiple
- 1.68×
- Total profit
- $43,979
- Equity at exit
- $91,728
- IRR
- 15.3%
- Equity multiple
- 3.05×
- Total profit
- $132,986
- Equity at exit
- $132,261
Cash invested: $64,960 (down + closing). Projections, not guarantees.
Landlord ↔ Tenant lean methodology
- Overall (STATE)
- 28 Tenant-Leaning
- State Washington
- 28 Tenant-Leaning · D+8
- County
- — inherits STATE
- City
- — inherits STATE
ZIP-level market 98304
- Home prices YoY
- 0.7%
- Active inventory
- 42
- Price-to-rent
- 7.5×
Monthly cashflow live
- Estimated rent
- $2,583 medium interval (Pro) →
- Mortgage (P&I)
- −$1,217
- Tax est. 1.5%
- −$290 /mo · $3,480/yr
- Insurance
- −$97
- HOA
- −$0
- Vacancy / Maint / Mgmt
- −$542
- Net cashflow
- $437
Break-even live
UW: 25.0% down · 7.5% · 30yr · 1.5% tax · 5.0% vac · 8.0% maint · 8.0% mgmt
Financing live
Cash to close
- Down payment
- $58,000
- Closing costs
- $6,960
- Reserves months
- —
- Total cash needed
- —
Loan-product check · same deal, 3 products live
Conventional
25% down · 7.5% · 30yr
- Down + closing
- —
- Monthly P&I
- —
- Monthly cashflow
- —
- DSCR
- —
- Eligible?
- —
Personal DTI + credit; lowest rate.
DSCR
20% down · 8.5% · 30yr
- Down + closing
- —
- Monthly P&I
- —
- Monthly cashflow
- —
- DSCR
- —
- Eligible?
- —
No personal income docs; deal must DSCR.
Hard money
10% down · 12.0% · 12mo
- Down + closing
- —
- Monthly P&I
- —
- Monthly cashflow
- —
- DSCR
- —
- Eligible?
- —
Short-term bridge; refi at stabilization.
Listing history 8 events
-
2026-06-07statusdays on market $232,000 Pending 16 DOM
-
2026-06-04days on market $232,000 Active 14 DOM
-
2026-06-03days on market $232,000 Active 13 DOM
-
2026-06-02days on market $232,000 Active 12 DOM
-
2026-06-01days on market $232,000 Active 11 DOM
-
2026-05-31days on market $232,000 Active 10 DOM
-
2026-05-21$232,000 Active
-
2024-09-26soldstatus $192,500
ⓘ Source: listings_history table (triggers on properties + properties_extension) + one-shot
backfill from property_details.listing_events for pre-trigger history.
Climate risk First Street
- Flood 1/10 Low FEMA zone X (unshaded) · 0% chance over 30 yrs
- Wildfire 3/10 Moderate
- Heat 1/10 Low 11 d/yr ≥85°F today · 23 d/yr by 30 yrs out
- Wind 1/10 Low
- Air quality 6/10 Major 7 unhealthy d/yr today · 9 by 30 yrs out
Nearby sold comps map
Loading sold comps map…
Walkable amenities ~0.75 mi
Loading nearby amenities…
Taxation est. · year 1
- Rental income
- $30,990
- − Mortgage interest
- −$12,996
- − Property taxes
- −$3,480
- − Insurance
- −$1,160
- − Repairs & maintenance
- −$2,479
- − Management
- −$2,479
- − Depreciation
- −$6,749
- Taxable income
- $1,647
- Est. tax owed @ 24.0%
- −$395
- After-tax cash flow
- $4,847/yr
For passive investors: Depreciation is non-cash, so a rental often shows a tax loss while cash-flowing — sheltering income. Rental losses are passive: they offset passive income freely, and up to $25,000/yr can offset ordinary (W-2) income if you actively participate and your MAGI is under $100k (phasing out to $0 by $150k); unused losses carry forward. On sale, claimed depreciation is recaptured at up to 25%, and gains may owe capital-gains tax (a 1031 exchange can defer both). Figures are a year-1 estimate at your 24.0% rate — not tax advice; consult a CPA.
Schools (NCES district)
- District
- Eatonville School District
- NCES district ID
- 5302370
- Math proficiency
- 45% ▼ -1.00%
- Reading proficiency
- 60% ▲ 1.00%
- Median HH income
- $58,370
- Composite
- 47.54/100
- National rank
- #4971
- State rank
- #116 of 291 in WA
Livability — Ashford
- Score
- 56/100
- State rank
- #543
- US rank
- #22815
Category grades
Schools grade is shown separately in the Schools card above.
Census & demographics
- Population (ZIP)
- 867
Population outlook (Pierce County) Hauer SSP2
- Today (2025)
- 956,648 people
- By 2030
- 1,010,862 · +5.7%
- By 2040
- 1,113,170 · +16.4%
- By 2050
- 1,206,524 · +26.1%
- By 2075
- 1,436,425 · +50.2%
- By 2100
- 1,563,654 · +63.5%
Race, ethnicity, and origin ACS 2023
- Neighborhood character
- Predominantly White (82%)
- Race & ethnicity
- White 82% Hispanic / Latino 12% Two or more races 9% Asian 2%
- Hispanic origin (detail)
- Mexican 5%
- Common ancestry
- Portuguese 11% Italian 7% English 6%
- Foreign-born
- 3%
- Languages at home
- 92% English-only · Spanish 5% Other Asian/Pacific 4%
Political lean MEDSL · Pierce
- 2024 margin
- D (+10.8) · D 53.9% · R 43.1% · Other 3.0%
- 2008→2024 swing
- -1.4pp toward R · 2008: 12.2pp · 2024: 10.8pp
- All cycles
- 2024: D+10.8 2020: D+11.2 2016: D+7.5 2012: D+11.0 2008: D+12.2
Not yet ingested
- Civics
- —
Market trends
- HPI YoY
- ▲ 2.02%
- Current HPI
- 289.5128
- Rent YoY
- —
- Metro
- —
- State GDP YoY
- ▲ 4.65%
- F500 in state
- 22
Industry mix (Fortune 500 HQ in WA)
| Industry | F500 HQs | Revenue |
|---|---|---|
| Retail | 2 | $269B |
|
||
| Technology / Retail | 1 | $638B |
|
||
| Technology | 1 | $245B |
|
||
| Telecommunications | 1 | $38B |
|
||
| Food / Beverage | 1 | $36B |
|
||
| Automotive / Trucks | 1 | $34B |
|
||
Price history
+20.5% since first listed2 events — show timeline
- 2026-05-21 Listed $232,000 NWMLS as Distributed by MLS Grid
- 2024-09-26 Sold (Public Records) $192,500 Public Records
Property tax history
+10.3%/yrLatest (2026): $192 · +19.2% YoY. Source: county tax records.
Cash-flow waterfall
monthlySold comps — $/sqft
last 12 mo · ≤1 miLoading sold comps…