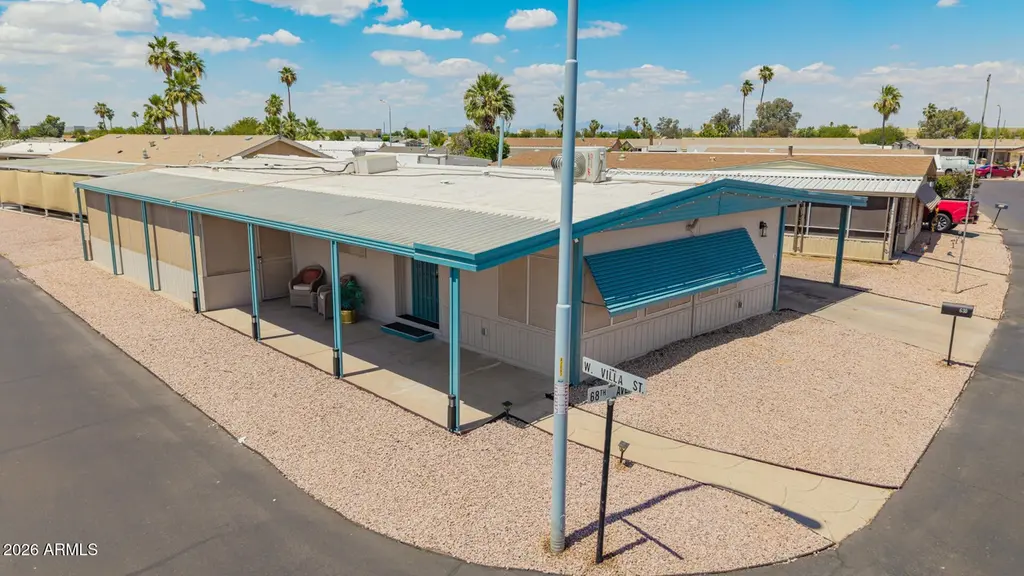
630 N 68th Ave · Phoenix, AZ
Flood risk 1/10 · Minimal
- FEMA flood zone
- X (shaded)
- Chance of flooding over 30 yrs
- 0.0%
- Est. flood insurance / yr
- $507 – $1,088
Fire risk 1/10 · Minimal
- Est. fire insurance / yr
- $610 – $1,132
Heat risk 9/10 · Severe
- Hot days now (above 112°F)
- 6 days/yr
- Hot days in 30 yrs
- 16 days/yr
Wind risk 1/10 · Minimal
- Chance of severe wind over 30 yrs
- —
Air-quality risk 2/10 · Minimal
- Unhealthy air days now
- 0 days/yr
- Unhealthy air days in 30 yrs
- 1 days/yr
Risk factors via First Street. Map © Google.
Why this score? — see what drove the B grade
The composite is a weighted blend of 9 inputs, each scored 0–100. Each bar is that input's sub-score; the figure is the points it added to the 100-point composite (weight × sub-score).
- Cash flow +30.0/30.0
- ARV discount +10.1/15.0
- 1% rule +10.0/10.0
- DSCR +10.0/10.0
- Livability +3.8/5.0
- Condition / age +3.8/5.0
- Rent growth +2.0/5.0
- Schools +1.6/10.0
- Appreciation +0.0/10.0
$96,900
🖨 Deal sheet 📄 Offer letter ✓ Due diligence
Listing remarks
Well maintained 3-bedroom, 2-bath manufactured home with an open floor plan. The property features title flooring throughout, a spacious living room area, kitchen and bathrooms granite countertops, remodeled bathroom, smart lighting, indoor laundry area. Property also counts with a bonus extended patio area that could potentially be used as an indoor patio or storage. Located in a gated community, cornet lot just across the street of some of the community amenities including a pool, gym, laundry, pickleball court and an on-site salon. Property is also conveniently located near I-10, offering easy access for commuting and close proximity to shopping and dining.
Key facts
- Open floor plan
- Indoor laundry area
- Remodeled bathroom
Tags
Property features AI
Finance
- Other: Tax information available (not included per instructions)
- HOA & community: Land lease (monthly); Land lease payment: $1,060 per month; Association covers pest control, street maintenance, and water; Community pool and spa; Pickleball courts; Community laundry; Playground; Biking/walking path; Fitness center; Near bus stop
Exterior
- Parking: 3 covered parking spaces; 3 carport spaces
- Security: Gated community
- Utilities: City water; Public sewer
- Home design: Manufactured/mobile home; Leasehold ownership
- Construction: Vertical siding; Aluminum siding; Wood frame construction; Composition roof; Building area reported by owner
- Exterior features: Screened-in patio(s); Storage; Corner lot; Gravel/stone front; Gravel/stone back; Private maintained road
Interior
- Kitchen: Built-in microwave; Refrigerator
- Bedrooms: 3 possible bedrooms
- Flooring: Vinyl flooring
- Bathrooms: 2 full bathrooms
- Heating & cooling: Electric heating; Central air; Ceiling fans; Mini split cooling
- Interior features: Granite counters; Double vanity; Eat-in kitchen; No interior steps; Full bathroom in master bedroom; Refrigerator
- Laundry & utility: Laundry inside
Neighborhood map
What this means for you Summary
Snapshot
- This is a 3-bed/2.0-bath manufactured listed at $97k. Condition is rated good.
Deal economics
- At list price, monthly cash flow is $934 ($11k/yr) — positive.
- The deal already cash-flows at list — no discount required.
- Meets the 1% rule at list price ($2k rent vs $97k).
- Recommended offer: $94k (3.0% below list) — sets the bar for market timing.
- Cap rate 17.9% vs local median 3.3% in Phoenix — top-decile yield for the area; either an underpriced asset or a hidden risk that comps aren't pricing in. Stress-test before assuming the spread holds.
Location & tenants
- Location reads 75/100 on livability (#16 in AZ, #3,924 nationally) — a middle-class / working-renter tenant base. Strengths: amenities A+, commute A+, housing A+; Watch: health & safety C-, crime F.
- Tolleson Union High School District (4288) (suburban): math 14% / reading 22% proficiency, ranked #188 of 249 in AZ (top 76%) — low school quality limits family demand, transient renter base, plan for 1-2y turnover.
- Zoned schools: Sierra Linda High School (math 10% / reading 14%, grade F, #287 of 381 statewide, top 76%, 1,975 students, 58% FRL).
- Market conditions: Rents soft (-1.8%/yr); 120 active listings in the ZIP; 10 comparable units currently listed for rent nearby; rentals leasing fast (median 1d on market — plan ~1-2 weeks tenant-placement turnaround); solid renter incomes; 36,011 units permitted in Maricopa County in 2024 (12,801 in 5+ unit buildings).
- This rent runs 31% of the median local income ($78k/yr) — at the standard rent-burdened threshold; future hikes will face affordability resistance.
Forward outlook
- Local home prices are declining (-3.0%/yr); year-one equity from $670 of loan paydown is wiped out by about $3k of value loss. Plan a longer hold.
- Maricopa County population projected at +38% by 2050 — long-run rental-demand tailwind backs the buy-and-hold thesis.
- At projected returns (-3.0% appreciation + 0.0% rent growth), your $27k cash investment doubles in ~3 years — after that, you're playing with house money.
Negotiation context
- It's been on market 38 days — a 3% lower offer ($94k) is reasonable based on typical stale-listing flexibility.
Risks & watch-outs
- Climate carrying-cost: extreme-heat days projected 6→16/yr by 2055 (HVAC capex compounding) — expect insurance premiums to compound above CPI over the hold.
Questions for the listing agent
- It's been on market 38 days. Have you received any prior offers? Is the seller open to a 3% concession, seller financing, or rate buy-down credit?
- Built in 1972 — when were the roof, HVAC, electrical panel, plumbing, and water heater last replaced?
- Is there a deadline driving the sale (1031 exchange, divorce, estate, relocation)? That informs how much negotiation room exists.
- Crime grade is F in this area — have there been break-ins, vandalism, or insurance claims at this property in the last 3 years? What carrier currently insures it and at what premium?
- What's the average days-on-market for RENTAL listings here right now (not sales)? A rising rental-DOM trend means longer vacancies and softer asking-rent achievability than the comps imply.
- What's the recent tenant-quality profile in this submarket — average credit score on applications, eviction rate, late-payment / NSF rate, and stable-employment percentage? A property-management company in the area should have these aggregated.
- How much new for-sale + rental construction is in the pipeline within 1–3 miles? Heavy new supply typically softens prices + rents 12–24 months out; constrained supply supports both.
Investment metrics
- 1% rule
- 2.10% ✓
- Cap rate
- 17.86%
- Cash-on-cash
- 41.32%
- DSCR
- 2.84
- GRM
- 4.0
CMA / ARV
- ARV (on-the-fly)
- $102,912
- Comps found
- 9
Show comp detail 9 sales within ~0.75 mi
| Address | Dist | Beds/Ba | Sqft | Sold | Price | $/sf | Match |
|---|---|---|---|---|---|---|---|
| 451 N 68th Ln #168 | 0.13mi | 3/2.0 | 1,500 (-2%) | 16mo | $70,000 | $47 | 77 |
| 401 N 68th Ave #247 | 0.15mi | 3/2.0 | 1,500 (-2%) | 15mo | $89,500 | $60 | 77 |
| 605 N 68th Dr #131 | 0.07mi | 3/2.0 | 1,640 (+7%) | 19mo | $125,000 | $76 | 70 |
| 6705 W Fillmore St W #305 | 0.11mi | 4/2.0 (+1) | 1,450 (-6%) | 14mo | $95,500 | $66 | 69 |
| 6810 W Mckinley St | 0.07mi | 4/2.0 (+1) | 1,344 (-12%) | 4mo | $115,000 | $86 | 68 |
| 6704 W Mckinley St #26 | 0.10mi | 2/2.0 (-1) | 1,634 (+6%) | 15mo | $110,000 | $67 | 67 |
| 649 N 67th Dr #25 | 0.12mi | 3/2.0 | 1,344 (-12%) | 10mo | $130,000 | $97 | 65 |
| 6723 W Fillmore St #301 | 0.09mi | 3/2.0 | 1,344 (-12%) | 12mo | $70,000 | $52 | 65 |
| 6839 W Taylor St #209 | 0.16mi | 4/2.0 (+1) | 1,344 (-12%) | 13mo | $110,000 | $82 | 56 |
Match score weights: distance 35% · size 25% · config 20% · recency 20%. Top-matched comps best support the ARV.
Projected returns pro-forma
-3.0% appreciation · 0.0% rent growth · sell at horizon
- IRR
- 34.4%
- Equity multiple
- 2.40×
- Total profit
- $37,881
- Equity at exit
- $14,448
- IRR
- 39.7%
- Equity multiple
- 4.20×
- Total profit
- $86,736
- Equity at exit
- $8,378
Cash invested: $27,132 (down + closing). Projections, not guarantees.
Landlord ↔ Tenant lean methodology
- Overall (STATE)
- 87 Strongly Landlord-Friendly
- State Arizona
- 87 Strongly Landlord-Friendly · R+3
- County
- — inherits STATE
- City
- — inherits STATE
ZIP-level market 85043
- Home prices YoY
- -28.6%
- Rents YoY
- -1.8%
- Active inventory
- 120
- Price-to-rent
- 4.0×
Monthly cashflow live
- Estimated rent
- $2,030 high interval (Pro) →
- Mortgage (P&I)
- −$508
- Tax est. 1.5%
- −$121 /mo · $1,454/yr
- Insurance
- −$40
- HOA
- −$0
- Vacancy / Maint / Mgmt
- −$426
- Net cashflow
- $934
Break-even live
UW: 25.0% down · 7.5% · 30yr · 1.5% tax · 5.0% vac · 8.0% maint · 8.0% mgmt
Financing live
Cash to close
- Down payment
- $24,225
- Closing costs
- $2,907
- Reserves months
- —
- Total cash needed
- —
Loan-product check · same deal, 3 products live
Conventional
25% down · 7.5% · 30yr
- Down + closing
- —
- Monthly P&I
- —
- Monthly cashflow
- —
- DSCR
- —
- Eligible?
- —
Personal DTI + credit; lowest rate.
DSCR
20% down · 8.5% · 30yr
- Down + closing
- —
- Monthly P&I
- —
- Monthly cashflow
- —
- DSCR
- —
- Eligible?
- —
No personal income docs; deal must DSCR.
Hard money
10% down · 12.0% · 12mo
- Down + closing
- —
- Monthly P&I
- —
- Monthly cashflow
- —
- DSCR
- —
- Eligible?
- —
Short-term bridge; refi at stabilization.
Rent comps 10 comps
| Address | Beds | Baths | Sqft | Rent | $/sqft | DOM | Units | Dist |
|---|---|---|---|---|---|---|---|---|
| 7044 W Taylor St Phoenix, AZ | 4.0 | 2.0 | 1588 | $1,869 | $1.18 | 10d | 1 | 0.41mi |
| 6628 W Monroe St Phoenix, AZ | 3.0 | 2.0 | 1656 | $2,100 | $1.27 | 1d | 1 | 0.50mi |
| 6515 W McDowell Rd Phoenix, AZ | 1.0–3.0 | 1.0–2.0 | 991 | $1,738 | $1.75 | 1d | 7 | 0.67mi |
| 7205 W McDowell Rd Phoenix, AZ | 2.0–3.0 | 2.0 | 1291 | $1,940 | $1.50 | 1d | 6 | 0.79mi |
| 1801 N 63rd Dr Phoenix, AZ | 3.0 | 2.0 | 1770 | $1,845 | $1.04 | 14d | 1 | 0.96mi |
| 6161 W McDowell Rd Phoenix, AZ | 1.0–3.0 | 1.0–2.0 | 987 | $1,955 | $1.98 | 1d | 38 | 1.03mi |
| 7361 W Coronado Rd Phoenix, AZ | 3.0 | 2.0 | 1493 | $1,795 | $1.20 | 10d | 1 | 1.13mi |
| 6343 W Cypress St Phoenix, AZ | 3.0 | 2.0 | 1280 | $1,780 | $1.39 | 1d | 1 | 1.21mi |
| 5821 W McDowell Rd Phoenix, AZ | 1.0–3.0 | 1.0–2.0 | 998 | $2,324 | $2.33 | 1d | 11 | 1.29mi |
| 7725 W McDowell Rd Phoenix, AZ | 3.0 | 1.0–2.0 | 771 | $1,705 | $2.21 | 1d | 50 | 1.31mi |
Listing history 13 events
-
2026-06-18days on market $96,900 Active 38 DOM
-
2026-06-17days on market $96,900 Active 37 DOM
-
2026-06-16days on market $96,900 Active 36 DOM
-
2026-06-15days on market $96,900 Active 35 DOM
-
2026-06-13days on market $96,900 Active 33 DOM
-
2026-06-13days on market $96,900 Active 32 DOM
-
2026-06-09days on market $96,900 Active 29 DOM
-
2026-06-08days on market $96,900 Active 28 DOM
-
2026-06-07days on market $96,900 Active 27 DOM
-
2026-06-04days on market $96,900 Active 24 DOM
-
2026-06-03days on market $96,900 Active 23 DOM
-
2026-06-02remarks 668-char remark
-
2026-06-02$96,900 Active 22 DOM
ⓘ Source: listings_history table (triggers on properties + properties_extension) + one-shot
backfill from property_details.listing_events for pre-trigger history.
Climate risk First Street
- Flood 1/10 Low FEMA zone X (shaded) · 0% chance over 30 yrs
- Wildfire 1/10 Low
- Heat 9/10 Extreme 6 d/yr ≥112°F today · 16 d/yr by 30 yrs out
- Wind 1/10 Low
- Air quality 2/10 Low 0 unhealthy d/yr today · 1 by 30 yrs out
Nearby sold comps map
Loading sold comps map…
Walkable amenities ~0.75 mi
Loading nearby amenities…
Taxation est. · year 1
- Rental income
- $24,363
- − Mortgage interest
- −$5,428
- − Property taxes
- −$1,454
- − Insurance
- −$484
- − Repairs & maintenance
- −$1,949
- − Management
- −$1,949
- − Depreciation
- −$2,819
- Taxable income
- $10,280
- Est. tax owed @ 24.0%
- −$2,467
- After-tax cash flow
- $8,744/yr
For passive investors: Depreciation is non-cash, so a rental often shows a tax loss while cash-flowing — sheltering income. Rental losses are passive: they offset passive income freely, and up to $25,000/yr can offset ordinary (W-2) income if you actively participate and your MAGI is under $100k (phasing out to $0 by $150k); unused losses carry forward. On sale, claimed depreciation is recaptured at up to 25%, and gains may owe capital-gains tax (a 1031 exchange can defer both). Figures are a year-1 estimate at your 24.0% rate — not tax advice; consult a CPA.
Condition & rehab AI · 13 photos
This well-maintained mobile home is in good condition with modern updates and a good location in a gated community.
Value-add opportunities
- Both landscaping — enhances curb appeal and adds value
- Both smart home integration — increases convenience and marketability
Renovation cost estimate screening
Value-add ROI direction
- Both landscaping — enhances curb appeal and adds value ↑
- Both smart home integration — increases convenience and marketability ↑
ⓘ Cost ranges are severity-bucket heuristics (US national rule-of-thumb). Get contractor quotes + a written scope before underwriting a rehab budget.
Schools (NCES district)
- District
- Tolleson Union High School District (4288)
- NCES district ID
- 0408520
- Math proficiency
- 14% ▼ -21.00%
- Reading proficiency
- 22% ▼ -14.00%
- Median HH income
- $51,925
- Composite
- 16.41/100
- National rank
- #9193
- State rank
- #188 of 249 in AZ
Livability — Phoenix
- Score
- 75/100
- State rank
- #16
- US rank
- #3924
Category grades
Schools grade is shown separately in the Schools card above.
Census & demographics
- Census place
- Phoenix, AZ
- County
- Maricopa County · 4,537,380 people
- City population
- 1,500,198
- Metro
- Phoenix-Mesa-Chandler, AZ
- Population (ZIP)
- 41,331
- Household income
- $78,257
- Rent vs Own
- Severe rent burden
- 1019.0
Population outlook (Maricopa County) Hauer SSP2
- Today (2025)
- 4,979,203 people
- By 2030
- 5,378,229 · +8.0%
- By 2040
- 6,156,598 · +23.6%
- By 2050
- 6,872,376 · +38.0%
- By 2075
- 8,401,270 · +68.7%
- By 2100
- 9,247,439 · +85.7%
Race, ethnicity, and origin ACS 2023
- Neighborhood character
- Predominantly Hispanic (75%)
- Race & ethnicity
- Hispanic / Latino 75% Two or more races 33% White 11% Black 11% Native American 3%
- Hispanic origin (detail)
- Mexican 72%
- Common ancestry
- Lithuanian 1% Iranian 1%
- Foreign-born
- 27% · Canada
- Languages at home
- 41% English-only · Spanish 57%
Political lean MEDSL · Maricopa
- 2024 margin
- Toss-up / Even · D 47.7% · R 51.2% · Other 1.1%
- 2008→2024 swing
- +7.1pp toward D · 2008: -10.6pp · 2024: -3.5pp
- All cycles
- 2024: R+3.5 2020: D+2.2 2016: R+3.5 2012: R+12.0 2008: R+10.6
Not yet ingested
- Civics
- —
Market trends
- HPI YoY
- ▼ -124.22%
- Current HPI
- 309.495
- Rent YoY
- ▼ -1.83%
- Metro
- Phoenix-Mesa-Chandler, AZ
- State GDP YoY
- ▲ 4.54%
- F500 in state
- 20
Industry mix (Fortune 500 HQ in AZ)
| Industry | F500 HQs | Revenue |
|---|---|---|
| Technology | 2 | $13B |
|
||
| Mining / Metals | 1 | $23B |
|
||
| Environmental Services | 1 | $16B |
|
||
| Metals / Steel | 1 | $14B |
|
||
| Technology Distribution | 1 | $9B |
|
||
| Homebuilding | 1 | $8B |
|
||
Price history
1 event — show timeline
- 2026-05-11 Listed $96,900 ARMLS
Cash-flow waterfall
monthlySold comps — $/sqft
last 12 mo · ≤1 miLoading sold comps…