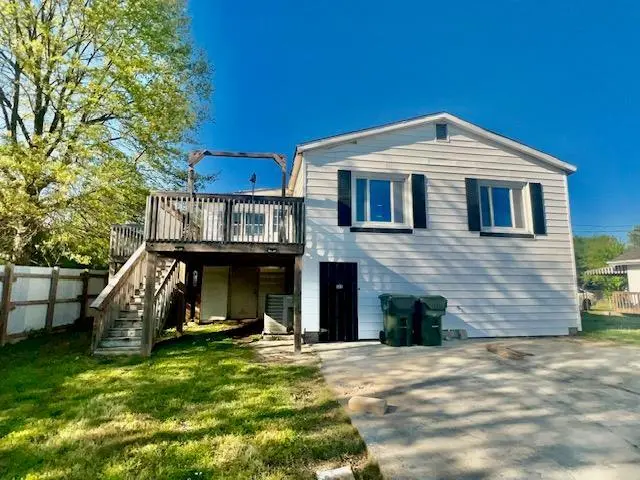
583 Hall St · Madisonville, KY
Flood risk No data
- FEMA flood zone
- —
- Chance of flooding over 30 yrs
- —
- Est. flood insurance / yr
- —
Fire risk No data
- Est. fire insurance / yr
- —
Heat risk No data
- Hot days now (above threshold)
- —
- Hot days in 30 yrs
- —
Wind risk No data
- Chance of severe wind over 30 yrs
- —
Air-quality risk No data
- Unhealthy air days now
- —
- Unhealthy air days in 30 yrs
- —
Risk factors via First Street. Map © Google.
Why this score? — see what drove the B+ grade
The composite is a weighted blend of 9 inputs, each scored 0–100. Each bar is that input's sub-score; the figure is the points it added to the 100-point composite (weight × sub-score).
- Cash flow +30.0/30.0
- ARV discount +15.0/15.0
- DSCR +10.0/10.0
- 1% rule +9.0/10.0
- Livability +3.6/5.0
- Schools +3.0/10.0
- Rent growth +2.5/5.0
- Condition / age +2.5/5.0
- Appreciation +0.0/10.0
$63,900
🖨 Deal sheet 📄 Offer letter ✓ Due diligence
Listing remarks MLS
2 Bedroom, 1 Bathroom home located in Madisonville, Kentucky.
Key facts
- 8,712 sq ft lot
- Built 1949
- Listed 57 days
Property features AI
Finance
- Other: Lot size approximately 0.2 acres; Directions: From Park Ave turn right onto Hall; property is on the right
Exterior
- Utilities: Public water; Public sewer
- Home design: Residential property; Other (see remarks)
- Construction: Frame construction
- Exterior features: Composition roof
Interior
- Bedrooms: 2 bedrooms (2 on main level)
- Bathrooms: 1 full bathroom (on main level)
- Interior features: Gas water heater; Central air conditioning; Forced air heating
Neighborhood map
What this means for you Summary
Snapshot
- This is a 2-bed/1.0-bath single-family listed at $64k.
Deal economics
- At list price, monthly cash flow is $255 ($3k/yr) — positive.
- The deal already cash-flows at list — no discount required.
- Meets the 1% rule at list price ($894 rent vs $64k).
- Recommended offer: $62k (3.0% below list) — sets the bar for market timing.
- Cap rate 11.1% vs local median 4.0% in Madisonville — top-decile yield for the area; either an underpriced asset or a hidden risk that comps aren't pricing in. Stress-test before assuming the spread holds.
Location & tenants
- Location reads 72/100 on livability (#132 in KY) — a middle-class / working-renter tenant base. Strengths: crime A+, cost of living A+, housing A+; Watch: amenities F, commute F, employment F.
- Hopkins County (town): math 27% / reading 43% proficiency, ranked #65 of 165 in KY (top 39%) — families likely to look elsewhere, expect single-tenant / working-renter base with shorter leases.
- Market conditions: 192 active listings in the ZIP; 122 units permitted in Hopkins County in 2024 (0 in 5+ unit buildings).
Forward outlook
- Local home prices are declining (-3.0%/yr); year-one equity from $442 of loan paydown is wiped out by about $2k of value loss. Plan a longer hold.
- Hopkins County population projected at -13% by 2050 — secular population decline; favor cash flow + early exit over multi-decade hold.
- At projected returns (-3.0% appreciation + 3.0% rent growth), your $18k cash investment doubles in ~7 years — after that, you're playing with house money.
Negotiation context
- It's been on market 57 days — a 3% lower offer ($62k) is reasonable based on typical stale-listing flexibility.
- 3 sale attempts since 3y ago; this cycle's ask has dropped $6k (9%) from the opening price — seller is motivated, your offer sets the floor, not the list.
Risks & watch-outs
- Watch-outs: built in 1949 — expect roof / HVAC / electrical / plumbing capex.
Questions for the listing agent
- It's been on market 57 days. Have you received any prior offers? Is the seller open to a 3% concession, seller financing, or rate buy-down credit?
- Built in 1949 — when were the roof, HVAC, electrical panel, plumbing, and water heater last replaced?
- Is there a deadline driving the sale (1031 exchange, divorce, estate, relocation)? That informs how much negotiation room exists.
- What's the average days-on-market for RENTAL listings here right now (not sales)? A rising rental-DOM trend means longer vacancies and softer asking-rent achievability than the comps imply.
- What's the recent tenant-quality profile in this submarket — average credit score on applications, eviction rate, late-payment / NSF rate, and stable-employment percentage? A property-management company in the area should have these aggregated.
- How much new for-sale + rental construction is in the pipeline within 1–3 miles? Heavy new supply typically softens prices + rents 12–24 months out; constrained supply supports both.
Investment metrics
- 1% rule
- 1.40% ✓
- Cap rate
- 11.08%
- Cash-on-cash
- 17.09%
- DSCR
- 1.76
- GRM
- 6.0
CMA / ARV
- ARV (on-the-fly)
- $122,304
- Comps found
- 12
Show comp detail 12 sales within ~0.75 mi
| Address | Dist | Beds/Ba | Sqft | Sold | Price | $/sf | Match |
|---|---|---|---|---|---|---|---|
| 382 S Dave St | 0.19mi | 2/1.0 | 783 (-6%) | 1mo | $142,500 | $182 | 80 |
| 739 Hodge St | 0.25mi | 2/1.0 | 812 (-2%) | 10mo | $120,000 | $148 | 76 |
| 718 Park Avenue Ct | 0.20mi | 2/1.0 | 840 (+1%) | 16mo | $124,900 | $149 | 76 |
| 377 Hanner St | 0.17mi | 2/1.0 | 812 (-2%) | 16mo | $20,000 | $25 | 75 |
| 204 Kentucky St | 0.24mi | 2/1.0 | 925 (+11%) | 1mo | $124,000 | $134 | 69 |
| 121 Plum St | 0.16mi | 2/1.0 | 800 (-4%) | 22mo | $134,000 | $168 | 68 |
| 53 Buckner St | 0.31mi | 2/1.0 | 784 (-6%) | 14mo | $31,500 | $40 | 65 |
| 341 S Harrig St | 0.28mi | 2/1.0 | 728 (-12%) | 3mo | $40,000 | $55 | 64 |
| 63 Bradley St | 0.34mi | 2/1.0 | 728 (-12%) | 0mo | $114,900 | $158 | 63 |
| 320 E Lake St | 0.33mi | 2/2.0 | 900 (+8%) | 13mo | $61,500 | $68 | 56 |
| 762 E Broadway St | 0.22mi | 2/1.0 | 716 (-14%) | 16mo | $104,900 | $147 | 53 |
| 31 N Harrig St | 0.40mi | 3/2.0 (+1) | 900 (+8%) | 13mo | $122,500 | $136 | 48 |
Match score weights: distance 35% · size 25% · config 20% · recency 20%. Top-matched comps best support the ARV.
Projected returns pro-forma
-3.0% appreciation · 3.0% rent growth · sell at horizon
- IRR
- 8.4%
- Equity multiple
- 1.33×
- Total profit
- $5,893
- Equity at exit
- $9,528
- IRR
- 17.6%
- Equity multiple
- 2.46×
- Total profit
- $26,106
- Equity at exit
- $5,525
Cash invested: $17,892 (down + closing). Projections, not guarantees.
Landlord ↔ Tenant lean methodology
- Overall (STATE)
- 83 Strongly Landlord-Friendly
- State Kentucky
- 83 Strongly Landlord-Friendly · R+16
- County
- — inherits STATE
- City
- — inherits STATE
ZIP-level market 42431
- Home prices YoY
- -15.2%
- Active inventory
- 192
- Price-to-rent
- 6.0×
Monthly cashflow live
- Estimated rent
- $894 medium interval (Pro) →
- Mortgage (P&I)
- −$335
- Tax from tax record
- −$89 /mo · $1,072/yr
- Insurance
- −$27
- HOA
- −$0
- Vacancy / Maint / Mgmt
- −$188
- Net cashflow
- $255
Break-even live
Sensitivity live
| Price | -10% $291 | -5% $273 | +0% $255 | +5% $237 | +10% $219 |
|---|---|---|---|---|---|
| Rent | -10% $184 | -5% $220 | +0% $255 | +5% $290 | +10% $325 |
| Rate | -1.0pp $287 | -0.5pp $271 | base $255 | +0.5pp $238 | +1.0pp $221 |
UW: 25.0% down · 7.5% · 30yr · 1.5% tax · 5.0% vac · 8.0% maint · 8.0% mgmt
Financing live
Cash to close
- Down payment
- $15,975
- Closing costs
- $1,917
- Reserves months
- —
- Total cash needed
- —
Loan-product check · same deal, 3 products live
Conventional
25% down · 7.5% · 30yr
- Down + closing
- —
- Monthly P&I
- —
- Monthly cashflow
- —
- DSCR
- —
- Eligible?
- —
Personal DTI + credit; lowest rate.
DSCR
20% down · 8.5% · 30yr
- Down + closing
- —
- Monthly P&I
- —
- Monthly cashflow
- —
- DSCR
- —
- Eligible?
- —
No personal income docs; deal must DSCR.
Hard money
10% down · 12.0% · 12mo
- Down + closing
- —
- Monthly P&I
- —
- Monthly cashflow
- —
- DSCR
- —
- Eligible?
- —
Short-term bridge; refi at stabilization.
Listing history 24 events
-
2026-06-18days on market $63,900 Active 57 DOM
-
2026-06-17days on market $63,900 Active 56 DOM
-
2026-06-16days on market $63,900 Active 55 DOM
-
2026-06-15days on market $63,900 Active 54 DOM
-
2026-06-13days on market $63,900 Active 52 DOM
-
2026-06-12days on market $63,900 Active 51 DOM
-
2026-06-09days on market $63,900 Active 48 DOM
-
2026-06-08days on market $63,900 Active 47 DOM
-
2026-06-07days on market $63,900 Active 46 DOM
-
2026-06-07days on market $63,900 Active 45 DOM
-
2026-06-04days on market $63,900 Active 42 DOM
-
2026-06-03price $63,900 Active 41 DOM
-
2026-06-02days on market $69,900 Active 41 DOM
-
2026-06-01days on market $69,900 Active 40 DOM
-
2026-05-31days on market $69,900 Active 39 DOM
-
2026-05-31days on market $69,900 Active 38 DOM
-
2026-04-22$69,900 Active
-
2025-09-23price $134,000
-
2025-08-08$139,000 Active
-
2023-02-24soldstatus $108,000
-
2023-02-22soldstatus $108,000 61-char remark
Show marketing remark (61 chars)
2 Bedroom, 1 Bathroom home located in Madisonville, Kentucky.
-
2023-01-31$103,000 61-char remark
Show marketing remark (61 chars)
2 Bedroom, 1 Bathroom home located in Madisonville, Kentucky.
-
2022-10-04soldstatus $45,000
-
1973-03-01soldstatus $10,000
ⓘ Source: listings_history table (triggers on properties + properties_extension) + one-shot
backfill from property_details.listing_events for pre-trigger history.
Tax reassessment forecast KY · Resets to sale price
- Current annual tax
- $1,072 · $89/mo
- Projected year-2 tax
- $1,072 · $89/mo
- Expected delta
- $0/yr ($0/mo · 0.0%)
ⓘ Screening estimate from a state-policy table — verify with the county assessor before closing.
Nearby sold comps map
Loading sold comps map…
Walkable amenities ~0.75 mi
Loading nearby amenities…
Taxation est. · year 1
- Rental income
- $10,722
- − Mortgage interest
- −$3,579
- − Property taxes
- −$1,072
- − Insurance
- −$320
- − Repairs & maintenance
- −$858
- − Management
- −$858
- − Depreciation
- −$1,859
- Taxable income
- $2,177
- Est. tax owed @ 24.0%
- −$522
- After-tax cash flow
- $2,535/yr
For passive investors: Depreciation is non-cash, so a rental often shows a tax loss while cash-flowing — sheltering income. Rental losses are passive: they offset passive income freely, and up to $25,000/yr can offset ordinary (W-2) income if you actively participate and your MAGI is under $100k (phasing out to $0 by $150k); unused losses carry forward. On sale, claimed depreciation is recaptured at up to 25%, and gains may owe capital-gains tax (a 1031 exchange can defer both). Figures are a year-1 estimate at your 24.0% rate — not tax advice; consult a CPA.
Schools (NCES district)
- District
- Hopkins County
- NCES district ID
- 2102860
- Math proficiency
- 27% ▼ -23.00%
- Reading proficiency
- 43% ▼ -17.00%
- Median HH income
- $42,436
- Composite
- 29.56/100
- National rank
- #6488
- State rank
- #65 of 165 in KY
Livability — Madisonville
- Score
- 72/100
- State rank
- #132
- US rank
- #6200
Category grades
Schools grade is shown separately in the Schools card above.
Census & demographics
- Census place
- Madisonville, KY
- City population
- 27,095
- Population (ZIP)
- 27,095
Population outlook (Hopkins County) Hauer SSP2
- Today (2025)
- 45,164 people
- By 2030
- 44,083 · -2.4%
- By 2040
- 41,650 · -7.8%
- By 2050
- 39,303 · -13.0%
- By 2075
- 34,567 · -23.5%
- By 2100
- 29,476 · -34.7%
Race, ethnicity, and origin ACS 2023
- Neighborhood character
- Predominantly White (83%)
- Race & ethnicity
- White 83% Black 8% Two or more races 6% Hispanic / Latino 3% Native American 1%
- Common ancestry
- Lithuanian 2% Slovak 1% Serbian 1%
- Foreign-born
- 2% · Canada, China
- Languages at home
- 97% English-only · Spanish 2%
Political lean MEDSL · Hopkins
- 2024 margin
- Solid R (+50.9) · D 23.9% · R 74.8% · Other 1.2%
- 2008→2024 swing
- -26.0pp toward R · 2008: -24.9pp · 2024: -50.9pp
- All cycles
- 2024: R+50.9 2020: R+48.0 2016: R+54.0 2012: R+39.9 2008: R+24.9
Not yet ingested
- Civics
- —
Market trends
- HPI YoY
- ▼ -39.52%
- Current HPI
- 220.2269
- Rent YoY
- —
- Metro
- —
- State GDP YoY
- ▲ 1.81%
- F500 in state
- 4
Industry mix (Fortune 500 HQ in KY)
| Industry | F500 HQs | Revenue |
|---|---|---|
| Healthcare | 1 | $118B |
|
||
| Food / Beverage | 1 | $7B |
|
||
Price history
+599.0% since first listed8 events — show timeline
- 2026-04-22 Listed $69,900 MHCBOR
- 2025-09-23 Price Changed $134,000 MHCBOR
- 2025-08-08 Listed $139,000 MHCBOR
- 2023-02-24 Sold (Public Records) $108,000 Public Records
- 2023-02-22 Sold (MLS) $108,000 GORAMLS
- 2023-01-31 Listed $103,000 GORAMLS
- 2022-10-04 Sold (Public Records) $45,000 Public Records
- 1973-03-01 Sold (Public Records) $10,000 Public Records
Property tax history
+10.6%/yrLatest (2025): $1,072 · -0.1% YoY. Source: county tax records.
Cash-flow waterfall
monthlySold comps — $/sqft
last 12 mo · ≤1 miLoading sold comps…