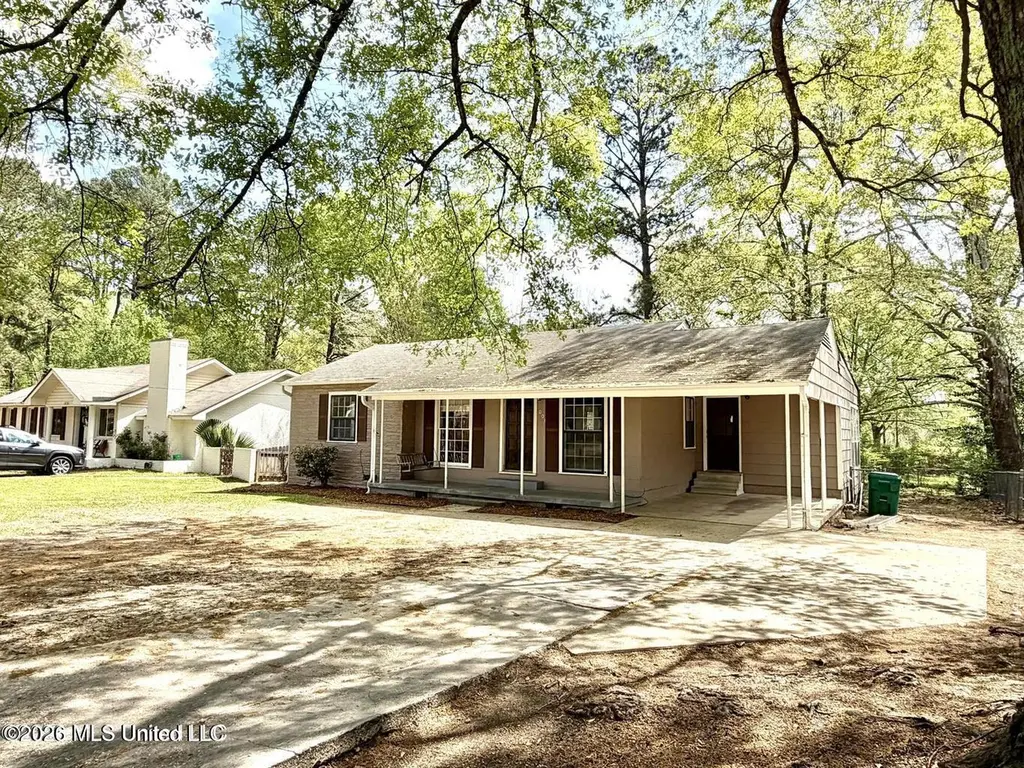
1003 S Jackson St · Brookhaven, MS
Flood risk 1/10 · Minimal
- FEMA flood zone
- X (unshaded)
- Chance of flooding over 30 yrs
- 0.0%
- Est. flood insurance / yr
- $507 – $1,088
Fire risk 3/10 · Minor
- Est. fire insurance / yr
- $1,241 – $2,305
Heat risk 7/10 · Major
- Hot days now (above 108°F)
- 7 days/yr
- Hot days in 30 yrs
- 21 days/yr
Wind risk 8/10 · Major
- Chance of severe wind over 30 yrs
- 98.0%
Air-quality risk 1/10 · Minimal
- Unhealthy air days now
- 0 days/yr
- Unhealthy air days in 30 yrs
- 0 days/yr
Risk factors via First Street. Map © Google.
Why this score? — see what drove the D+ grade
The composite is a weighted blend of 9 inputs, each scored 0–100. Each bar is that input's sub-score; the figure is the points it added to the 100-point composite (weight × sub-score).
- ARV discount +15.0/15.0
- Cash flow +14.8/30.0
- DSCR +4.5/10.0
- 1% rule +3.8/10.0
- Livability +3.3/5.0
- Rent growth +2.5/5.0
- Condition / age +2.5/5.0
- Schools +2.3/10.0
- Appreciation +0.0/10.0
$139,000
🖨 Deal sheet 📄 Offer letter ✓ Due diligence
Listing remarks MLS
This charming home offers 3 bedrooms and 1 bath with a spacious living room, dining area, and flexible space/ sunroom perfect for a home office, playroom, or second sitting area. The home features fresh paint in select rooms, updated lighting, and brand-new carpet, while some original hardwood floors remain adding a touch of character and warmth. An abundance of cabinetry lines the galley style kitchen featuring the perfect moody paint color with generous prep space and stainless steel appliances. A space that's both stylish and functional. Outside, you'll find a 1-car carport, a spacious yard, and a sweet front porch complete with a porch swing, just waiting for quiet evenings. Located in a quiet area inside the city limits of Brookhaven, this spot has long been a crowd favorite. From first-time buyers to retirees, this home offers opportunity for just about anyone. This one deserves a quick peek!
Key facts
- Brand new carpet
- Updated lighting
- Spacious living room
Tags
Neighborhood map
What this means for you Summary
Snapshot
- This is a 3-bed/1.0-bath single-family listed at $139k.
Deal economics
- At list price, monthly cash flow is $37 ($447/yr) — positive.
- The deal already cash-flows at list — no discount required.
- To meet the 1% rule (rent ≥ 1% of price), the offer needs to be $123k (11.7% below list).
- Recommended offer: $123k (11.7% below list) — sets the bar for 1% rule.
- Cap rate 6.6% vs local median 5.0% in Brookhaven — top-decile yield for the area; either an underpriced asset or a hidden risk that comps aren't pricing in. Stress-test before assuming the spread holds.
Location & tenants
- Location reads 66/100 on livability (#96 in MS) — a middle-class / working-renter tenant base. Strengths: cost of living A+, crime B+; Watch: schools C-, amenities F, commute F.
- Brookhaven School District (town): math 29% / reading 28% proficiency, ranked #73 of 130 in MS (top 56%) — low school quality limits family demand, transient renter base, plan for 1-2y turnover; 66% free/reduced lunch — lower-income household profile, screen leases tightly.
- Market conditions: 172 active listings in the ZIP; 10 units permitted in Lincoln County in 2024 (0 in 5+ unit buildings).
Forward outlook
- Local home prices are declining (-3.0%/yr); year-one equity from $961 of loan paydown is wiped out by about $4k of value loss. Plan a longer hold.
- Lincoln County population projected at -12% by 2050 — secular population decline; favor cash flow + early exit over multi-decade hold.
Negotiation context
- It's been on market 61 days — a 6% lower offer ($131k) is reasonable based on typical stale-listing flexibility.
- 2 sale attempts with the ask held roughly flat each time — persistent listings suggest the price (not the market) is what's stuck; bring a comps-based counter.
Risks & watch-outs
- Watch-outs: built in 1952 — expect roof / HVAC / electrical / plumbing capex.
- Climate carrying-cost: severe wind risk, 98% chance of damaging wind over 30y; extreme-heat days projected 7→21/yr by 2055 (HVAC capex compounding) — expect insurance premiums to compound above CPI over the hold.
Questions for the listing agent
- It's been on market 61 days. Have you received any prior offers? Is the seller open to a 12% concession, seller financing, or rate buy-down credit?
- Built in 1952 — when were the roof, HVAC, electrical panel, plumbing, and water heater last replaced?
- Why hasn't it sold? Are there any deal-killer items the seller is aware of (foundation, flood, title, zoning, code violations)?
- Is there a deadline driving the sale (1031 exchange, divorce, estate, relocation)? That informs how much negotiation room exists.
- The area grade is low — what's the realistic commute time and amenity access for the typical tenant pool here? Any planned neighborhood developments (good or bad) we should know about?
- What's the average days-on-market for RENTAL listings here right now (not sales)? A rising rental-DOM trend means longer vacancies and softer asking-rent achievability than the comps imply.
- What's the recent tenant-quality profile in this submarket — average credit score on applications, eviction rate, late-payment / NSF rate, and stable-employment percentage? A property-management company in the area should have these aggregated.
- How much new for-sale + rental construction is in the pipeline within 1–3 miles? Heavy new supply typically softens prices + rents 12–24 months out; constrained supply supports both.
Investment metrics
- 1% rule
- 0.88% ✗
- Cap rate
- 6.61%
- Cash-on-cash
- 1.15%
- DSCR
- 1.05
- GRM
- 9.4
CMA / ARV
- ARV (median comp)
- $186,761
- List price
- $139,000
- Delta
- -25.57%
- Verdict
- UNDERPRICED
- Comps
- 20 within 1.0 mi
Projected returns pro-forma
-3.0% appreciation · 3.0% rent growth · sell at horizon
- IRR
- -14.5%
- Equity multiple
- 0.48×
- Total profit
- $-20,148
- Equity at exit
- $20,725
- IRR
- -5.7%
- Equity multiple
- 0.63×
- Total profit
- $-14,480
- Equity at exit
- $12,018
Cash invested: $38,920 (down + closing). Projections, not guarantees.
Landlord ↔ Tenant lean methodology
- Overall (STATE)
- 90 Strongly Landlord-Friendly
- State Mississippi
- 90 Strongly Landlord-Friendly · R+11
- County
- — inherits STATE
- City
- — inherits STATE
ZIP-level market 39601
- Home prices YoY
- -26.6%
- Active inventory
- 172
- Price-to-rent
- 9.4×
Monthly cashflow live
- Estimated rent
- $1,228 medium interval (Pro) →
- Mortgage (P&I)
- −$729
- Tax from tax record
- −$146 /mo · $1,750/yr
- Insurance
- −$58
- HOA
- −$0
- Vacancy / Maint / Mgmt
- −$258
- Net cashflow
- $37
Break-even live
UW: 25.0% down · 7.5% · 30yr · 1.5% tax · 5.0% vac · 8.0% maint · 8.0% mgmt
Financing live
Cash to close
- Down payment
- $34,750
- Closing costs
- $4,170
- Reserves months
- —
- Total cash needed
- —
Loan-product check · same deal, 3 products live
Conventional
25% down · 7.5% · 30yr
- Down + closing
- —
- Monthly P&I
- —
- Monthly cashflow
- —
- DSCR
- —
- Eligible?
- —
Personal DTI + credit; lowest rate.
DSCR
20% down · 8.5% · 30yr
- Down + closing
- —
- Monthly P&I
- —
- Monthly cashflow
- —
- DSCR
- —
- Eligible?
- —
No personal income docs; deal must DSCR.
Hard money
10% down · 12.0% · 12mo
- Down + closing
- —
- Monthly P&I
- —
- Monthly cashflow
- —
- DSCR
- —
- Eligible?
- —
Short-term bridge; refi at stabilization.
Listing history 18 events
-
2026-06-18days on market $139,000 Active 61 DOM
-
2026-06-17days on market $139,000 Active 60 DOM
-
2026-06-16days on market $139,000 Active 59 DOM
-
2026-06-15days on market $139,000 Active 58 DOM
-
2026-06-13days on market $139,000 Active 56 DOM
-
2026-06-12days on market $139,000 Active 55 DOM
-
2026-06-09days on market $139,000 Active 52 DOM
-
2026-06-08days on market $139,000 Active 51 DOM
-
2026-06-07days on market $139,000 Active 50 DOM
-
2026-06-07days on market $139,000 Active 49 DOM
-
2026-06-04days on market $139,000 Active 46 DOM
-
2026-06-02days on market $139,000 Active 45 DOM
-
2026-06-01days on market $139,000 Active 44 DOM
-
2026-05-31days on market $139,000 Active 43 DOM
-
2026-04-18$139,000 Active 911-char remark
Show marketing remark (911 chars)
This charming home offers 3 bedrooms and 1 bath with a spacious living room, dining area, and flexible space/ sunroom perfect for a home office, playroom, or second sitting area. The home features fresh paint in select rooms, updated lighting, and brand-new carpet, while some original hardwood floors remain adding a touch of character and warmth. An abundance of cabinetry lines the galley style kitchen featuring the perfect moody paint color with generous prep space and stainless steel appliances. A space that's both stylish and functional. Outside, you'll find a 1-car carport, a spacious yard, and a sweet front porch complete with a porch swing, just waiting for quiet evenings. Located in a quiet area inside the city limits of Brookhaven, this spot has long been a crowd favorite. From first-time buyers to retirees, this home offers opportunity for just about anyone. This one deserves a quick peek!
-
2026-04-16historical
-
2026-03-15$139,000 Active
-
2016-02-26soldstatus
ⓘ Source: listings_history table (triggers on properties + properties_extension) + one-shot
backfill from property_details.listing_events for pre-trigger history.
Tax reassessment forecast MS · Resets to sale price
- Current annual tax
- $1,750 · $146/mo
- Projected year-2 tax
- $1,750 · $146/mo
- Expected delta
- $0/yr ($0/mo · 0.0%)
ⓘ Screening estimate from a state-policy table — verify with the county assessor before closing.
Climate risk First Street
- Flood 1/10 Low FEMA zone X (unshaded) · 0% chance over 30 yrs
- Wildfire 3/10 Moderate
- Heat 7/10 Severe 7 d/yr ≥108°F today · 21 d/yr by 30 yrs out
- Wind 8/10 Severe 98% chance of damaging wind over 30 yrs
- Air quality 1/10 Low 0 unhealthy d/yr today · 0 by 30 yrs out
Nearby sold comps map
Loading sold comps map…
Walkable amenities ~0.75 mi
Loading nearby amenities…
Taxation est. · year 1
- Rental income
- $14,733
- − Mortgage interest
- −$7,786
- − Property taxes
- −$1,750
- − Insurance
- −$695
- − Repairs & maintenance
- −$1,179
- − Management
- −$1,179
- − Depreciation
- −$4,044
- Taxable loss
- −$1,898
- Est. tax savings @ 24.0%
- +$456
- After-tax cash flow
- $903/yr
For passive investors: Depreciation is non-cash, so a rental often shows a tax loss while cash-flowing — sheltering income. Rental losses are passive: they offset passive income freely, and up to $25,000/yr can offset ordinary (W-2) income if you actively participate and your MAGI is under $100k (phasing out to $0 by $150k); unused losses carry forward. On sale, claimed depreciation is recaptured at up to 25%, and gains may owe capital-gains tax (a 1031 exchange can defer both). Figures are a year-1 estimate at your 24.0% rate — not tax advice; consult a CPA.
Schools (NCES district)
- District
- Brookhaven School District
- NCES district ID
- 2800840
- Math proficiency
- 29% ▼ -3.00%
- Reading proficiency
- 28% ▼ -6.00%
- Median HH income
- $34,498
- Composite
- 23.49/100
- National rank
- #7874
- State rank
- #73 of 130 in MS
Livability — Brookhaven
- Score
- 66/100
- State rank
- #96
- US rank
- #12022
Category grades
Schools grade is shown separately in the Schools card above.
Census & demographics
- Census place
- Brookhaven, MS
- City population
- 23,748
- Population (ZIP)
- 23,748
Population outlook (Lincoln County) Hauer SSP2
- Today (2025)
- 34,188 people
- By 2030
- 33,627 · -1.6%
- By 2040
- 32,089 · -6.1%
- By 2050
- 29,981 · -12.3%
- By 2075
- 23,581 · -31.0%
- By 2100
- 16,413 · -52.0%
Race, ethnicity, and origin ACS 2023
- Neighborhood character
- Majority White (62%)
- Race & ethnicity
- White 62% Black 36% Hispanic / Latino 2%
- Common ancestry
- Serbian 3% Slovak 2% Lithuanian 2%
- Foreign-born
- 1%
- Languages at home
- 99% English-only · Other Indo-European 1%
Political lean MEDSL · Lincoln
- 2024 margin
- Solid R (+45.4) · D 27.0% · R 72.3%
- 2008→2024 swing
- -13.2pp toward R · 2008: -32.2pp · 2024: -45.4pp
- All cycles
- 2024: R+45.4 2020: R+39.0 2016: R+40.1 2012: R+31.1 2008: R+32.2
Not yet ingested
- Civics
- —
Market trends
- HPI YoY
- ▼ -57.93%
- Current HPI
- 159.7072
- Rent YoY
- —
- Metro
- —
- State GDP YoY
- —
- F500 in state
- 0
Price history
+0.0% since first listed4 events — show timeline
- 2026-04-18 Listed $139,000 MLSU
- 2026-04-16 Listing Removed — MLSU
- 2026-03-15 Listed $139,000 MLSU
- 2016-02-26 Sold (Public Records) — Public Records
Property tax history
+9.0%/yrLatest (2024): $1,750 · -0.6% YoY. Source: county tax records.
Cash-flow waterfall
monthlySold comps — $/sqft
last 12 mo · ≤1 miLoading sold comps…