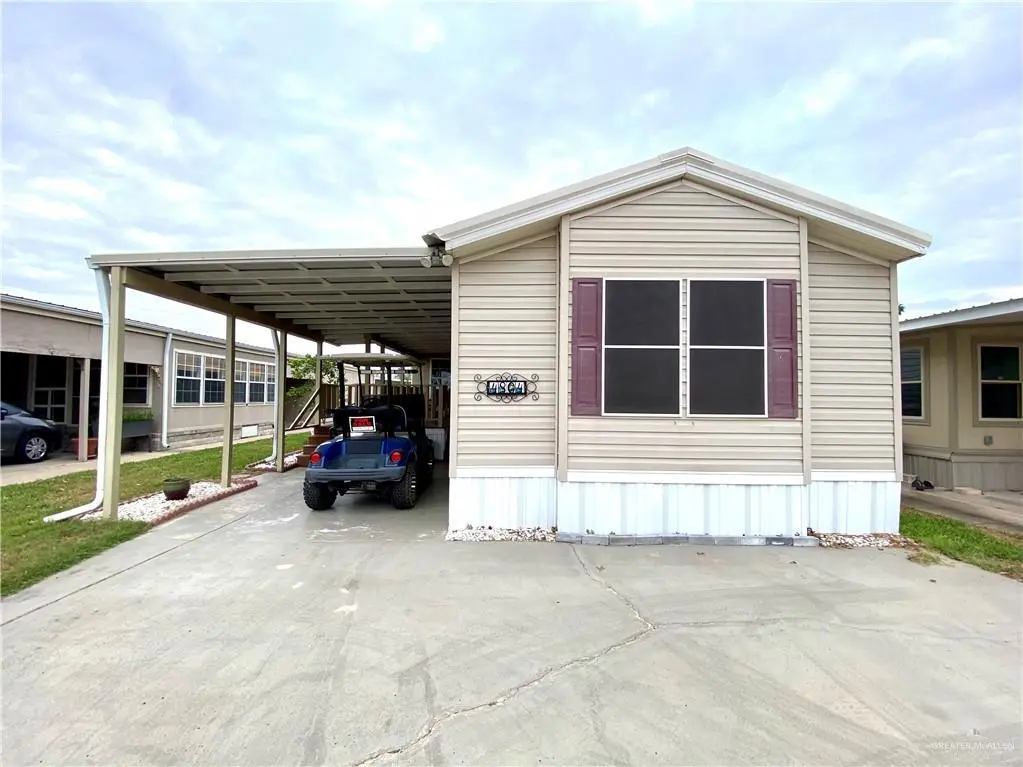
4804 Camellia Ave · McAllen, TX
Flood risk No data
- FEMA flood zone
- —
- Chance of flooding over 30 yrs
- —
- Est. flood insurance / yr
- —
Fire risk No data
- Est. fire insurance / yr
- —
Heat risk No data
- Hot days now (above threshold)
- —
- Hot days in 30 yrs
- —
Wind risk No data
- Chance of severe wind over 30 yrs
- —
Air-quality risk No data
- Unhealthy air days now
- —
- Unhealthy air days in 30 yrs
- —
Risk factors via First Street. Map © Google.
Why this score? — see what drove the D+ grade
The composite is a weighted blend of 9 inputs, each scored 0–100. Each bar is that input's sub-score; the figure is the points it added to the 100-point composite (weight × sub-score).
- Cash flow +19.9/30.0
- 1% rule +7.1/10.0
- DSCR +6.3/10.0
- Livability +3.8/5.0
- Schools +3.4/10.0
- Rent growth +2.9/5.0
- Condition / age +2.5/5.0
- ARV discount +0.0/15.0
- Appreciation +0.0/10.0
$104,900
🖨 Deal sheet (PDF) 📄 Offer letter ✓ Due diligence
Listing remarks MLS
This well-cared-for 2012 mobile home offers 2 bedrooms, 2 bathrooms, a bonus room, and a golf cart garage. The popular front kitchen design is both functional and open, overlooking the living room and offering ample cabinetry and counter space. The home comes fully furnished and provides plenty of comfortable living space. The primary suite includes a step-in shower, double vanity, and generous storage. The added addition offers flexibility and can be used as a private guest room, craft room, or man cave. Exterior features include a front-facing deck, covered carport, rear-access golf cart garage, and mature fruit trees, enhancing the outdoor space. Located in Adobe Wells, an active 55+ community, residents enjoy a swimming pool, shuffleboard, card games, and an 18-hole Par 3 golf course, all included in the $135 monthly HOA fee. Come experience this relaxed, resort-style lifestyle. Call today to schedule your private showing!
Key facts
- Double vanity
- Golf cart garage
- Generous storage
Tags
Neighborhood map
What this means for you Summary
Snapshot
- This is a 3-bed/1.0-bath manufactured listed at $105k.
Deal economics
- At list price, monthly cash flow is $126 ($2k/yr) — positive.
- The deal already cash-flows at list — no discount required.
- Meets the 1% rule at list price ($1k rent vs $105k).
- Recommended offer: $92k (12.0% below list) — sets the bar for market timing.
- Cap rate 7.7% vs local median 3.7% in McAllen — top-decile yield for the area; either an underpriced asset or a hidden risk that comps aren't pricing in. Stress-test before assuming the spread holds.
Location & tenants
- Location reads 76/100 on livability (#119 in TX, #3,771 nationally) — a middle-class / working-renter tenant base. Strengths: cost of living A+, housing A+, health & safety A+; Watch: employment D, amenities F, commute F.
- Sharyland ISD (urban): math 34% / reading 44% proficiency, ranked #406 of 826 in TX (top 49%) — families likely to look elsewhere, expect single-tenant / working-renter base with shorter leases.
- Zoned schools: Donna Wernecke El (math 23% / reading 35%, grade F, #2,668 of 4,322 statewide, top 63%, 697 students, 71% FRL); Sharyland North J H (math 46% / reading 42%, grade D, #512 of 1,662 statewide, top 32%, 806 students, 74% FRL); Sharyland Pioneer H S (math 31% / reading 51%, grade F, #774 of 1,632 statewide, top 49%, 1,471 students, 68% FRL) — zoned schools average 71% FRL vs 55% district-wide (16 pts higher); higher-poverty schools than district average — tighter screening recommended.
- Market conditions: Rents rising (+1.8%/yr); 390 active listings in the ZIP; 40 comparable units currently listed for rent nearby; rentals lingering (median 46d on market — plan ~5-8 weeks vacancy on turnover, expect pricing pressure); 60% of comp listings sitting > 30 days — soft ceiling on asking rent; 7,378 units permitted in Hidalgo County in 2024 (641 in 5+ unit buildings).
- This rent runs 32% of the median local income ($48k/yr) — at the standard rent-burdened threshold; future hikes will face affordability resistance.
Forward outlook
- Local home prices are declining (-3.0%/yr); year-one equity from $725 of loan paydown is wiped out by about $3k of value loss. Plan a longer hold.
- Hidalgo County population projected at +28% by 2050 — long-run rental-demand tailwind backs the buy-and-hold thesis.
Negotiation context
- It's been on market 159 days — a 12% lower offer ($92k) is reasonable based on typical stale-listing flexibility.
Questions for the listing agent
- It's been on market 159 days. Have you received any prior offers? Is the seller open to a 12% concession, seller financing, or rate buy-down credit?
- What does the HOA fee cover, when was the last increase, and are there any pending special assessments or reserve-fund shortfalls?
- Why hasn't it sold? Are there any deal-killer items the seller is aware of (foundation, flood, title, zoning, code violations)?
- Is there a deadline driving the sale (1031 exchange, divorce, estate, relocation)? That informs how much negotiation room exists.
- Schools are B-rated — typically a magnet for longer-tenancy family renters. What's the average tenant stay here, and is there a school-zone premium baked into asking?
- The area grade is low — what's the realistic commute time and amenity access for the typical tenant pool here? Any planned neighborhood developments (good or bad) we should know about?
- What's the average days-on-market for RENTAL listings here right now (not sales)? A rising rental-DOM trend means longer vacancies and softer asking-rent achievability than the comps imply.
- What's the recent tenant-quality profile in this submarket — average credit score on applications, eviction rate, late-payment / NSF rate, and stable-employment percentage? A property-management company in the area should have these aggregated.
- How much new for-sale + rental construction is in the pipeline within 1–3 miles? Heavy new supply typically softens prices + rents 12–24 months out; constrained supply supports both.
Investment metrics
- 1% rule
- 1.21% ✓
- Cap rate
- 7.73%
- Cash-on-cash
- 5.14%
- DSCR
- 1.23
- GRM
- 6.9
CMA / ARV
- ARV (median comp)
- $90,000
- List price
- $104,900
- Delta
- 16.56%
- Verdict
- OVERPRICED
- Comps
- 5 within 1.0 mi
Show comp detail 3 sales within ~0.75 mi
| Address | Dist | Beds/Ba | Sqft | Sold | Price | $/sf | Match |
|---|---|---|---|---|---|---|---|
| 4909 Harvey Ave #125 | 0.17mi | 2/2.0 (-1) | 1,040 (-3%) | 6mo | $90,000 | $87 | 74 |
| 4825 Carnation Ave | 0.05mi | 2/2.0 (-1) | 980 (-8%) | 6mo | $79,500 | $81 | 70 |
| 4901 Daffodil Ave #185 | 0.18mi | 2/2.0 (-1) | 1,116 (+4%) | 11mo | $99,900 | $90 | 66 |
Match score weights: distance 35% · size 25% · config 20% · recency 20%. Top-matched comps best support the ARV.
Projected returns pro-forma
-3.0% appreciation · 1.78% rent growth · sell at horizon
- IRR
- -9.8%
- Equity multiple
- 0.65×
- Total profit
- $-10,411
- Equity at exit
- $15,641
- IRR
- -2.4%
- Equity multiple
- 0.85×
- Total profit
- $-4,445
- Equity at exit
- $9,070
Cash invested: $29,372 (down + closing). Projections, not guarantees.
Landlord ↔ Tenant lean methodology
- Overall (STATE)
- 87 Strongly Landlord-Friendly
- State Texas
- 87 Strongly Landlord-Friendly · R+5
- County
- — inherits STATE
- City
- — inherits STATE
ZIP-level market 78501
- Home prices YoY
- -23.3%
- Rents YoY
- 1.8%
- Active inventory
- 390
- Price-to-rent
- 6.9×
Monthly cashflow live
- Estimated rent
- $1,266 high interval (Pro) →
- Mortgage (P&I)
- −$550
- Tax from tax record
- −$130 /mo · $1,562/yr
- Insurance
- −$44
- HOA
- −$150
- Vacancy / Maint / Mgmt
- −$266
- Net cashflow
- $126
Break-even live
Sensitivity live
| Price | -10% $185 | -5% $155 | +0% $126 | +5% $96 | +10% $66 |
|---|---|---|---|---|---|
| Rent | -10% $26 | -5% $76 | +0% $126 | +5% $176 | +10% $226 |
| Rate | -1.0pp $179 | -0.5pp $152 | base $126 | +0.5pp $99 | +1.0pp $71 |
UW: 25.0% down · 7.5% · 30yr · 1.5% tax · 5.0% vac · 8.0% maint · 8.0% mgmt
Financing live
Cash to close
- Down payment
- $26,225
- Closing costs
- $3,147
- Reserves months
- —
- Total cash needed
- —
Loan-product check · same deal, 3 products live
Conventional
25% down · 7.5% · 30yr
- Down + closing
- —
- Monthly P&I
- —
- Monthly cashflow
- —
- DSCR
- —
- Eligible?
- —
Personal DTI + credit; lowest rate.
DSCR
20% down · 8.5% · 30yr
- Down + closing
- —
- Monthly P&I
- —
- Monthly cashflow
- —
- DSCR
- —
- Eligible?
- —
No personal income docs; deal must DSCR.
Hard money
10% down · 12.0% · 12mo
- Down + closing
- —
- Monthly P&I
- —
- Monthly cashflow
- —
- DSCR
- —
- Eligible?
- —
Short-term bridge; refi at stabilization.
Rent comps 40 comps
| Address | Beds | Baths | Sqft | Rent | $/sqft | DOM | Units | Dist |
|---|---|---|---|---|---|---|---|---|
| 4517 W Fern Ave McAllen, TX | 2.0 | 2.0 | 840 | $1,000 | $1.19 | 45d | 1 | 0.16mi |
| 4217 La Vista Ave Unit 2 McAllen, TX | 3.0 | 2.0 | 1030 | $1,300 | $1.26 | 45d | 1 | 0.39mi |
| 4216 Walnut Ave Unit 3 McAllen, TX | 3.0 | 2.0 | 1020 | $1,375 | $1.35 | 45d | 1 | 0.49mi |
| 4601 Larkspur Ave Unit 4 McAllen, TX | 3.0 | 2.0 | 779 | $1,275 | $1.64 | 45d | 1 | 0.50mi |
| 4305 Walnut Ave Unit 1 McAllen, TX | 3.0 | 2.0 | 1148 | $1,250 | $1.09 | 25d | 1 | 0.51mi |
| 4305 Walnut Ave Unit 3 McAllen, TX | 2.0 | 2.0 | 900 | $1,250 | $1.39 | 45d | 1 | 0.51mi |
| 4501 Larkspur Ave Unit 1 McAllen, TX | 3.0 | 2.0 | 1050 | $1,290 | $1.23 | 45d | 1 | 0.51mi |
| 4616 Larkspur Ave Unit 3 McAllen, TX | 3.0 | 2.0 | 1053 | $1,100 | $1.04 | 45d | 1 | 0.53mi |
| 4116 Walnut Ave Unit 1 McAllen, TX | 2.0 | 2.0 | 950 | $1,025 | $1.08 | 16d | 1 | 0.60mi |
| 3908 Walnut Ave Unit 3 McAllen, TX | 2.0 | 2.0 | 850 | $1,195 | $1.41 | 45d | 1 | 0.61mi |
| 4104 Walnut Ave Unit 4 McAllen, TX | 2.0 | 2.0 | 950 | $1,125 | $1.18 | 16d | 1 | 0.64mi |
| 3812 Camellia Ave McAllen, TX | 3.0 | 1.0 | 1000 | $1,350 | $1.35 | 45d | 1 | 0.64mi |
| 3800 Westway Ave McAllen, TX | 3.0 | 2.0 | 1443 | $1,775 | $1.23 | 45d | 1 | 0.72mi |
| 3800 Westway Ave McAllen, TX | 3.0 | 2.0 | 1443 | $1,950 | $1.35 | 16d | 1 | 0.72mi |
| 3616 Harvey Dr W Unit 2 McAllen, TX | 2.0 | 1.0 | 783 | $695 | $0.89 | 25d | 1 | 0.78mi |
| 3616 Harvey St Unit 5 McAllen, TX | 2.0 | 1.0 | 783 | $695 | $0.89 | 45d | 1 | 0.79mi |
| 4105 La Vista Ave Unit 1 McAllen, TX | 2.0 | 2.0 | 841 | $1,100 | $1.31 | 45d | 1 | 0.81mi |
| 4208 La Vista Ave Unit 3 McAllen, TX | 2.0 | 2.0 | 826 | $1,075 | $1.30 | 25d | 1 | 0.81mi |
| 6009 N 43rd St Unit 135 McAllen, TX | 3.0 | 2.0 | 980 | $1,450 | $1.48 | 45d | 1 | 0.84mi |
| 4216 Walnut Ave Unit 4 McAllen, TX | 2.0 | 2.0 | 831 | $1,275 | $1.53 | 45d | 1 | 0.89mi |
| 4220 Walnut Ave Unit 2 McAllen, TX | 3.0 | 2.0 | 1020 | $1,375 | $1.35 | 45d | 1 | 0.89mi |
| 2815 Mimosa St Mission, TX | 2.0 | 2.0 | 1154 | $1,088 | $0.94 | 16d | 1 | 0.92mi |
| 2715 Mimosa St #12 Mission, TX | 3.0 | 2.0 | 1408 | $1,350 | $0.96 | 16d | 1 | 0.94mi |
| 3501 Westway Ave McAllen, TX | 3.0 | 2.0 | 1364 | $1,500 | $1.10 | 25d | 1 | 0.95mi |
| 2705 Mimosa St #8 Mission, TX | 2.0 | 2.0 | 1245 | $1,480 | $1.19 | 45d | 1 | 0.95mi |
| 2614 E Solar Dr Mission, TX | 3.0 | 2.5 | 1492 | $3,000 | $2.01 | 25d | 1 | 0.98mi |
| 4725 Mulberry Ave Unit 3 McAllen, TX | 2.0 | 2.0 | 928 | $1,250 | $1.35 | 45d | 1 | 1.01mi |
| 4705 Mulberry Ave Unit 3 McAllen, TX | 2.0 | 2.0 | 954 | $1,200 | $1.26 | 45d | 1 | 1.01mi |
| 4701 Mulberry Ave Unit 3 McAllen, TX | 2.0 | 2.0 | 954 | $1,250 | $1.31 | 23d | 1 | 1.02mi |
| 1313 N 48th St Unit 4 McAllen, TX | 4.0 | 2.5 | 1172 | $1,295 | $1.10 | 45d | 1 | 1.03mi |
| 4729 Magnolia Ave Unit 4 McAllen, TX | 2.0 | 2.0 | 954 | $1,300 | $1.36 | 45d | 1 | 1.05mi |
| 2513 N 32nd St Unit 4 McAllen, TX | 2.0 | 1.0 | 789 | $650 | $0.82 | 16d | 1 | 1.07mi |
| 3105 Highland Ave Apt 5 McAllen, TX | 3.0 | 1.0 | 987 | $750 | $0.76 | 45d | 1 | 1.12mi |
| 3105 Highland Ave Unit 6 McAllen, TX | 3.0 | 1.0 | 987 | $750 | $0.76 | 21d | 1 | 1.13mi |
| 2716 N 31st St #3 McAllen, TX | 3.0 | 1.5 | 940 | $900 | $0.96 | 25d | 1 | 1.13mi |
| 2716 N 31st St #4 McAllen, TX | 3.0 | 1.5 | 940 | $900 | $0.96 | 45d | 1 | 1.13mi |
| 2901 Whitewing Ave Unit 3 McAllen, TX | 2.0 | 2.0 | 1000 | $825 | $0.82 | 45d | 1 | 1.24mi |
| 2816 Gardenia Cir McAllen, TX | 3.0 | 2.0 | 1365 | $3,600 | $2.64 | 45d | 1 | 1.34mi |
| 4616 Xanthisma Ave McAllen, TX | 3.0 | 2.0 | 1332 | $1,950 | $1.46 | 16d | 1 | 1.35mi |
| 2716 N 27th Ln McAllen, TX | 3.0 | 2.5 | 1458 | $1,750 | $1.20 | 16d | 1 | 1.36mi |
HOA detail
- Monthly dues
- $150 · $1,800/yr
- Likely covers
- pool
Listing history 17 events
-
2026-06-22days on market $104,900 Active 159 DOM
-
2026-06-18days on market $104,900 Active 156 DOM
-
2026-06-17days on market $104,900 Active 155 DOM
-
2026-06-16days on market $104,900 Active 154 DOM
-
2026-06-15days on market $104,900 Active 153 DOM
-
2026-06-14days on market $104,900 Active 151 DOM
-
2026-06-10days on market $104,900 Active 148 DOM
-
2026-06-09days on market $104,900 Active 147 DOM
-
2026-06-08days on market $104,900 Active 146 DOM
-
2026-06-07days on market $104,900 Active 145 DOM
-
2026-06-03days on market $104,900 Active 141 DOM
-
2026-06-02days on market $104,900 Active 140 DOM
-
2026-06-01days on market $104,900 Active 139 DOM
-
2026-05-31days on market $104,900 Active 138 DOM
-
2026-05-31days on market $104,900 Active 137 DOM
-
2026-01-13$104,900 Active 941-char remark
Show marketing remark (941 chars)
This well-cared-for 2012 mobile home offers 2 bedrooms, 2 bathrooms, a bonus room, and a golf cart garage. The popular front kitchen design is both functional and open, overlooking the living room and offering ample cabinetry and counter space. The home comes fully furnished and provides plenty of comfortable living space. The primary suite includes a step-in shower, double vanity, and generous storage. The added addition offers flexibility and can be used as a private guest room, craft room, or man cave. Exterior features include a front-facing deck, covered carport, rear-access golf cart garage, and mature fruit trees, enhancing the outdoor space. Located in Adobe Wells, an active 55+ community, residents enjoy a swimming pool, shuffleboard, card games, and an 18-hole Par 3 golf course, all included in the $135 monthly HOA fee. Come experience this relaxed, resort-style lifestyle. Call today to schedule your private showing!
-
2005-05-24soldstatus
ⓘ Source: listings_history table (triggers on properties + properties_extension) + one-shot
backfill from property_details.listing_events for pre-trigger history.
Tax reassessment forecast TX · Resets to sale price
- Current annual tax
- $1,562 · $130/mo
- Projected year-2 tax
- $1,920 · $160/mo
- Expected delta
- +$358/yr (+$30/mo · 22.9%)
ⓘ Screening estimate from a state-policy table — verify with the county assessor before closing.
Nearby sold comps map
Loading sold comps map…
Walkable amenities ~0.75 mi
Loading nearby amenities…
Taxation est. · year 1
- Rental income
- $15,186
- − Mortgage interest
- −$5,876
- − Property taxes
- −$1,562
- − Insurance
- −$524
- − Repairs & maintenance
- −$1,215
- − Management
- −$1,215
- − HOA
- −$1,800
- − Depreciation
- −$3,052
- Taxable loss
- −$58
- Est. tax savings @ 24.0%
- +$14
- After-tax cash flow
- $1,523/yr
For passive investors: Depreciation is non-cash, so a rental often shows a tax loss while cash-flowing — sheltering income. Rental losses are passive: they offset passive income freely, and up to $25,000/yr can offset ordinary (W-2) income if you actively participate and your MAGI is under $100k (phasing out to $0 by $150k); unused losses carry forward. On sale, claimed depreciation is recaptured at up to 25%, and gains may owe capital-gains tax (a 1031 exchange can defer both). Figures are a year-1 estimate at your 24.0% rate — not tax advice; consult a CPA.
Schools (NCES district)
- District
- Sharyland ISD
- NCES district ID
- 4839930
- Math proficiency
- 34% ▼ -35.00%
- Reading proficiency
- 44% ▼ -15.00%
- Median HH income
- $57,792
- Composite
- 34.38/100
- National rank
- #5214
- State rank
- #406 of 826 in TX
Livability — McAllen
- Score
- 76/100
- State rank
- #119
- US rank
- #3771
Category grades
Schools grade is shown separately in the Schools card above.
Census & demographics
- Census place
- McAllen, TX
- County
- Hidalgo County · 623,128 people
- City population
- 144,650
- Metro
- McAllen-Edinburg-Mission, TX
- Population (ZIP)
- 58,935
- Household income
- $48,071
- Rent vs Own
- Severe rent burden
- 3043.0
Population outlook (Hidalgo County) Hauer SSP2
- Today (2025)
- 955,232 people
- By 2030
- 1,009,774 · +5.7%
- By 2040
- 1,120,332 · +17.3%
- By 2050
- 1,225,036 · +28.2%
- By 2075
- 1,439,189 · +50.7%
- By 2100
- 1,533,429 · +60.5%
Race, ethnicity, and origin ACS 2023
- Neighborhood character
- Predominantly Hispanic (89%)
- Race & ethnicity
- Hispanic / Latino 89% Two or more races 32% White 8% Asian 2%
- Hispanic origin (detail)
- Mexican 85%
- Foreign-born
- 28% · Canada, Vietnam
- Languages at home
- 22% English-only · Spanish 76%
Political lean MEDSL · Hidalgo
- 2024 margin
- Toss-up / Even · D 48.1% · R 51.0%
- 2008→2024 swing
- -41.6pp toward R · 2008: 38.7pp · 2024: -2.9pp
- All cycles
- 2024: R+2.9 2020: D+17.1 2016: D+40.5 2012: D+41.8 2008: D+38.7
Not yet ingested
- Civics
- —
Market trends
- HPI YoY
- ▼ -69.99%
- Current HPI
- 230.0213
- Rent YoY
- ▲ 1.78%
- Metro
- McAllen-Edinburg-Mission, TX
- State GDP YoY
- ▲ 3.95%
- F500 in state
- 110
Industry mix (Fortune 500 HQ in TX)
| Industry | F500 HQs | Revenue |
|---|---|---|
| Energy | 16 | $1,198B |
|
||
| Technology | 5 | $198B |
|
||
| Engineering / Construction | 4 | $72B |
|
||
| Energy Services | 3 | $60B |
|
||
| Utilities | 3 | $41B |
|
||
| Healthcare | 2 | $330B |
|
||
Price history
2 events — show timeline
- 2026-01-13 Listed $104,900 MCALLENMLS
- 2005-05-24 Sold (Public Records) — Public Records
Property tax history
+2.2%/yrLatest (2025): $1,562 · +13.7% YoY. Source: county tax records.
Cash-flow waterfall
monthlySold comps — $/sqft
last 12 mo · ≤1 miLoading sold comps…