 🏷️ Likely Rental
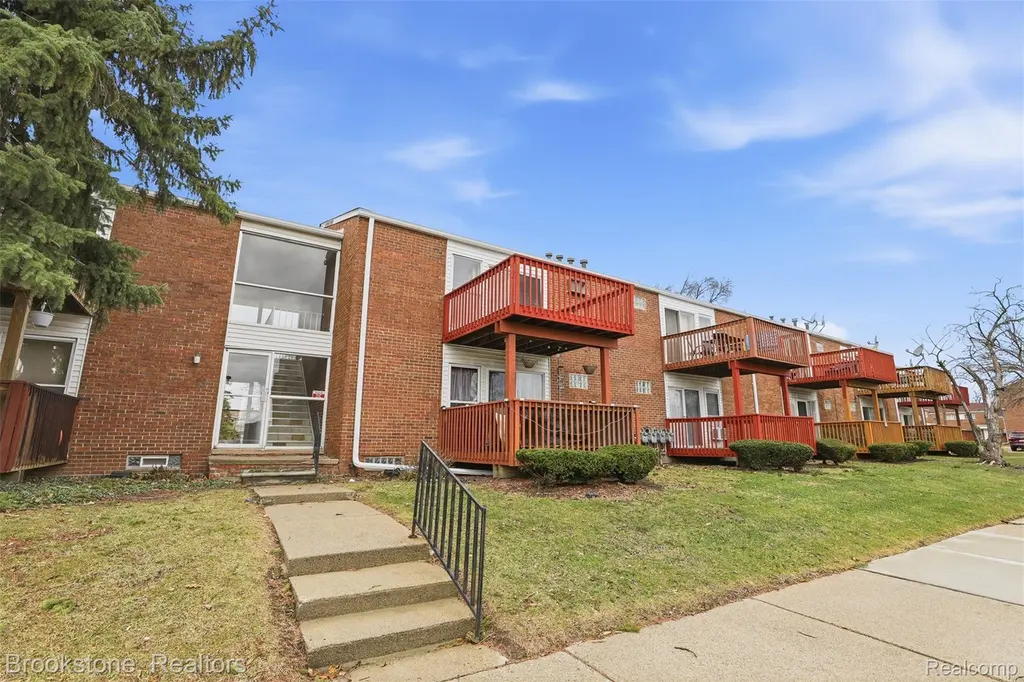
627 McDougall Mcdougall St #77 · Detroit, MI
Flood risk 6/10 · Moderate
- FEMA flood zone
- X (unshaded)
- Chance of flooding over 30 yrs
- 0.68%
- Est. flood insurance / yr
- $473 – $860
Fire risk 1/10 · Minimal
- Est. fire insurance / yr
- $784 – $1,456
Heat risk 3/10 · Minor
- Hot days now (above 95°F)
- 7 days/yr
- Hot days in 30 yrs
- 15 days/yr
Wind risk 2/10 · Minimal
- Chance of severe wind over 30 yrs
- —
Air-quality risk 4/10 · Minor
- Unhealthy air days now
- 6 days/yr
- Unhealthy air days in 30 yrs
- 6 days/yr
Risk factors via First Street. Map © Google.
Why this score? — see what drove the B grade
The composite is a weighted blend of 9 inputs, each scored 0–100. Each bar is that input's sub-score; the figure is the points it added to the 100-point composite (weight × sub-score).
- Cash flow +30.0/30.0
- 1% rule +10.0/10.0
- DSCR +10.0/10.0
- ARV discount +7.5/15.0
- Livability +3.7/5.0
- Appreciation +3.6/10.0
- Rent growth +3.4/5.0
- Condition / age +2.5/5.0
- Schools +1.3/10.0
$69,000
🖨 Deal sheet 📄 Offer letter ✓ Due diligence
Listing remarks MLS
You cannot beat the price!! WHY PAY RENT? 1-bedroom, 1-bath condo just minutes from Downtown Detroit. Convenient access to Belle Isle Park, the Detroit Riverfront, restaurants, nightlife, major hospitals, and quick connections to I-75 and I-94. This 2nd floor unit needs your finishing touches. A little rough around the edges but WOW great price. Ranch layout with skylight and private balcony. Each condo in this building has its own water tank and furnace located in the basement of the building. There is also a small storage area in the basement. This condo can be a rental. Estimated rents range from $1,050–$1,300 per month, making it a great option for first-time buyers or investors seeking an affordable property near Detroit’s growing downtown corridor. BATVAD. * * * see 3D walkthru link * * * * SentriLock access * * * * * . All showings must be accompanied by a licensed real estate agent.
Key facts
- Water tank
- Private balcony
- Convenient access
Tags
Neighborhood map
What this means for you Summary
Snapshot
- This is a 3-bed/2.0-bath condo listed at $69k.
Deal economics
- At list price, monthly cash flow is $734 ($9k/yr) — positive.
- The deal already cash-flows at list — no discount required.
- Meets the 1% rule at list price ($2k rent vs $69k).
- Recommended offer: $65k (6.0% below list) — sets the bar for market timing.
- Cap rate 19.1% vs local median 10.2% in Detroit — top-decile yield for the area; either an underpriced asset or a hidden risk that comps aren't pricing in. Stress-test before assuming the spread holds.
Location & tenants
- Location reads 73/100 on livability (#218 in MI) — a middle-class / working-renter tenant base. Strengths: amenities A+, commute A+, cost of living A+; Watch: schools F, crime F, employment F.
- Detroit Public Schools Community District (urban): math 10% / reading 24% proficiency, ranked #499 of 540 in MI (top 92%) — low school quality limits family demand, transient renter base, plan for 1-2y turnover; 90% free/reduced lunch — lower-income household profile, screen leases tightly.
- Market conditions: Rents rising (+3.5%/yr); 244 active listings in the ZIP; 20 comparable units currently listed for rent nearby; rentals at typical pace (median 18d on market — plan ~3-4 weeks tenant-placement turnaround); 2,639 units permitted in Wayne County in 2024 (1,216 in 5+ unit buildings).
- This rent runs 44% of the median local income ($48k/yr) — at the standard rent-burdened threshold; future hikes will face affordability resistance.
Forward outlook
- Local home prices are declining (-2.8%/yr); year-one equity from $477 of loan paydown is wiped out by about $2k of value loss. Plan a longer hold.
- Wayne County population projected at -17% by 2050 — secular population decline; favor cash flow + early exit over multi-decade hold.
- At projected returns (-2.8% appreciation + 3.5% rent growth), your $19k cash investment doubles in ~3 years — after that, you're playing with house money.
Negotiation context
- It's been on market 87 days — a 6% lower offer ($65k) is reasonable based on typical stale-listing flexibility.
- 2 sale attempts with the ask held roughly flat each time — persistent listings suggest the price (not the market) is what's stuck; bring a comps-based counter.
- Current owner paid $30k; list at $69k implies a 133% gain — meaningful room to come down on a strong offer.
Risks & watch-outs
- Climate carrying-cost: major flood risk — expect insurance premiums to compound above CPI over the hold.
Questions for the listing agent
- It's been on market 87 days. Have you received any prior offers? Is the seller open to a 6% concession, seller financing, or rate buy-down credit?
- Built in 1969 — when were the roof, HVAC, electrical panel, plumbing, and water heater last replaced?
- What does the HOA fee cover, when was the last increase, and are there any pending special assessments or reserve-fund shortfalls?
- Any open or pending special assessments — roof, HVAC, plumbing, elevator, façade? What's the per-unit balance and payoff schedule, and is the seller paying it off at close or rolling it to the buyer?
- Why hasn't it sold? Are there any deal-killer items the seller is aware of (foundation, flood, title, zoning, code violations)?
- Is there a deadline driving the sale (1031 exchange, divorce, estate, relocation)? That informs how much negotiation room exists.
- Schools are F-rated, which usually means shorter tenancies and higher turnover. Who's the typical renter profile here, and what's been the actual vacancy rate?
- Crime grade is F in this area — have there been break-ins, vandalism, or insurance claims at this property in the last 3 years? What carrier currently insures it and at what premium?
- What's the average days-on-market for RENTAL listings here right now (not sales)? A rising rental-DOM trend means longer vacancies and softer asking-rent achievability than the comps imply.
- What's the recent tenant-quality profile in this submarket — average credit score on applications, eviction rate, late-payment / NSF rate, and stable-employment percentage? A property-management company in the area should have these aggregated.
- How much new apartment / multifamily construction is in the pipeline within 1–3 miles? Heavy new supply (>2% of stock underway) typically softens rents 12–24 months out; light construction supports rent growth.
Investment metrics
- 1% rule
- 2.53% ✓
- Cap rate
- 19.05%
- Cash-on-cash
- 45.57%
- DSCR
- 3.03
- GRM
- 3.3
CMA / ARV
- ARV (median comp)
- $139,301
- List price
- $69,000
- Delta
- -50.47%
- Verdict
- UNDERPRICED
- Comps
- 20 within 1.0 mi
Projected returns pro-forma
-2.79% appreciation · 3.53% rent growth · sell at horizon
- IRR
- 43.8%
- Equity multiple
- 2.93×
- Total profit
- $37,223
- Equity at exit
- $10,931
- IRR
- 49.9%
- Equity multiple
- 6.05×
- Total profit
- $97,521
- Equity at exit
- $7,077
Cash invested: $19,320 (down + closing). Projections, not guarantees.
Landlord ↔ Tenant lean methodology
- Overall (STATE)
- 62 Landlord-Friendly
- State Michigan
- 62 Landlord-Friendly · EVEN
- County
- — inherits STATE
- City
- — inherits STATE
ZIP-level market 48207
- Home prices YoY
- -2.0%
- Rents YoY
- 3.5%
- Active inventory
- 244
- Price-to-rent
- 3.3×
Monthly cashflow live
- Estimated rent
- $1,747 high interval (Pro) →
- Mortgage (P&I)
- −$362
- Tax from tax record
- −$49 /mo · $586/yr
- Insurance
- −$29
- HOA
- −$207
- Vacancy / Maint / Mgmt
- −$367
- Net cashflow
- $734
Break-even live
UW: 25.0% down · 7.5% · 30yr · 1.5% tax · 5.0% vac · 8.0% maint · 8.0% mgmt
Financing live
Cash to close
- Down payment
- $17,250
- Closing costs
- $2,070
- Reserves months
- —
- Total cash needed
- —
Loan-product check · same deal, 3 products live
Conventional
25% down · 7.5% · 30yr
- Down + closing
- —
- Monthly P&I
- —
- Monthly cashflow
- —
- DSCR
- —
- Eligible?
- —
Personal DTI + credit; lowest rate.
DSCR
20% down · 8.5% · 30yr
- Down + closing
- —
- Monthly P&I
- —
- Monthly cashflow
- —
- DSCR
- —
- Eligible?
- —
No personal income docs; deal must DSCR.
Hard money
10% down · 12.0% · 12mo
- Down + closing
- —
- Monthly P&I
- —
- Monthly cashflow
- —
- DSCR
- —
- Eligible?
- —
Short-term bridge; refi at stabilization.
Rent comps 20 comps
| Address | Beds | Baths | Sqft | Rent | $/sqft | DOM | Units | Dist |
|---|---|---|---|---|---|---|---|---|
| 2716 Macomb St Detroit, MI | 1.0–2.0 | 1.0–1.5 | 617 | $1,250 | $2.02 | 15d | 1 | 0.28mi |
| 500 River Pl Dr Detroit, MI | 1.0–3.0 | 1.0–2.0 | 950 | $2,000 | $2.11 | 43d | 1 | 0.36mi |
| 1941 Chene Ct Detroit, MI | 1.0–2.0 | 1.0–2.0 | 795 | $1,200 | $1.51 | 12d | 4 | 0.51mi |
| 1544 1566 E LAFAYETTE St Detroit, MI | 2.0 | 1.0–2.0 | 848 | $2,515 | $2.97 | 3d | 16 | 0.77mi |
| 621 Orleans St Detroit, MI | 1.0–2.0 | 1.0 | 775 | $1,425 | $1.84 | 2d | 7 | 0.79mi |
| 2280 E Vernor Hwy Detroit, MI | 1.0–3.0 | 1.0–2.0 | 872 | $1,111 | $1.27 | 20d | 1 | 0.81mi |
| 229 Orleans St Detroit, MI | 1.0–2.0 | 1.0–2.5 | 1087 | $2,779 | $2.56 | 2d | 10 | 0.84mi |
| 320 E Grand Blvd Detroit, MI | 1.0–2.0 | 1.0 | 534 | $1,345 | $2.52 | 43d | 4 | 0.96mi |
| 1387 Larned St Detroit, MI | 2.0 | 1.0–1.5 | 825 | $1,599 | $1.94 | 3d | 8 | 0.97mi |
| 1 Lafayette Plaisance St Detroit, MI | 2.0 | 1.0 | 840 | $2,337 | $2.78 | 1d | 28 | 1.01mi |
| 1405 Rivard St Detroit, MI | 2.0 | 1.0–2.0 | 665 | $2,530 | $3.80 | 3d | 9 | 1.06mi |
| 1001 E Jefferson Ave Detroit, MI | 2.0 | 1.0 | 615 | $2,265 | $3.68 | 43d | 20 | 1.07mi |
| 1001 E Jefferson Ave Detroit, MI | 2.0 | 1.0 | 562 | $2,230 | $3.96 | 3d | 14 | 1.07mi |
| 7700 E Jefferson Ave Detroit, MI | 2.0 | 1.0 | 877 | $1,795 | $2.05 | 43d | 1 | 1.16mi |
| 7800 E Jefferson Ave Detroit, MI | 1.0–2.0 | 1.0 | 625 | $899 | $1.44 | 17d | 1 | 1.23mi |
| 3511 Concord Ave Detroit, MI | 2.0 | 1.0 | 750 | $1,100 | $1.47 | 43d | 1 | 1.33mi |
| 1000 Van Dyke St Detroit, MI | 1.0–2.0 | 1.0 | 751 | $1,295 | $1.72 | 43d | 4 | 1.34mi |
| 8100 E Jefferson Ave Detroit, MI | 3.0 | 1.0–3.0 | 1089 | $2,210 | $2.03 | 19d | 20 | 1.40mi |
| 8001 Kercheval Ave Detroit, MI | 1.0–2.0 | 1.0–2.0 | 984 | $2,270 | $2.31 | 1d | 3 | 1.44mi |
| 310 Gratiot Ave Detroit, MI | 2.0 | 1.0–2.0 | 753 | $3,635 | $4.83 | 20d | 13 | 1.49mi |
HOA detail condo
- Monthly dues
- $207 · $2,484/yr
- Likely covers
- water
- Assessments
- None detected in remarks — confirm with the listing agent.
Listing history 17 events
-
2026-06-17statusdays on market $69,000 Pending 87 DOM
-
2026-06-15days on market $69,000 Active 86 DOM
-
2026-06-13days on market $69,000 Active 84 DOM
-
2026-06-13days on market $69,000 Active 83 DOM
-
2026-06-09days on market $69,000 Active 80 DOM
-
2026-06-08days on market $69,000 Active 79 DOM
-
2026-06-07days on market $69,000 Active 78 DOM
-
2026-06-04days on market $69,000 Active 75 DOM
-
2026-06-03days on market $69,000 Active 74 DOM
-
2026-06-01days on market $69,000 Active 72 DOM
-
2026-05-31days on market $69,000 Active 71 DOM
-
2026-03-21$69,000 Active 927-char remark
Show marketing remark (931 chars)
You cannot beat the price!! WHY PAY RENT? 1-bedroom, 1-bath condo just minutes from Downtown Detroit. Convenient access to Belle Isle Park, the Detroit Riverfront, restaurants, nightlife, major hospitals, and quick connections to I-75 and I-94. This 2nd floor unit needs your finishing touches. A little rough around the edges but WOW great price. Ranch layout with skylight and private balcony. Each condo in this building has its own water tank and furnace located in the basement of the building. There is also a small storage area in the basement. This condo can be a rental. Estimated rents range from $1,050–$1,300 per month, making it a great option for first-time buyers or investors seeking an affordable property near Detroit's growing downtown corridor. BATVAD. * * * see 3D walkthru link * * * * SentriLock access * * * * * . All showings must be accompanied by a licensed real estate agent.
-
2026-03-21$69,000 Active 931-char remark
Show marketing remark (931 chars)
You cannot beat the price!! WHY PAY RENT? 1-bedroom, 1-bath condo just minutes from Downtown Detroit. Convenient access to Belle Isle Park, the Detroit Riverfront, restaurants, nightlife, major hospitals, and quick connections to I-75 and I-94. This 2nd floor unit needs your finishing touches. A little rough around the edges but WOW great price. Ranch layout with skylight and private balcony. Each condo in this building has its own water tank and furnace located in the basement of the building. There is also a small storage area in the basement. This condo can be a rental. Estimated rents range from $1,050–$1,300 per month, making it a great option for first-time buyers or investors seeking an affordable property near Detroit's growing downtown corridor. BATVAD. * * * see 3D walkthru link * * * * SentriLock access * * * * * . All showings must be accompanied by a licensed real estate agent.
-
2019-03-25soldstatus $29,600
-
2016-09-28soldstatus $18,000
-
2016-01-13soldstatus $19,000
-
2014-03-19soldstatus $44,455
ⓘ Source: listings_history table (triggers on properties + properties_extension) + one-shot
backfill from property_details.listing_events for pre-trigger history.
Tax reassessment forecast MI · Partial reset (capped growth)
- Current annual tax
- $586 · $49/mo
- Projected year-2 tax
- $825 · $69/mo
- Expected delta
- +$238/yr (+$20/mo · 40.6%)
ⓘ Screening estimate from a state-policy table — verify with the county assessor before closing.
Climate risk First Street
- Flood 6/10 Major FEMA zone X (unshaded) · 68% chance over 30 yrs
- Wildfire 1/10 Low
- Heat 3/10 Moderate 7 d/yr ≥95°F today · 15 d/yr by 30 yrs out
- Wind 2/10 Low
- Air quality 4/10 Moderate 6 unhealthy d/yr today · 6 by 30 yrs out
Nearby sold comps map
Loading sold comps map…
Walkable amenities ~0.75 mi
Loading nearby amenities…
Taxation est. · year 1
- Rental income
- $20,965
- − Mortgage interest
- −$3,865
- − Property taxes
- −$586
- − Insurance
- −$345
- − Repairs & maintenance
- −$1,677
- − Management
- −$1,677
- − HOA
- −$2,484
- − Depreciation
- −$2,007
- Taxable income
- $8,323
- Est. tax owed @ 24.0%
- −$1,997
- After-tax cash flow
- $6,807/yr
For passive investors: Depreciation is non-cash, so a rental often shows a tax loss while cash-flowing — sheltering income. Rental losses are passive: they offset passive income freely, and up to $25,000/yr can offset ordinary (W-2) income if you actively participate and your MAGI is under $100k (phasing out to $0 by $150k); unused losses carry forward. On sale, claimed depreciation is recaptured at up to 25%, and gains may owe capital-gains tax (a 1031 exchange can defer both). Figures are a year-1 estimate at your 24.0% rate — not tax advice; consult a CPA.
Schools (NCES district)
- District
- Detroit Public Schools Community District
- NCES district ID
- 2601103
- Math proficiency
- 10% ▼ -2.00%
- Reading proficiency
- 24% ▲ 6.00%
- Median HH income
- $25,815
- Composite
- 13.06/100
- National rank
- #9564
- State rank
- #499 of 540 in MI
Livability — Detroit
- Score
- 73/100
- State rank
- #218
- US rank
- #5427
Category grades
Schools grade is shown separately in the Schools card above.
Census & demographics
- Census place
- Detroit, MI
- County
- Wayne County · 1,562,939 people
- City population
- 572,865
- Metro
- Detroit-Warren-Dearborn, MI
- Population (ZIP)
- 20,848
- Household income
- $47,831
- Rent vs Own
- Severe rent burden
- 2017.0
Population outlook (Wayne County) Hauer SSP2
- Today (2025)
- 1,675,273 people
- By 2030
- 1,620,300 · -3.3%
- By 2040
- 1,502,341 · -10.3%
- By 2050
- 1,384,039 · -17.4%
- By 2075
- 1,124,592 · -32.9%
- By 2100
- 881,193 · -47.4%
Race, ethnicity, and origin ACS 2023
- Neighborhood character
- Predominantly Black (74%)
- Race & ethnicity
- Black 74% White 18% Two or more races 4% Asian 3% Hispanic / Latino 2%
- Common ancestry
- Romanian 2% Italian 1% Lithuanian 1%
- Foreign-born
- 5% · Canada, South Korea
- Languages at home
- 94% English-only · Spanish 2% Other Indo-European 1% Arabic 1%
Political lean MEDSL · Wayne
- 2024 margin
- Strong D (+29.0) · D 62.7% · R 33.7% · Other 3.6%
- 2008→2024 swing
- -20.5pp toward R · 2008: 49.5pp · 2024: 29.0pp
- All cycles
- 2024: D+29.0 2020: D+38.1 2016: D+37.3 2012: D+46.9 2008: D+49.5
Not yet ingested
- Civics
- —
Market trends
- HPI YoY
- ▼ -2.79%
- Current HPI
- 136.6328
- Rent YoY
- ▲ 3.53%
- Metro
- Detroit-Warren-Dearborn, MI
- State GDP YoY
- ▲ 1.37%
- F500 in state
- 28
Industry mix (Fortune 500 HQ in MI)
| Industry | F500 HQs | Revenue |
|---|---|---|
| Automotive Parts | 3 | $48B |
|
||
| Automotive | 2 | $372B |
|
||
| Chemicals | 1 | $45B |
|
||
| Automotive Retail | 1 | $29B |
|
||
| Healthcare / Medical Devices | 1 | $23B |
|
||
| Automotive Technology | 1 | $20B |
|
||
Price history
+55.2% since first listed6 events — show timeline
- 2026-03-21 Listed $69,000 MiRealSource-MiMLS
- 2026-03-21 Listed $69,000 REALCOMP
- 2019-03-25 Sold (Public Records) $29,600 Public Records
- 2016-09-28 Sold (Public Records) $18,000 Public Records
- 2016-01-13 Sold (Public Records) $19,000 Public Records
- 2014-03-19 Sold (Public Records) $44,455 Public Records
Property tax history
+9.9%/yrLatest (2025): $586 · -54.8% YoY. Source: county tax records.
Cash-flow waterfall
monthlySold comps — $/sqft
last 12 mo · ≤1 miLoading sold comps…