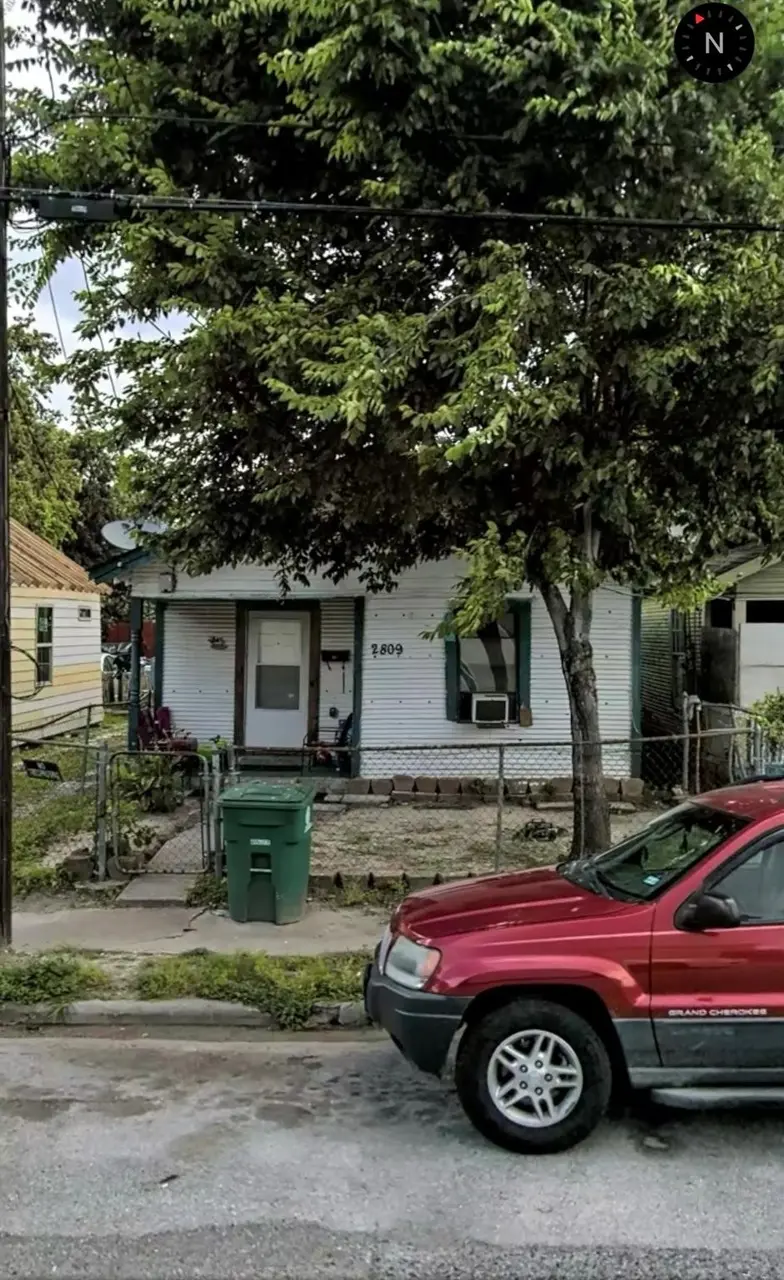
2809 Tuam St · Houston, TX
Flood risk 6/10 · Moderate
- FEMA flood zone
- X (unshaded)
- Chance of flooding over 30 yrs
- 0.69%
- Est. flood insurance / yr
- $507 – $1,088
Fire risk 1/10 · Minimal
- Est. fire insurance / yr
- $1,222 – $2,270
Heat risk 9/10 · Severe
- Hot days now (above 109°F)
- 7 days/yr
- Hot days in 30 yrs
- 24 days/yr
Wind risk 9/10 · Severe
- Chance of severe wind over 30 yrs
- 99.0%
Air-quality risk 2/10 · Minimal
- Unhealthy air days now
- 2 days/yr
- Unhealthy air days in 30 yrs
- 2 days/yr
Risk factors via First Street. Map © Google.
Why this score? — see what drove the C- grade
The composite is a weighted blend of 9 inputs, each scored 0–100. Each bar is that input's sub-score; the figure is the points it added to the 100-point composite (weight × sub-score).
- Cash flow +16.6/30.0
- ARV discount +15.0/15.0
- 1% rule +5.9/10.0
- DSCR +5.1/10.0
- Livability +3.7/5.0
- Schools +2.7/10.0
- Condition / age +2.5/5.0
- Rent growth +2.4/5.0
- Appreciation +0.0/10.0
$125,000
🖨 Deal sheet 📄 Offer letter ✓ Due diligence
Listing remarks MLS
Unique gem in a very UP and COMING area of 3rd Ward Houston. Property is conveniently located minutes from HWY 288 and I45. House is located just blocks from the renewed Emancipation Park and minutes from the University of Houston. Tons of rehab and new build are going in the area! This home does need some TLC but has great bones and tons of potential! This is a great opportunity for rehab or new build! Do not let this deal pass you up! THIS PROPERTY IS ALREADY APPROVED AND PERMITTED FOR BUILD. BUILD OUT BY ARCHITECH ATTACHED! ASK AGENT FOR DETAILS IF INTERESTED!! NO LOW-BALL OFFERS WILL BE ACCEPTED OR ENTERTAINED
Key facts
- 3rd ward houston
- Minutes from hwy 288
- 2,949 sq ft lot
Tags
Neighborhood map
What this means for you Summary
Snapshot
- This is a 2-bed/1.0-bath single-family listed at $125k.
Deal economics
- At list price, monthly cash flow is $75 ($894/yr) — positive.
- The deal already cash-flows at list — no discount required.
- Meets the 1% rule at list price ($1k rent vs $125k).
- Recommended offer: $118k (6.0% below list) — sets the bar for market timing.
- Cap rate 7.0% vs local median 3.2% in Houston — top-decile yield for the area; either an underpriced asset or a hidden risk that comps aren't pricing in. Stress-test before assuming the spread holds.
Location & tenants
- Location reads 74/100 on livability (#184 in TX, #4,771 nationally) — a middle-class / working-renter tenant base. Strengths: amenities A+, cost of living A+, housing A+; Watch: schools D, crime F.
- Houston ISD (urban): math 27% / reading 35% proficiency, ranked #593 of 826 in TX (top 72%) — families likely to look elsewhere, expect single-tenant / working-renter base with shorter leases; 71% free/reduced lunch — lower-income household profile, screen leases tightly.
- Market conditions: Rents soft (-0.3%/yr); 581 active listings in the ZIP; 40 comparable units currently listed for rent nearby; rentals at typical pace (median 25d on market — plan ~3-4 weeks tenant-placement turnaround); 40% of comp listings sitting > 30 days — soft ceiling on asking rent; 29,883 units permitted in Harris County in 2024 (8,621 in 5+ unit buildings).
Forward outlook
- Local home prices are declining (-3.0%/yr); year-one equity from $864 of loan paydown is wiped out by about $4k of value loss. Plan a longer hold.
- Harris County population projected at +47% by 2050 — long-run rental-demand tailwind backs the buy-and-hold thesis.
Negotiation context
- It's been on market 62 days — a 6% lower offer ($118k) is reasonable based on typical stale-listing flexibility.
- 6 sale attempts since 5y ago with the ask held roughly flat each time — persistent listings suggest the price (not the market) is what's stuck; bring a comps-based counter.
Risks & watch-outs
- Watch-outs: property tax is 2.8% of price; built in 1927 — expect roof / HVAC / electrical / plumbing capex.
- Climate carrying-cost: major flood risk; severe wind risk, 99% chance of damaging wind over 30y; extreme-heat days projected 7→24/yr by 2055 (HVAC capex compounding) — expect insurance premiums to compound above CPI over the hold.
Questions for the listing agent
- It's been on market 62 days. Have you received any prior offers? Is the seller open to a 6% concession, seller financing, or rate buy-down credit?
- Built in 1927 — when were the roof, HVAC, electrical panel, plumbing, and water heater last replaced?
- Property tax is high relative to price — has the assessment been appealed recently, and will the sale trigger a re-assessment?
- Why hasn't it sold? Are there any deal-killer items the seller is aware of (foundation, flood, title, zoning, code violations)?
- Is there a deadline driving the sale (1031 exchange, divorce, estate, relocation)? That informs how much negotiation room exists.
- Schools are D-rated, which usually means shorter tenancies and higher turnover. Who's the typical renter profile here, and what's been the actual vacancy rate?
- Crime grade is F in this area — have there been break-ins, vandalism, or insurance claims at this property in the last 3 years? What carrier currently insures it and at what premium?
- What's the average days-on-market for RENTAL listings here right now (not sales)? A rising rental-DOM trend means longer vacancies and softer asking-rent achievability than the comps imply.
- What's the recent tenant-quality profile in this submarket — average credit score on applications, eviction rate, late-payment / NSF rate, and stable-employment percentage? A property-management company in the area should have these aggregated.
- How much new for-sale + rental construction is in the pipeline within 1–3 miles? Heavy new supply typically softens prices + rents 12–24 months out; constrained supply supports both.
Investment metrics
- 1% rule
- 1.09% ✓
- Cap rate
- 7.01%
- Cash-on-cash
- 2.56%
- DSCR
- 1.11
- GRM
- 7.7
CMA / ARV
- ARV (median comp)
- $169,517
- List price
- $125,000
- Delta
- -26.26%
- Verdict
- UNDERPRICED
- Comps
- 12 within 1.0 mi
Show comp detail 3 sales within ~0.75 mi
| Address | Dist | Beds/Ba | Sqft | Sold | Price | $/sf | Match |
|---|---|---|---|---|---|---|---|
| 3324 Beulah St | 0.40mi | 2/1.0 | 648 (+2%) | 6mo | $165,999 | $256 | 72 |
| 2307 Winbern St | 0.54mi | 2/1.0 | 648 (+2%) | 6mo | $135,000 | $208 | 65 |
| 3338 Anita St | 0.41mi | 2/1.0 | 648 (+2%) | 22mo | $499,000 | $770 | 58 |
Match score weights: distance 35% · size 25% · config 20% · recency 20%. Top-matched comps best support the ARV.
Projected returns pro-forma
-3.0% appreciation · 0.0% rent growth · sell at horizon
- IRR
- -16.1%
- Equity multiple
- 0.45×
- Total profit
- $-19,387
- Equity at exit
- $18,638
- IRR
- -15.4%
- Equity multiple
- 0.26×
- Total profit
- $-25,738
- Equity at exit
- $10,808
Cash invested: $35,000 (down + closing). Projections, not guarantees.
Landlord ↔ Tenant lean methodology
- Overall (STATE)
- 87 Strongly Landlord-Friendly
- State Texas
- 87 Strongly Landlord-Friendly · R+5
- County
- — inherits STATE
- City
- — inherits STATE
ZIP-level market 77004
- Rents YoY
- -0.3%
- Active inventory
- 581
- Price-to-rent
- 7.7×
Monthly cashflow live
- Estimated rent
- $1,359 high interval (Pro) →
- Mortgage (P&I)
- −$656
- Tax from tax record
- −$291 /mo · $3,496/yr
- Insurance
- −$52
- HOA
- −$0
- Vacancy / Maint / Mgmt
- −$285
- Net cashflow
- $75
Break-even live
UW: 25.0% down · 7.5% · 30yr · 1.5% tax · 5.0% vac · 8.0% maint · 8.0% mgmt
Financing live
Cash to close
- Down payment
- $31,250
- Closing costs
- $3,750
- Reserves months
- —
- Total cash needed
- —
Loan-product check · same deal, 3 products live
Conventional
25% down · 7.5% · 30yr
- Down + closing
- —
- Monthly P&I
- —
- Monthly cashflow
- —
- DSCR
- —
- Eligible?
- —
Personal DTI + credit; lowest rate.
DSCR
20% down · 8.5% · 30yr
- Down + closing
- —
- Monthly P&I
- —
- Monthly cashflow
- —
- DSCR
- —
- Eligible?
- —
No personal income docs; deal must DSCR.
Hard money
10% down · 12.0% · 12mo
- Down + closing
- —
- Monthly P&I
- —
- Monthly cashflow
- —
- DSCR
- —
- Eligible?
- —
Short-term bridge; refi at stabilization.
Rent comps 40 comps
| Address | Beds | Baths | Sqft | Rent | $/sqft | DOM | Units | Dist |
|---|---|---|---|---|---|---|---|---|
| 2411 Bastrop St Unit 2 Houston, TX | 2.0 | 1.0 | 650 | $900 | $1.38 | 22d | 1 | 0.39mi |
| 2407 Bastrop St Unit 1 R M Houston, TX | 2.0 | 1.0 | 650 | $1,000 | $1.54 | 44d | 1 | 0.40mi |
| 2675 Gray St Houston, TX | 1.0–2.0 | 1.0–2.0 | 838 | $1,057 | $1.26 | 44d | 6 | 0.42mi |
| 3315 Reeves St Unit 3 Houston, TX | 2.0 | 1.0 | 657 | $800 | $1.22 | 5d | 1 | 0.46mi |
| 3339 Simmons St Houston, TX | 2.0 | 1.0 | 697 | $1,000 | $1.43 | 44d | 1 | 0.48mi |
| 2402 Berry St Unit 7 Houston, TX | 1.0 | 1.0 | 700 | $1,850 | $2.64 | 44d | 1 | 0.50mi |
| 3019 Truxillo St Houston, TX | 2.0 | 1.0 | 700 | $900 | $1.29 | 44d | 1 | 0.55mi |
| 1887 Ennis St Houston, TX | 1.0 | 1.0 | 652 | $1,089 | $1.67 | 24d | 2 | 0.56mi |
| 3121 Isabella St #4 Houston, TX | 1.0 | 1.0 | 500 | $900 | $1.80 | 44d | 1 | 0.60mi |
| 3122 Lucinda St Houston, TX | 2.0 | 1.0 | 591 | $855 | $1.45 | 44d | 1 | 0.69mi |
| 3122 Lucinda St Houston, TX | 2.0 | 1.0 | 591 | $855 | $1.45 | 22d | 1 | 0.69mi |
| 3122 Leeland St Houston, TX | 1.0 | 1.0 | 617 | $960 | $1.56 | 44d | 1 | 0.69mi |
| 3448 Coyle St Unit 321 Houston, TX | 1.0 | 1.0 | 713 | $877 | $1.23 | 8d | 1 | 0.70mi |
| 3448 Coyle St Unit 1162 Houston, TX | 1.0 | 1.0 | 713 | $877 | $1.23 | 5d | 1 | 0.70mi |
| 3448 Coyle St Unit 3469 Houston, TX | 1.0 | 1.0 | 713 | $874 | $1.23 | 3d | 1 | 0.70mi |
| 3448 Coyle St Unit 3469 Houston, TX | 1.0 | 1.0 | 713 | $912 | $1.28 | 15d | 1 | 0.70mi |
| 3448 Coyle St Unit 3499 Houston, TX | 1.0 | 1.0 | 713 | $907 | $1.27 | 44d | 1 | 0.70mi |
| 3448 Coyle St Houston, TX | 1.0 | 1.0 | 713 | $866 | $1.21 | 13d | 1 | 0.71mi |
| 3719 Elgin St Houston, TX | 1.0–5.0 | 1.0–5.0 | 1241 | $1,112 | $0.90 | 24d | 14 | 0.79mi |
| 3721 Tuam St Houston, TX | 2.0 | 1.0 | 750 | $900 | $1.20 | 44d | 1 | 0.80mi |
| 1601 Francis St Houston, TX | 1.0 | 1.0 | 650 | $950 | $1.46 | 44d | 1 | 0.85mi |
| 2425 Bell St Houston, TX | 2.0 | 1.0–2.0 | 860 | $2,806 | $3.26 | 3d | 76 | 0.86mi |
| 2649 Austin St Houston, TX | 1.0 | 1.0 | 716 | $1,431 | $2.00 | 44d | 1 | 0.95mi |
| 2649 Austin St Unit CL1 Houston, TX | 1.0 | 1.0 | 716 | $1,431 | $2.00 | 3d | 1 | 0.95mi |
| 2297 Austin St Houston, TX | 1.0 | 1.0 | 557 | $1,400 | $2.51 | 24d | 1 | 0.98mi |
| 2117 Austin St Houston, TX | 1.0 | 1.0 | 735 | $1,425 | $1.94 | 44d | 1 | 0.98mi |
| 2515 Caroline St Houston, TX | 1.0 | 1.0 | 716 | $1,431 | $2.00 | 44d | 1 | 1.00mi |
| 2111 Austin St Houston, TX | 3.0 | 1.0–2.0 | 985 | $2,562 | $2.60 | 5d | 25 | 1.01mi |
| 4804 Delano St Unit 2 Houston, TX | 1.0 | 1.0 | 550 | $800 | $1.45 | 5d | 1 | 1.03mi |
| 1907 Cullen Blvd Houston, TX | 1.0 | 1.0 | 620 | $1,449 | $2.34 | 17d | 1 | 1.06mi |
| 1907 Cullen Blvd Houston, TX | 1.0 | 1.0 | 620 | $1,449 | $2.34 | 44d | 1 | 1.06mi |
| 1711 Caroline St Houston, TX | 1.0–2.0 | 1.0–2.0 | 897 | $2,945 | $3.28 | 2d | 35 | 1.15mi |
| 1825 San Jacinto St Houston, TX | 2.0 | 1.0–2.0 | 865 | $2,769 | $3.20 | 2d | 20 | 1.20mi |
| 2598 Main St Houston, TX | 1.0 | 1.0 | 621 | $1,174 | $1.89 | 24d | 1 | 1.20mi |
| 806 Sampson St Houston, TX | 1.0 | 1.0 | 763 | $1,650 | $2.16 | 2d | 18 | 1.21mi |
| 2727 Travis St Houston, TX | 2.0 | 1.0–2.0 | 1046 | $2,949 | $2.82 | 2d | 24 | 1.22mi |
| 3823 Fannin St Houston, TX | 2.0 | 1.0 | 430 | $950 | $2.21 | 44d | 1 | 1.24mi |
| 4001 Fannin St Houston, TX | 3.0 | 1.0–3.0 | 1536 | $2,479 | $1.61 | 3d | 16 | 1.25mi |
| 3300 Main St Houston, TX | 2.0 | 1.0–2.5 | 558 | $4,055 | $7.27 | 5d | 2 | 1.25mi |
| 3300 Main St Unit 3342 Houston, TX | 1.0 | 1.0 | 558 | $1,694 | $3.04 | 11d | 1 | 1.25mi |
Listing history 30 events
-
2026-06-18days on market $125,000 Active 62 DOM
-
2026-06-17days on market $125,000 Active 61 DOM
-
2026-06-16days on market $125,000 Active 60 DOM
-
2026-06-15days on market $125,000 Active 59 DOM
-
2026-06-13days on market $125,000 Active 57 DOM
-
2026-06-10days on market $125,000 Active 53 DOM
-
2026-06-08days on market $125,000 Active 52 DOM
-
2026-06-07days on market $125,000 Active 51 DOM
-
2026-06-04days on market $125,000 Active 48 DOM
-
2026-06-01days on market $125,000 Active 45 DOM
-
2026-05-31days on market $125,000 Active 44 DOM
-
2026-04-17$125,000 Active 621-char remark
Show marketing remark (621 chars)
Unique gem in a very UP and COMING area of 3rd Ward Houston. Property is conveniently located minutes from HWY 288 and I45. House is located just blocks from the renewed Emancipation Park and minutes from the University of Houston. Tons of rehab and new build are going in the area! This home does need some TLC but has great bones and tons of potential! This is a great opportunity for rehab or new build! Do not let this deal pass you up! THIS PROPERTY IS ALREADY APPROVED AND PERMITTED FOR BUILD. BUILD OUT BY ARCHITECH ATTACHED! ASK AGENT FOR DETAILS IF INTERESTED!! NO LOW-BALL OFFERS WILL BE ACCEPTED OR ENTERTAINED
-
2026-04-03historical
-
2025-04-04status Active
-
2025-03-31historical
-
2025-01-22price $125,000
-
2025-01-22status Active
-
2025-01-16status Option Pending
-
2024-05-16$148,800 Active
-
2022-12-29soldstatus
-
2022-12-23soldstatus Sold
-
2022-12-21status Pending
-
2022-12-20status Option Pending
-
2022-11-13status Pending
-
2022-11-03$95,000 Active
-
2022-11-03historical $95,000
-
2022-09-13historical
-
2022-01-02price $152,800
-
2021-08-30price $182,800
-
2021-08-19$192,800 Active
ⓘ Source: listings_history table (triggers on properties + properties_extension) + one-shot
backfill from property_details.listing_events for pre-trigger history.
Tax reassessment forecast TX · Resets to sale price
- Current annual tax
- $3,496 · $291/mo
- Projected year-2 tax
- $3,496 · $291/mo
- Expected delta
- $0/yr ($0/mo · 0.0%)
ⓘ Screening estimate from a state-policy table — verify with the county assessor before closing.
Climate risk First Street
- Flood 6/10 Major FEMA zone X (unshaded) · 69% chance over 30 yrs
- Wildfire 1/10 Low
- Heat 9/10 Extreme 7 d/yr ≥109°F today · 24 d/yr by 30 yrs out
- Wind 9/10 Extreme 99% chance of damaging wind over 30 yrs
- Air quality 2/10 Low 2 unhealthy d/yr today · 2 by 30 yrs out
Nearby sold comps map
Loading sold comps map…
Walkable amenities ~0.75 mi
Loading nearby amenities…
Taxation est. · year 1
- Rental income
- $16,305
- − Mortgage interest
- −$7,002
- − Property taxes
- −$3,496
- − Insurance
- −$625
- − Repairs & maintenance
- −$1,304
- − Management
- −$1,304
- − Depreciation
- −$3,636
- Taxable loss
- −$1,063
- Est. tax savings @ 24.0%
- +$255
- After-tax cash flow
- $1,149/yr
For passive investors: Depreciation is non-cash, so a rental often shows a tax loss while cash-flowing — sheltering income. Rental losses are passive: they offset passive income freely, and up to $25,000/yr can offset ordinary (W-2) income if you actively participate and your MAGI is under $100k (phasing out to $0 by $150k); unused losses carry forward. On sale, claimed depreciation is recaptured at up to 25%, and gains may owe capital-gains tax (a 1031 exchange can defer both). Figures are a year-1 estimate at your 24.0% rate — not tax advice; consult a CPA.
Schools (NCES district)
- District
- Houston ISD
- NCES district ID
- 4823640
- Math proficiency
- 27% ▼ -18.00%
- Reading proficiency
- 35% ▼ -6.00%
- Median HH income
- $46,054
- Composite
- 26.63/100
- National rank
- #7173
- State rank
- #593 of 826 in TX
Livability — Houston
- Score
- 74/100
- State rank
- #184
- US rank
- #4771
Category grades
Schools grade is shown separately in the Schools card above.
Census & demographics
- Census place
- Houston, TX
- County
- Harris County · 4,702,590 people
- City population
- 3,226,434
- Metro
- Houston-The Woodlands-Sugar Land, TX
- Population (ZIP)
- 35,997
- Household income
- $71,199
- Rent vs Own
- Severe rent burden
- 3072.0
Population outlook (Harris County) Hauer SSP2
- Today (2025)
- 5,571,493 people
- By 2030
- 6,089,821 · +9.3%
- By 2040
- 7,142,806 · +28.2%
- By 2050
- 8,185,864 · +46.9%
- By 2075
- 10,574,329 · +89.8%
- By 2100
- 12,109,958 · +117.4%
Race, ethnicity, and origin ACS 2023
- Neighborhood character
- Diverse neighborhood (Simpson 0.68)
- Race & ethnicity
- Black 48% White 27% Hispanic / Latino 13% Two or more races 11% Asian 8%
- Hispanic origin (detail)
- Mexican 9%
- Common ancestry
- Lithuanian 1% Romanian 1% Italian 1%
- Foreign-born
- 14% · Canada, China, South Korea
- Languages at home
- 82% English-only · Spanish 10% Chinese 2% Other Indo-European 2%
Political lean MEDSL · Harris
- 2024 margin
- Lean D (+5.5) · D 52.0% · R 46.4% · Other 1.6%
- 2008→2024 swing
- +3.9pp toward D · 2008: 1.6pp · 2024: 5.5pp
- All cycles
- 2024: D+5.5 2020: D+13.3 2016: D+12.4 2012: D+0.1 2008: D+1.6
Not yet ingested
- Civics
- —
Market trends
- HPI YoY
- ▼ -139.34%
- Current HPI
- 199.6066
- Rent YoY
- ▼ -0.32%
- Metro
- Houston-The Woodlands-Sugar Land, TX
- State GDP YoY
- ▲ 3.95%
- F500 in state
- 110
Industry mix (Fortune 500 HQ in TX)
| Industry | F500 HQs | Revenue |
|---|---|---|
| Energy | 16 | $1,198B |
|
||
| Technology | 5 | $198B |
|
||
| Engineering / Construction | 4 | $72B |
|
||
| Energy Services | 3 | $60B |
|
||
| Utilities | 3 | $41B |
|
||
| Healthcare | 2 | $330B |
|
||
Price history
-35.2% since first listed19 events — show timeline
- 2026-04-17 Listed $125,000 HARMLS
- 2026-04-03 Listing Removed — HARMLS
- 2025-04-04 Relisted — HARMLS
- 2025-03-31 Listing Removed — HARMLS
- 2025-01-22 Price Changed $125,000 HARMLS
- 2025-01-22 Relisted — HARMLS
- 2025-01-16 Pending — HARMLS
- 2024-05-16 Listed $148,800 HARMLS
- 2022-12-29 Sold (Public Records) — Public Records
- 2022-12-23 Sold (MLS) — HARMLS
- 2022-12-21 Pending — HARMLS
- 2022-12-20 Pending — HARMLS
- 2022-11-13 Pending — HARMLS
- 2022-11-03 Listed $95,000 HARMLS
- 2022-11-03 Coming Soon $95,000 HARMLS
- 2022-09-13 Listing Removed — HARMLS
- 2022-01-02 Price Changed $152,800 HARMLS
- 2021-08-30 Price Changed $182,800 HARMLS
- 2021-08-19 Listed $192,800 HARMLS
Property tax history
+9.3%/yrLatest (2025): $3,496 · -1.1% YoY. Source: county tax records.
Cash-flow waterfall
monthlySold comps — $/sqft
last 12 mo · ≤1 miLoading sold comps…