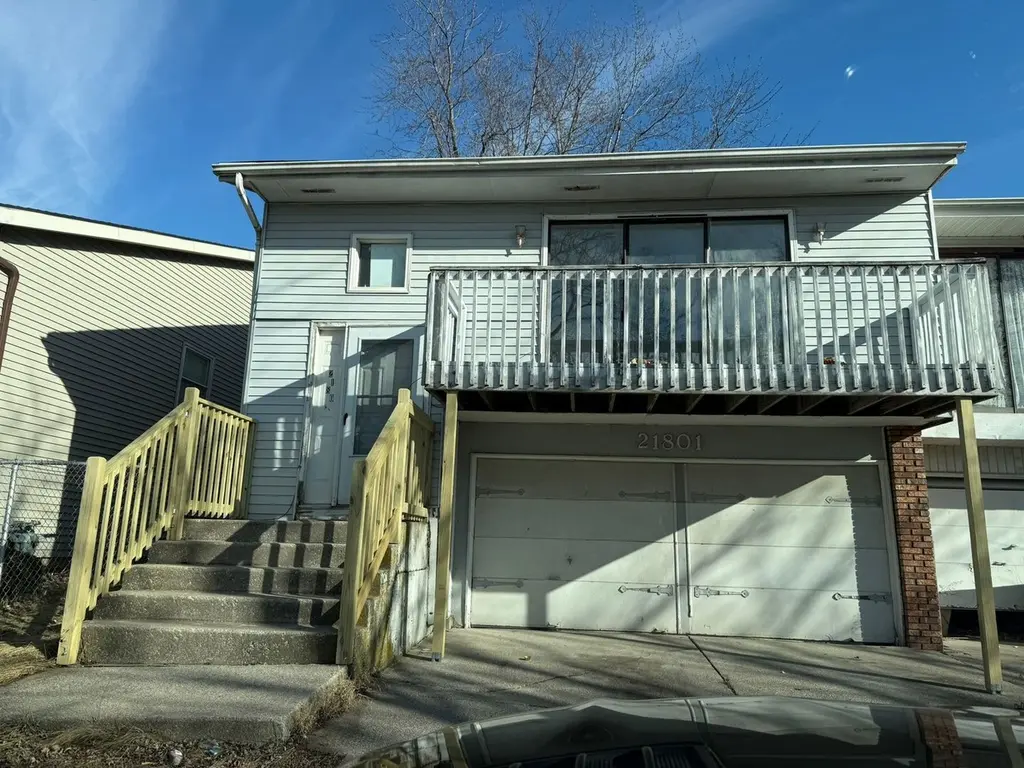
21801 Peterson Ave · Sauk Village, IL
Flood risk 1/10 · Minimal
- FEMA flood zone
- X (unshaded)
- Chance of flooding over 30 yrs
- 0.0%
- Est. flood insurance / yr
- $473 – $860
Fire risk 1/10 · Minimal
- Est. fire insurance / yr
- $804 – $1,492
Heat risk 3/10 · Minor
- Hot days now (above 101°F)
- 7 days/yr
- Hot days in 30 yrs
- 16 days/yr
Wind risk 2/10 · Minimal
- Chance of severe wind over 30 yrs
- 0.0%
Air-quality risk 2/10 · Minimal
- Unhealthy air days now
- 2 days/yr
- Unhealthy air days in 30 yrs
- 2 days/yr
Risk factors via First Street. Map © Google.
Why this score? — see what drove the B+ grade
The composite is a weighted blend of 9 inputs, each scored 0–100. Each bar is that input's sub-score; the figure is the points it added to the 100-point composite (weight × sub-score).
- Cash flow +30.0/30.0
- ARV discount +15.0/15.0
- DSCR +10.0/10.0
- 1% rule +9.9/10.0
- Rent growth +4.1/5.0
- Livability +3.3/5.0
- Condition / age +2.5/5.0
- Schools +0.7/10.0
- Appreciation +0.0/10.0
$150,000
🖨 Deal sheet (PDF) 📄 Offer letter ✓ Due diligence
Listing remarks
FIRST-TIME HOMEBUYERS & INVESTORS!! Welcome to this gorgeous ranch, 4-bedroom, 2-bath home which is everything you are looking for. Spacious living room with bay windows that let in lots of lights will feel warm and inviting in the evening with dimmer lights. Master bedroom has ample closet space and sliding glass doors to the outdoor patio. Kitchen has a crisp clean look with a modern faucet and accent wall. Sliding glass doors to a patio overlook the fenced backyard. Home was completely rehabbed - new roof, floors; new lighting through out; recently updated bathroom; cabinets and counters in the kitchen; even furnace & AC. Easy access to 394 and Indiana; only 30 miles from dow
Key facts
- New lighting
- Sliding glass doors
- Bay windows
Tags
Property features AI
Finance
- Other: Ownership is fee simple
- HOA & community: No master association fee required
Exterior
- Parking: Attached garage (1 car) with total parking for 1 vehicle
- Utilities: Public water; Public sewer
- Home design: Detached single-family raised ranch; Rehab completed in 2024; Estimated living area
- Construction: Vinyl siding and brick exterior; Property age approximately 41–50 years
- Exterior features: Fenced yard; Level lot
Interior
- Kitchen: Kitchen (approx. 14 x 11)
- Bedrooms: Four bedrooms (three on the main level; one in the walkout basement); Main-level bedrooms approx. 15 x 11; master approx. 15 x 13; basement bedroom approx. 15 x 11
- Bathrooms: Two full bathrooms
- Heating & cooling: Natural gas heating; Central air conditioning
- Interior features: Finished full basement with walk-out access; Total of 6 rooms
- Laundry & utility: Main-level laundry (approx. 11 x 5) with gas dryer hookup
Neighborhood map
What this means for you Summary
Snapshot
- This is a 4-bed/1.0-bath single-family listed at $150k.
Deal economics
- At list price, monthly cash flow is $692 ($8k/yr) — positive.
- The deal already cash-flows at list — no discount required.
- Meets the 1% rule at list price ($2k rent vs $150k).
- Recommended offer: $148k (1.5% below list) — sets the bar for market timing.
- Cap rate 11.8% vs local median 8.2% in Sauk Village — top-decile yield for the area; either an underpriced asset or a hidden risk that comps aren't pricing in. Stress-test before assuming the spread holds.
Location & tenants
- Location reads 66/100 on livability (#546 in IL) — a middle-class / working-renter tenant base. Strengths: cost of living A+, housing A+; Watch: crime C-, health & safety D+, commute D.
- Bloom Twp Hsd 206 (suburban): math 8% / reading 9% proficiency, ranked #591 of 620 in IL (top 95%) — low school quality limits family demand, transient renter base, plan for 1-2y turnover.
- Market conditions: Rents rising fast (+6.5%/yr); 224 active listings in the ZIP; 6,272 units permitted in Cook County in 2024 (4,658 in 5+ unit buildings).
- This rent runs 43% of the median local income ($62k/yr) — at the standard rent-burdened threshold; future hikes will face affordability resistance.
Forward outlook
- Local home prices are declining (-3.0%/yr); year-one equity from $1k of loan paydown is wiped out by about $4k of value loss. Plan a longer hold.
- At projected returns (-3.0% appreciation + 6.5% rent growth), your $42k cash investment doubles in ~6 years — after that, you're playing with house money.
Negotiation context
- It's been on market 26 days — a 2% lower offer ($148k) is reasonable based on typical stale-listing flexibility.
- Current owner paid $57k; list at $150k implies a 164% gain — meaningful room to come down on a strong offer.
Questions for the listing agent
- Built in 1978 — when were the roof, HVAC, electrical panel, plumbing, and water heater last replaced?
- Is there a deadline driving the sale (1031 exchange, divorce, estate, relocation)? That informs how much negotiation room exists.
- Schools are F-rated, which usually means shorter tenancies and higher turnover. Who's the typical renter profile here, and what's been the actual vacancy rate?
- What's the average days-on-market for RENTAL listings here right now (not sales)? A rising rental-DOM trend means longer vacancies and softer asking-rent achievability than the comps imply.
- What's the recent tenant-quality profile in this submarket — average credit score on applications, eviction rate, late-payment / NSF rate, and stable-employment percentage? A property-management company in the area should have these aggregated.
- How much new for-sale + rental construction is in the pipeline within 1–3 miles? Heavy new supply typically softens prices + rents 12–24 months out; constrained supply supports both.
Investment metrics
- 1% rule
- 1.49% ✓
- Cap rate
- 11.83%
- Cash-on-cash
- 19.78%
- DSCR
- 1.88
- GRM
- 5.6
CMA / ARV
- ARV (on-the-fly)
- $261,620
- Comps found
- 11
Show comp detail 11 sales within ~0.75 mi
| Address | Dist | Beds/Ba | Sqft | Sold | Price | $/sf | Match |
|---|---|---|---|---|---|---|---|
| 1813 218th Pl | 0.23mi | 4/2.0 | 2,000 (-3%) | 8mo | $290,000 | $145 | 74 |
| 1609 217th Pl | 0.18mi | 5/2.5 (+1) | 2,000 (-3%) | 12mo | $290,000 | $145 | 66 |
| 1615 Constance Ave | 0.47mi | 5/2.0 (+1) | 2,100 (+2%) | 4mo | $301,000 | $143 | 62 |
| 1604 Constance Ave | 0.43mi | 3/2.0 (-1) | 1,895 (-8%) | 1mo | $254,900 | $135 | 56 |
| 22272 Cornell Ave | 0.35mi | 5/2.5 (+1) | 2,100 (+2%) | 16mo | $210,000 | $100 | 56 |
| 1640 215th Pl | 0.43mi | 4/2.0 | 2,000 (-3%) | 19mo | $285,000 | $143 | 56 |
| 1816 Reichert Ave | 0.70mi | 4/2.0 | 1,972 (-4%) | 10mo | $230,000 | $117 | 48 |
| 22255 Merrill Ave | 0.59mi | 5/1.5 (+1) | 1,800 (-13%) | 2mo | $199,900 | $111 | 42 |
| 2105 217th Pl | 0.59mi | 3/1.5 (-1) | 1,840 (-11%) | 23mo | $199,000 | $108 | 28 |
| 2118 223rd St | 0.72mi | 3/1.0 (-1) | 1,800 (-13%) | 17mo | $209,000 | $116 | 26 |
| 1811 225th St | 0.73mi | 5/2.0 (+1) | 1,872 (-9%) | 20mo | $238,000 | $127 | 26 |
Match score weights: distance 35% · size 25% · config 20% · recency 20%. Top-matched comps best support the ARV.
Projected returns pro-forma
-3.0% appreciation · 6.48% rent growth · sell at horizon
- IRR
- 15.9%
- Equity multiple
- 1.67×
- Total profit
- $27,962
- Equity at exit
- $22,365
- IRR
- 27.0%
- Equity multiple
- 3.79×
- Total profit
- $117,115
- Equity at exit
- $12,969
Cash invested: $42,000 (down + closing). Projections, not guarantees.
Landlord ↔ Tenant lean methodology
- Overall (STATE)
- 43 Moderately Tenant-Leaning
- State Illinois
- 43 Moderately Tenant-Leaning · D+7
- County
- — inherits STATE
- City
- — inherits STATE
ZIP-level market 60411
- Home prices YoY
- -33.9%
- Rents YoY
- 6.5%
- Active inventory
- 224
- Price-to-rent
- 5.6×
Monthly cashflow live
- Estimated rent
- $2,238 medium interval (Pro) →
- Mortgage (P&I)
- −$787
- Tax from tax record
- −$226 /mo · $2,714/yr
- Insurance
- −$62
- HOA
- −$0
- Vacancy / Maint / Mgmt
- −$470
- Net cashflow
- $692
Break-even live
Sensitivity live
| Price | -10% $777 | -5% $735 | +0% $692 | +5% $650 | +10% $608 |
|---|---|---|---|---|---|
| Rent | -10% $516 | -5% $604 | +0% $692 | +5% $781 | +10% $869 |
| Rate | -1.0pp $768 | -0.5pp $731 | base $692 | +0.5pp $654 | +1.0pp $614 |
UW: 25.0% down · 7.5% · 30yr · 1.5% tax · 5.0% vac · 8.0% maint · 8.0% mgmt
Financing live
Cash to close
- Down payment
- $37,500
- Closing costs
- $4,500
- Reserves months
- —
- Total cash needed
- —
Loan-product check · same deal, 3 products live
Conventional
25% down · 7.5% · 30yr
- Down + closing
- —
- Monthly P&I
- —
- Monthly cashflow
- —
- DSCR
- —
- Eligible?
- —
Personal DTI + credit; lowest rate.
DSCR
20% down · 8.5% · 30yr
- Down + closing
- —
- Monthly P&I
- —
- Monthly cashflow
- —
- DSCR
- —
- Eligible?
- —
No personal income docs; deal must DSCR.
Hard money
10% down · 12.0% · 12mo
- Down + closing
- —
- Monthly P&I
- —
- Monthly cashflow
- —
- DSCR
- —
- Eligible?
- —
Short-term bridge; refi at stabilization.
Listing history 18 events
-
2026-06-21days on market $150,000 Active 26 DOM
-
2026-06-18days on market $150,000 Active 23 DOM
-
2026-06-17days on market $150,000 Active 22 DOM
-
2026-06-16days on market $150,000 Active 21 DOM
-
2026-06-15days on market $150,000 Active 20 DOM
-
2026-06-13days on market $150,000 Active 18 DOM
-
2026-06-13days on market $150,000 Active 17 DOM
-
2026-06-09days on market $150,000 Active 14 DOM
-
2026-06-08days on market $150,000 Active 13 DOM
-
2026-06-07days on market $150,000 Active 12 DOM
-
2026-06-04days on market $150,000 Active 9 DOM
-
2026-06-03days on market $150,000 Active 8 DOM
-
2026-06-02days on market $150,000 Active 7 DOM
-
2026-06-01days on market $150,000 Active 6 DOM
-
2026-05-31days on market $150,000 Active 5 DOM
-
2026-05-26$150,000 Active
-
1998-09-01soldstatus $56,848
-
1981-03-04soldstatus $12,500
ⓘ Source: listings_history table (triggers on properties + properties_extension) + one-shot
backfill from property_details.listing_events for pre-trigger history.
Tax reassessment forecast IL · Partial reset (capped growth)
- Current annual tax
- $2,714 · $226/mo
- Projected year-2 tax
- $3,059 · $255/mo
- Expected delta
- +$346/yr (+$29/mo · 12.7%)
ⓘ Screening estimate from a state-policy table — verify with the county assessor before closing.
Climate risk First Street
- Flood 1/10 Low FEMA zone X (unshaded) · 0% chance over 30 yrs
- Wildfire 1/10 Low
- Heat 3/10 Moderate 7 d/yr ≥101°F today · 16 d/yr by 30 yrs out
- Wind 2/10 Low 0% chance of damaging wind over 30 yrs
- Air quality 2/10 Low 2 unhealthy d/yr today · 2 by 30 yrs out
Nearby sold comps map
Loading sold comps map…
Walkable amenities ~0.75 mi
Loading nearby amenities…
Taxation est. · year 1
- Rental income
- $26,851
- − Mortgage interest
- −$8,402
- − Property taxes
- −$2,714
- − Insurance
- −$750
- − Repairs & maintenance
- −$2,148
- − Management
- −$2,148
- − Depreciation
- −$4,364
- Taxable income
- $6,325
- Est. tax owed @ 24.0%
- −$1,518
- After-tax cash flow
- $6,791/yr
For passive investors: Depreciation is non-cash, so a rental often shows a tax loss while cash-flowing — sheltering income. Rental losses are passive: they offset passive income freely, and up to $25,000/yr can offset ordinary (W-2) income if you actively participate and your MAGI is under $100k (phasing out to $0 by $150k); unused losses carry forward. On sale, claimed depreciation is recaptured at up to 25%, and gains may owe capital-gains tax (a 1031 exchange can defer both). Figures are a year-1 estimate at your 24.0% rate — not tax advice; consult a CPA.
Schools (NCES district)
- District
- Bloom Twp Hsd 206
- NCES district ID
- 1706420
- Math proficiency
- 8% ▼ -3.00%
- Reading proficiency
- 9% ▼ -8.00%
- Median HH income
- $39,795
- Composite
- 7.4/100
- National rank
- #9952
- State rank
- #591 of 620 in IL
Livability — Sauk Village
- Score
- 66/100
- State rank
- #546
- US rank
- #11370
Category grades
Schools grade is shown separately in the Schools card above.
Census & demographics
- Census place
- Sauk Village, IL
- County
- Cook County · 4,486,803 people
- Metro
- Chicago-Naperville-Elgin, IL-IN-WI
- Population (ZIP)
- 52,175
- Household income
- $62,073
- Rent vs Own
- Severe rent burden
- 1714.0
Population outlook (Cook County) Hauer SSP2
- Today (2025)
- 5,347,519 people
- By 2030
- 5,357,703 · +0.2%
- By 2040
- 5,324,924 · -0.4%
- By 2050
- 5,230,762 · -2.2%
- By 2075
- 4,785,735 · -10.5%
- By 2100
- 4,188,836 · -21.7%
Race, ethnicity, and origin ACS 2023
- Neighborhood character
- Diverse neighborhood (Simpson 0.66)
- Race & ethnicity
- Black 49% Hispanic / Latino 26% White 19% Two or more races 11%
- Hispanic origin (detail)
- Mexican 22% Puerto Rican 2%
- Common ancestry
- Romanian 4% Portuguese 1% Lithuanian 1%
- Foreign-born
- 12% · Canada
- Languages at home
- 76% English-only · Spanish 21% Russian/Polish/Slavic 1% Other Indo-European 1%
Political lean MEDSL · Cook
- 2024 margin
- Solid D (+42.0) · D 70.4% · R 28.4% · Other 1.2%
- 2008→2024 swing
- -11.4pp toward R · 2008: 53.4pp · 2024: 42.0pp
- All cycles
- 2024: D+42.0 2020: D+50.3 2016: D+53.0 2012: D+49.4 2008: D+53.4
Not yet ingested
- Civics
- —
Market trends
- HPI YoY
- ▼ -108.75%
- Current HPI
- 212.4058
- Rent YoY
- ▲ 6.48%
- Metro
- Chicago-Naperville-Elgin, IL-IN-WI
- State GDP YoY
- ▲ 1.59%
- F500 in state
- 60
Industry mix (Fortune 500 HQ in IL)
| Industry | F500 HQs | Revenue |
|---|---|---|
| Insurance | 4 | $201B |
|
||
| Consumer Goods | 4 | $87B |
|
||
| Industrial Machinery | 3 | $64B |
|
||
| Healthcare | 2 | $55B |
|
||
| Retail / Pharmacy | 1 | $148B |
|
||
| Agriculture / Food | 1 | $86B |
|
||
Price history
+1100.0% since first listed3 events — show timeline
- 2026-05-26 Listed $150,000 MRED as Distributed by MLS Grid
- 1998-09-01 Sold (Public Records) $56,848 Public Records
- 1981-03-04 Sold (Public Records) $12,500 Public Records
Property tax history
+3.9%/yrLatest (2023): $2,714 · +192.3% YoY. Source: county tax records.
Cash-flow waterfall
monthlySold comps — $/sqft
last 12 mo · ≤1 miLoading sold comps…