 🏗️ New Construction
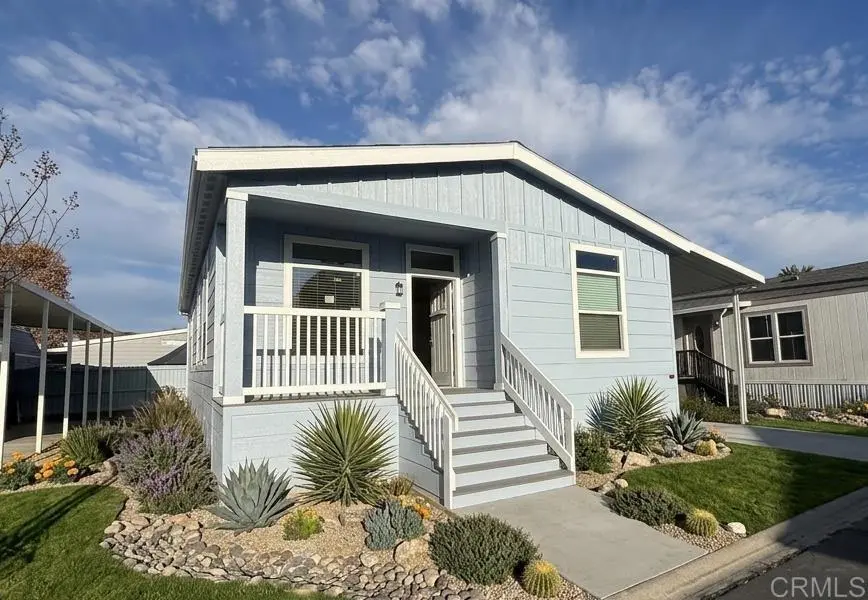
1499 Old Mountain Ave #15 · San Jacinto, CA
Flood risk 1/10 · Minimal
- FEMA flood zone
- X
- Chance of flooding over 30 yrs
- 0.0%
- Est. flood insurance / yr
- $507 – $1,088
Fire risk 7/10 · Major
- Est. fire insurance / yr
- $659 – $1,223
Heat risk 7/10 · Major
- Hot days now (above 103°F)
- 5 days/yr
- Hot days in 30 yrs
- 14 days/yr
Wind risk 1/10 · Minimal
- Chance of severe wind over 30 yrs
- —
Air-quality risk 6/10 · Moderate
- Unhealthy air days now
- 11 days/yr
- Unhealthy air days in 30 yrs
- 13 days/yr
Risk factors via First Street. Map © Google.
Why this score? — see what drove the B grade
The composite is a weighted blend of 9 inputs, each scored 0–100. Each bar is that input's sub-score; the figure is the points it added to the 100-point composite (weight × sub-score).
- Cash flow +30.0/30.0
- 1% rule +10.0/10.0
- DSCR +10.0/10.0
- ARV discount +7.5/15.0
- Condition / age +4.8/5.0
- Rent growth +3.2/5.0
- Livability +3.2/5.0
- Schools +2.1/10.0
- Appreciation +0.0/10.0
$225,500
🖨 Deal sheet 📄 Offer letter ✓ Due diligence
Listing remarks
MUST SEE! Brand-new 2026 home features a modern open floor plan with brand-new stainless steel appliances and central a/c! The spacious layout seamlessly connects the dining room, living room, and kitchen—perfect for entertaining—centered around a large kitchen island with seating. Enjoy a covered porch with a durable deck, generous bedroom sizes with ample closet space, and thoughtfully designed bathrooms, including a guest bath with a tub/shower combo. The primary suite with dual sinks, built-in storage, and a walk-in shower. A dedicated office space just off the living room adds extra flexibility for work or hobbies. With extremely low space rent of only $450, this home offer
Key facts
- Covered porch
- Large kitchen island
- 4,200 sq ft lot
Tags
Property features AI
Finance
- Other: Lot size and living area listed as estimated; Year built source: Builder
- Financial info: Monthly land lease: $450
- HOA & community: Senior community; Community features include biking, hiking, dog park; suburban setting; Park name: Villa Del Monte; Manager approval required; Pets allowed
Exterior
- Parking: Covered carport (2 spaces)
- Utilities: Electricity connected
- Home design: Single-story manufactured home (Model: Coronado 28523B); Entry on main level; Under construction / Turnkey condition
- Construction: Composition roof; Mobile home remains on site; Approximately 27 ft wide by 52 ft long
- Exterior features: Front porch; Patio; Community pool; Rectangular, level lot; Has view
Interior
- Kitchen: Gas cooking; Free-standing range; Microwave; Dishwasher; Garbage disposal; Refrigerator; Ice maker; Water heater unit
- Bedrooms: Primary bedroom; All bedrooms on main level; Office
- Flooring: Vinyl flooring; Carpet
- Bathrooms: Two full bathrooms; Master bathroom with double sinks, bathtub and separate shower; Exhaust fan(s)
- Heating & cooling: Forced air heating
- Interior features: Ceiling fan; Panel doors; Double-pane windows with low-E glass, blinds and screens; One-level living
- Laundry & utility: Separate laundry room; Washer hookup; Gas dryer hookup
Neighborhood map
What this means for you Summary
Snapshot
- This is a 2-bed/2.0-bath manufactured listed at $226k. Condition is rated excellent.
Deal economics
- At list price, monthly cash flow is $1k ($13k/yr) — positive.
- The deal already cash-flows at list — no discount required.
- To meet the 1% rule (rent ≥ 1% of price), the offer needs to be $223k (1.1% below list).
- Recommended offer: $222k (1.5% below list) — sets the bar for market timing.
- Cap rate 20.4% vs local median 3.8% in San Jacinto — top-decile yield for the area; either an underpriced asset or a hidden risk that comps aren't pricing in. Stress-test before assuming the spread holds.
Location & tenants
- Location reads 63/100 on livability (#467 in CA) — a middle-class / working-renter tenant base. Strengths: housing A+; Watch: employment D+, schools D-, amenities F.
- San Jacinto Unified (suburban): math 13% / reading 36% proficiency, ranked #421 of 517 in CA (top 81%) — low school quality limits family demand, transient renter base, plan for 1-2y turnover; 68% free/reduced lunch — lower-income household profile, screen leases tightly.
- Market conditions: Rents rising (+2.6%/yr); 159 active listings in the ZIP; 16 comparable units currently listed for rent nearby; rentals at typical pace (median 24d on market — plan ~3-4 weeks tenant-placement turnaround); 9,195 units permitted in Riverside County in 2024 (1,512 in 5+ unit buildings).
- This rent runs 39% of the median local income ($68k/yr) — at the standard rent-burdened threshold; future hikes will face affordability resistance.
Forward outlook
- Local home prices are declining (-3.0%/yr); year-one equity from $652 of loan paydown is wiped out by about $3k of value loss. Plan a longer hold.
- Riverside County population projected at +22% by 2050 — long-run rental-demand tailwind backs the buy-and-hold thesis.
- At projected returns (-3.0% appreciation + 2.6% rent growth), your $26k cash investment doubles in ~3 years — after that, you're playing with house money.
Negotiation context
- It's been on market 15 days — a 2% lower offer ($222k) is reasonable based on typical stale-listing flexibility.
Risks & watch-outs
- Climate carrying-cost: major wildfire risk; extreme-heat days projected 5→14/yr by 2055 (HVAC capex compounding) — expect insurance premiums to compound above CPI over the hold.
Questions for the listing agent
- Is there a deadline driving the sale (1031 exchange, divorce, estate, relocation)? That informs how much negotiation room exists.
- Schools are D-rated, which usually means shorter tenancies and higher turnover. Who's the typical renter profile here, and what's been the actual vacancy rate?
- What's the average days-on-market for RENTAL listings here right now (not sales)? A rising rental-DOM trend means longer vacancies and softer asking-rent achievability than the comps imply.
- What's the recent tenant-quality profile in this submarket — average credit score on applications, eviction rate, late-payment / NSF rate, and stable-employment percentage? A property-management company in the area should have these aggregated.
- How much new for-sale + rental construction is in the pipeline within 1–3 miles? Heavy new supply typically softens prices + rents 12–24 months out; constrained supply supports both.
Investment metrics
- 1% rule
- 2.37% ✓
- Cap rate
- 20.42%
- Cash-on-cash
- 50.47%
- DSCR
- 3.25
- GRM
- 3.5
CMA / ARV
- ARV (on-the-fly)
- $94,316
- Comps found
- 9
Show comp detail 9 sales within ~0.75 mi
| Address | Dist | Beds/Ba | Sqft | Sold | Price | $/sf | Match |
|---|---|---|---|---|---|---|---|
| 1499 Old Mountain Ave #14 | 0.09mi | 2/2.0 | 1,400 (+1%) | 3mo | $41,500 | $30 | 92 |
| 1499 Old Mtn #88 | 0.09mi | 2/2.0 | 1,344 (-3%) | 0mo | $80,000 | $60 | 90 |
| 1499 Old Mtn #51 | 0.09mi | 2/2.0 | 1,456 (+5%) | 2mo | $120,000 | $82 | 86 |
| 1499 Old Mountain Ave #93 | 0.11mi | 2/2.0 | 1,440 (+4%) | 9mo | $91,500 | $64 | 81 |
| 1499 Old Mountain Ave #30 | 0.09mi | 2/2.0 | 1,440 (+4%) | 11mo | $115,000 | $80 | 81 |
| 1499 Old Mountain Ave #145 | 0.09mi | 2/2.0 | 1,440 (+4%) | 11mo | $110,000 | $76 | 80 |
| 1499 Old Mountain Ave #123 | 0.10mi | 2/2.0 | 1,400 (+1%) | 23mo | $95,000 | $68 | 75 |
| 1499 Old Mountain Ave #128 | 0.09mi | 2/2.0 | 1,440 (+4%) | 20mo | $100,000 | $69 | 73 |
| 1499 Old Mountain Ave #21 | 0.09mi | 2/2.0 | 1,482 (+7%) | 17mo | $95,000 | $64 | 71 |
Match score weights: distance 35% · size 25% · config 20% · recency 20%. Top-matched comps best support the ARV.
Projected returns pro-forma
-3.0% appreciation · 2.61% rent growth · sell at horizon
- IRR
- 47.8%
- Equity multiple
- 3.07×
- Total profit
- $54,614
- Equity at exit
- $14,063
- IRR
- 53.3%
- Equity multiple
- 6.12×
- Total profit
- $135,228
- Equity at exit
- $8,155
Cash invested: $26,408 (down + closing). Projections, not guarantees.
Landlord ↔ Tenant lean methodology
- Overall (STATE)
- 18 Strongly Tenant-Friendly
- State California
- 18 Strongly Tenant-Friendly · D+13
- County
- — inherits STATE
- City
- — inherits STATE
ZIP-level market 92583
- Home prices YoY
- -14.8%
- Rents YoY
- 2.6%
- Active inventory
- 159
- Price-to-rent
- 8.4×
Monthly cashflow live
- Estimated rent
- $2,231 high interval (Pro) →
- Mortgage (P&I)
- −$495
- Tax est. 1.5%
- −$118 /mo · $1,415/yr
- Insurance
- −$39
- HOA
- −$0
- Vacancy / Maint / Mgmt
- −$468
- Net cashflow
- $1,111
Break-even live
UW: 25.0% down · 7.5% · 30yr · 1.5% tax · 5.0% vac · 8.0% maint · 8.0% mgmt
Financing live
Cash to close
- Down payment
- $23,579
- Closing costs
- $2,829
- Reserves months
- —
- Total cash needed
- —
Loan-product check · same deal, 3 products live
Conventional
25% down · 7.5% · 30yr
- Down + closing
- —
- Monthly P&I
- —
- Monthly cashflow
- —
- DSCR
- —
- Eligible?
- —
Personal DTI + credit; lowest rate.
DSCR
20% down · 8.5% · 30yr
- Down + closing
- —
- Monthly P&I
- —
- Monthly cashflow
- —
- DSCR
- —
- Eligible?
- —
No personal income docs; deal must DSCR.
Hard money
10% down · 12.0% · 12mo
- Down + closing
- —
- Monthly P&I
- —
- Monthly cashflow
- —
- DSCR
- —
- Eligible?
- —
Short-term bridge; refi at stabilization.
Rent comps 16 comps
| Address | Beds | Baths | Sqft | Rent | $/sqft | DOM | Units | Dist |
|---|---|---|---|---|---|---|---|---|
| 1129 Osprey St San Jacinto, CA | 3.0 | 2.0 | 1582 | $2,700 | $1.71 | 43d | 1 | 0.39mi |
| 1939 Hooper Dr San Jacinto, CA | 2.0 | 2.0 | 1111 | $1,950 | $1.76 | 24d | 1 | 0.82mi |
| 1809 Rue Chenin Blanc San Jacinto, CA | 3.0 | 2.0 | 1548 | $2,500 | $1.61 | 5d | 1 | 0.94mi |
| 620 E Main St San Jacinto, CA | 2.0 | 2.0 | 900 | $1,600 | $1.78 | 24d | 1 | 0.99mi |
| 1354 Yorktown Cir San Jacinto, CA | 2.0 | 2.0 | 1106 | $2,100 | $1.90 | 43d | 1 | 1.04mi |
| 795 Minor St Unit A San Jacinto, CA | 2.0 | 1.0 | 878 | $1,700 | $1.94 | 24d | 1 | 1.05mi |
| 621 S Mistletoe Ave San Jacinto, CA | 2.0 | 2.0 | 1500 | $2,000 | $1.33 | 43d | 1 | 1.06mi |
| 800 Minor St San Jacinto, CA | 2.0 | 1.0 | 878 | $1,600 | $1.82 | 1d | 1 | 1.08mi |
| 784 Minor St Unit B San Jacinto, CA | 2.0 | 1.0 | 878 | $1,700 | $1.94 | 24d | 1 | 1.10mi |
| 700 Minor St San Jacinto, CA | 2.0 | 1.0 | 878 | $1,700 | $1.94 | 24d | 1 | 1.10mi |
| 700 Minor St San Jacinto, CA | 2.0 | 1.0 | 878 | $1,600 | $1.82 | 43d | 1 | 1.10mi |
| 748 Minor St Apt F San Jacinto, CA | 2.0 | 1.0 | 878 | $1,600 | $1.82 | 43d | 1 | 1.11mi |
| 344 E 6th St San Jacinto, CA | 2.0 | 1.0 | 900 | $1,900 | $2.11 | 24d | 1 | 1.25mi |
| 492 Foursquare Pl San Jacinto, CA | 3.0 | 2.0 | 1573 | $3,500 | $2.23 | 1d | 1 | 1.28mi |
| 646 Field Maple Pl GLMN HOT SPGS, CA | 3.0–4.0 | 2.0–3.0 | 1825 | $2,850 | $1.56 | 1d | 9 | 1.48mi |
| 904 Bergamo Ave San Jacinto, CA | 2.0 | 2.0 | 1596 | $2,600 | $1.63 | 10d | 1 | 1.48mi |
Listing history 11 events
-
2026-06-18days on market $225,500 Active 15 DOM
-
2026-06-17days on market $225,500 Active 14 DOM
-
2026-06-16days on market $225,500 Active 13 DOM
-
2026-06-15days on market $225,500 Active 12 DOM
-
2026-06-13days on market $225,500 Active 10 DOM
-
2026-06-13days on market $225,500 Active 9 DOM
-
2026-06-09days on market $225,500 Active 6 DOM
-
2026-06-08days on market $225,500 Active 5 DOM
-
2026-06-07days on market $225,500 Active 4 DOM
-
2026-06-04remarks 687-char remark
-
2026-06-04$225,500 Active 1 DOM
ⓘ Source: listings_history table (triggers on properties + properties_extension) + one-shot
backfill from property_details.listing_events for pre-trigger history.
Climate risk First Street
- Flood 1/10 Low FEMA zone X · 0% chance over 30 yrs
- Wildfire 7/10 Severe
- Heat 7/10 Severe 5 d/yr ≥103°F today · 14 d/yr by 30 yrs out
- Wind 1/10 Low
- Air quality 6/10 Major 11 unhealthy d/yr today · 13 by 30 yrs out
Nearby sold comps map
Loading sold comps map…
Walkable amenities ~0.75 mi
Loading nearby amenities…
Taxation est. · year 1
- Rental income
- $26,771
- − Mortgage interest
- −$5,283
- − Property taxes
- −$1,415
- − Insurance
- −$472
- − Repairs & maintenance
- −$2,142
- − Management
- −$2,142
- − Depreciation
- −$2,744
- Taxable income
- $12,574
- Est. tax owed @ 24.0%
- −$3,018
- After-tax cash flow
- $10,310/yr
For passive investors: Depreciation is non-cash, so a rental often shows a tax loss while cash-flowing — sheltering income. Rental losses are passive: they offset passive income freely, and up to $25,000/yr can offset ordinary (W-2) income if you actively participate and your MAGI is under $100k (phasing out to $0 by $150k); unused losses carry forward. On sale, claimed depreciation is recaptured at up to 25%, and gains may owe capital-gains tax (a 1031 exchange can defer both). Figures are a year-1 estimate at your 24.0% rate — not tax advice; consult a CPA.
Condition & rehab AI · 13 photos
This home is in excellent condition with a modern, open floor plan and high-end finishes. It is move-in ready and would be a great investment.
Value-add opportunities
- Both Landscaping — Enhances curb appeal and adds value
- Both Painting — Fresh paint can make the home look more inviting
- Both Landscaping improvements — Enhances curb appeal and adds value
Renovation cost estimate screening
Value-add ROI direction
- Both Landscaping — Enhances curb appeal and adds value ↑
- Both Painting — Fresh paint can make the home look more inviting ↑
- Both Landscaping improvements — Enhances curb appeal and adds value ↑
ⓘ Cost ranges are severity-bucket heuristics (US national rule-of-thumb). Get contractor quotes + a written scope before underwriting a rehab budget.
Schools (NCES district)
- District
- San Jacinto Unified
- NCES district ID
- 0634440
- Math proficiency
- 13% ▼ -9.00%
- Reading proficiency
- 36% ▬ 0.00%
- Median HH income
- $43,560
- Composite
- 20.94/100
- National rank
- #8478
- State rank
- #421 of 517 in CA
Livability — San Jacinto
- Score
- 63/100
- State rank
- #467
- US rank
- #15889
Category grades
Schools grade is shown separately in the Schools card above.
Census & demographics
- Census place
- San Jacinto, CA
- County
- Riverside County · 2,287,001 people
- City population
- 33,778
- Metro
- Riverside-San Bernardino-Ontario, CA
- Population (ZIP)
- 33,778
- Household income
- $68,351
- Rent vs Own
- Severe rent burden
- 747.0
Population outlook (Riverside County) Hauer SSP2
- Today (2025)
- 2,664,475 people
- By 2030
- 2,802,692 · +5.2%
- By 2040
- 3,050,904 · +14.5%
- By 2050
- 3,256,783 · +22.2%
- By 2075
- 3,655,058 · +37.2%
- By 2100
- 3,766,594 · +41.4%
Race, ethnicity, and origin ACS 2023
- Neighborhood character
- Diverse neighborhood (Simpson 0.57)
- Race & ethnicity
- Hispanic / Latino 60% White 26% Two or more races 23% Black 5% Asian 3% Native American 3%
- Hispanic origin (detail)
- Mexican 52%
- Common ancestry
- Lithuanian 1% Iranian 1% Portuguese 1%
- Foreign-born
- 20% · Canada
- Languages at home
- 56% English-only · Spanish 40% Tagalog/Filipino 2% Other Asian/Pacific 1%
Political lean MEDSL · Riverside
- 2024 margin
- Toss-up / Even · D 48.0% · R 49.3% · Other 2.6%
- 2008→2024 swing
- -3.6pp toward R · 2008: 2.3pp · 2024: -1.3pp
- All cycles
- 2024: R+1.3 2020: D+8.0 2016: D+4.3 2012: R+0.4 2008: D+2.3
Not yet ingested
- Civics
- —
Market trends
- HPI YoY
- ▼ -71.15%
- Current HPI
- 407.8584
- Rent YoY
- ▲ 2.61%
- Metro
- Riverside-San Bernardino-Ontario, CA
- State GDP YoY
- ▲ 3.21%
- F500 in state
- 116
Industry mix (Fortune 500 HQ in CA)
| Industry | F500 HQs | Revenue |
|---|---|---|
| Technology | 27 | $1,492B |
|
||
| Financial Services | 3 | $174B |
|
||
| Retail | 3 | $44B |
|
||
| Insurance | 3 | $26B |
|
||
| Media / Entertainment | 2 | $115B |
|
||
| Pharmaceuticals / Biotech | 2 | $62B |
|
||
Price history
+2.7% since first listed2 events — show timeline
- 2026-06-04 Price Changed $225,500 CRMLS
- 2026-06-03 Listed $219,500 CRMLS
Cash-flow waterfall
monthlySold comps — $/sqft
last 12 mo · ≤1 miLoading sold comps…