1011 Rock Fork Rd · Wayland, KY
Flood risk No data
- FEMA flood zone
- —
- Chance of flooding over 30 yrs
- —
- Est. flood insurance / yr
- —
Fire risk No data
- Est. fire insurance / yr
- —
Heat risk No data
- Hot days now (above threshold)
- —
- Hot days in 30 yrs
- —
Wind risk No data
- Chance of severe wind over 30 yrs
- —
Air-quality risk No data
- Unhealthy air days now
- —
- Unhealthy air days in 30 yrs
- —
Risk factors via First Street. Map © Google.
Why this score? — see what drove the D+ grade
The composite is a weighted blend of 9 inputs, each scored 0–100. Each bar is that input's sub-score; the figure is the points it added to the 100-point composite (weight × sub-score).
- Cash flow +15.0/30.0
- ARV discount +7.5/15.0
- 1% rule +5.0/10.0
- DSCR +5.0/10.0
- Appreciation +3.7/10.0
- Livability +2.7/5.0
- Rent growth +2.5/5.0
- Schools +2.5/10.0
- Condition / age +2.0/5.0
$25,000
🖨 Deal sheet 📄 Offer letter ✓ Due diligence
Listing remarks
Home must be moved off property or all materials can be sold as a whole package for 25000 or will sell individual parts like windows, doors, lights, heat pump cabinets and granite counter tops. Call for more information
Key facts
- Built 2012
Neighborhood map
What this means for you Summary
Snapshot
- This is a 3-bed/2.0-bath single-family listed at $25k. Condition is rated fair.
Deal economics
- At list price, monthly cash flow is $759 ($9k/yr) — positive.
- The deal already cash-flows at list — no discount required.
- Meets the 1% rule at list price ($1k rent vs $25k).
Location & tenants
- Location reads 54/100 on livability (#475 in KY) — a working-class tenant base; expect higher turnover. Strengths: crime A+, cost of living A+; Watch: housing D, schools F, amenities F.
- Knott County (rural): math 23% / reading 39% proficiency, ranked #109 of 165 in KY (top 66%) — families likely to look elsewhere, expect single-tenant / working-renter base with shorter leases; 62% free/reduced lunch — lower-income household profile, screen leases tightly.
- Market conditions: 10 active listings in the ZIP.
Forward outlook
- Local home prices are declining (-2.7%/yr); year-one equity from $173 of loan paydown is wiped out by about $669 of value loss. Plan a longer hold.
- Knott County population projected at -28% by 2050 — secular population decline; favor cash flow + early exit over multi-decade hold.
- At projected returns (-2.7% appreciation + 3.0% rent growth), your $7k cash investment doubles in ~1 year — after that, you're playing with house money.
Negotiation context
- Only 1 days on market — expect competitive offers; lowballing is unlikely to land.
Questions for the listing agent
- Have any recent inspections been done? Can we get a copy of the seller's disclosures and any deferred-maintenance estimates?
- Is there a deadline driving the sale (1031 exchange, divorce, estate, relocation)? That informs how much negotiation room exists.
- Schools are F-rated, which usually means shorter tenancies and higher turnover. Who's the typical renter profile here, and what's been the actual vacancy rate?
- The area grade is low — what's the realistic commute time and amenity access for the typical tenant pool here? Any planned neighborhood developments (good or bad) we should know about?
- What's the average days-on-market for RENTAL listings here right now (not sales)? A rising rental-DOM trend means longer vacancies and softer asking-rent achievability than the comps imply.
- What's the recent tenant-quality profile in this submarket — average credit score on applications, eviction rate, late-payment / NSF rate, and stable-employment percentage? A property-management company in the area should have these aggregated.
- How much new for-sale + rental construction is in the pipeline within 1–3 miles? Heavy new supply typically softens prices + rents 12–24 months out; constrained supply supports both.
Investment metrics
- 1% rule
- 4.72% ✓
- Cap rate
- 42.70%
- Cash-on-cash
- 130.04%
- DSCR
- 6.79
- GRM
- 1.8
CMA / ARV
No comps found within radius.
Projected returns pro-forma
-2.68% appreciation · 3.0% rent growth · sell at horizon
- IRR
- —
- Equity multiple
- 7.37×
- Total profit
- $44,618
- Equity at exit
- $4,086
- IRR
- —
- Equity multiple
- 15.49×
- Total profit
- $101,427
- Equity at exit
- $2,783
Cash invested: $7,000 (down + closing). Projections, not guarantees.
Landlord ↔ Tenant lean methodology
- Overall (STATE)
- 83 Strongly Landlord-Friendly
- State Kentucky
- 83 Strongly Landlord-Friendly · R+16
- County
- — inherits STATE
- City
- — inherits STATE
ZIP-level market 41630
- Home prices YoY
- -3.0%
- Active inventory
- 10
- Price-to-rent
- 1.8×
Monthly cashflow live
- Estimated rent
- $1,179 medium interval (Pro) →
- Mortgage (P&I)
- −$131
- Tax est. 1.5%
- −$31 /mo · $375/yr
- Insurance
- −$10
- HOA
- −$0
- Vacancy / Maint / Mgmt
- −$248
- Net cashflow
- $759
Break-even live
UW: 25.0% down · 7.5% · 30yr · 1.5% tax · 5.0% vac · 8.0% maint · 8.0% mgmt
Financing live
Cash to close
- Down payment
- $6,250
- Closing costs
- $750
- Reserves months
- —
- Total cash needed
- —
Loan-product check · same deal, 3 products live
Conventional
25% down · 7.5% · 30yr
- Down + closing
- —
- Monthly P&I
- —
- Monthly cashflow
- —
- DSCR
- —
- Eligible?
- —
Personal DTI + credit; lowest rate.
DSCR
20% down · 8.5% · 30yr
- Down + closing
- —
- Monthly P&I
- —
- Monthly cashflow
- —
- DSCR
- —
- Eligible?
- —
No personal income docs; deal must DSCR.
Hard money
10% down · 12.0% · 12mo
- Down + closing
- —
- Monthly P&I
- —
- Monthly cashflow
- —
- DSCR
- —
- Eligible?
- —
Short-term bridge; refi at stabilization.
Listing history 1 events
-
2026-05-26$25,000 Active
ⓘ Source: listings_history table (triggers on properties + properties_extension) + one-shot
backfill from property_details.listing_events for pre-trigger history.
Nearby sold comps map
Loading sold comps map…
Walkable amenities ~0.75 mi
Loading nearby amenities…
Taxation est. · year 1
- Rental income
- $14,147
- − Mortgage interest
- −$1,400
- − Property taxes
- −$375
- − Insurance
- −$125
- − Repairs & maintenance
- −$1,132
- − Management
- −$1,132
- − Depreciation
- −$727
- Taxable income
- $9,256
- Est. tax owed @ 24.0%
- −$2,221
- After-tax cash flow
- $6,881/yr
For passive investors: Depreciation is non-cash, so a rental often shows a tax loss while cash-flowing — sheltering income. Rental losses are passive: they offset passive income freely, and up to $25,000/yr can offset ordinary (W-2) income if you actively participate and your MAGI is under $100k (phasing out to $0 by $150k); unused losses carry forward. On sale, claimed depreciation is recaptured at up to 25%, and gains may owe capital-gains tax (a 1031 exchange can defer both). Figures are a year-1 estimate at your 24.0% rate — not tax advice; consult a CPA.
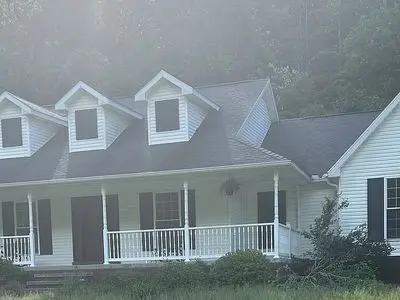
Condition & rehab AI · 1 photo
This home requires significant exterior repairs and maintenance, including painting and replacing siding and roof. These updates will significantly improve its curb appeal and value.
Repairs flagged
- Major siding — Significant wear and tear
- Major roof — Shingles appear worn
Value-add opportunities
- Both paint exterior and interior — Fresh paint enhances curb appeal and interior aesthetics
- Both repair and replace siding — New siding improves home's appearance and value
- Both replace roof — A new roof ensures long-term durability and protects the home
Renovation cost estimate screening
| Repair item | Severity | Est. cost |
|---|---|---|
| siding · Significant wear and tear | Major | $15,000–50,000 |
| roof · Shingles appear worn | Major | $15,000–50,000 |
| Total estimated repair cost · 2 items | $30,000–100,000 |
Value-add ROI direction
- Both paint exterior and interior — Fresh paint enhances curb appeal and interior aesthetics ↑
- Both repair and replace siding — New siding improves home's appearance and value ↑
- Both replace roof — A new roof ensures long-term durability and protects the home ↑
ⓘ Cost ranges are severity-bucket heuristics (US national rule-of-thumb). Get contractor quotes + a written scope before underwriting a rehab budget.
Schools (NCES district)
- District
- Knott County
- NCES district ID
- 2103120
- Math proficiency
- 23% ▼ -15.00%
- Reading proficiency
- 39% ▼ -16.00%
- Median HH income
- $30,599
- Composite
- 25.12/100
- National rank
- #7525
- State rank
- #109 of 165 in KY
Livability — Wayland
- Score
- 54/100
- State rank
- #475
- US rank
- #23803
Category grades
Schools grade is shown separately in the Schools card above.
Census & demographics
- Population (ZIP)
- 938
Population outlook (Knott County) Hauer SSP2
- Today (2025)
- 14,310 people
- By 2030
- 13,485 · -5.8%
- By 2040
- 11,794 · -17.6%
- By 2050
- 10,334 · -27.8%
- By 2075
- 8,098 · -43.4%
- By 2100
- 6,847 · -52.2%
Race, ethnicity, and origin ACS 2023
- Neighborhood character
- Predominantly White (97%)
- Race & ethnicity
- White 97% Two or more races 2%
- Common ancestry
- Hungarian 3%
Political lean MEDSL · Knott
- 2024 margin
- Solid R (+59.2) · D 19.7% · R 78.8% · Other 1.5%
- 2008→2024 swing
- -51.3pp toward R · 2008: -7.9pp · 2024: -59.2pp
- All cycles
- 2024: R+59.2 2020: R+53.9 2016: R+54.1 2012: R+47.6 2008: R+7.9
Not yet ingested
- Civics
- —
Market trends
- HPI YoY
- ▼ -2.68%
- Current HPI
- 85.5784
- Rent YoY
- —
- Metro
- —
- State GDP YoY
- ▲ 1.81%
- F500 in state
- 4
Industry mix (Fortune 500 HQ in KY)
| Industry | F500 HQs | Revenue |
|---|---|---|
| Healthcare | 1 | $118B |
|
||
| Food / Beverage | 1 | $7B |
|
||
Price history
1 event — show timeline
- 2026-05-26 Listed $25,000 FSBO.com
Cash-flow waterfall
monthlySold comps — $/sqft
last 12 mo · ≤1 miLoading sold comps…