675 Oakwood Ave · Columbus, OH
Flood risk 1/10 · Minimal
- FEMA flood zone
- X (unshaded)
- Chance of flooding over 30 yrs
- 0.0%
- Est. flood insurance / yr
- $473 – $860
Fire risk 1/10 · Minimal
- Est. fire insurance / yr
- $713 – $1,323
Heat risk 3/10 · Minor
- Hot days now (above 100°F)
- 7 days/yr
- Hot days in 30 yrs
- 17 days/yr
Wind risk 2/10 · Minimal
- Chance of severe wind over 30 yrs
- 1.0%
Air-quality risk 3/10 · Minor
- Unhealthy air days now
- 2 days/yr
- Unhealthy air days in 30 yrs
- 4 days/yr
Risk factors via First Street. Map © Google.
Why this score? — see what drove the C+ grade
The composite is a weighted blend of 9 inputs, each scored 0–100. Each bar is that input's sub-score; the figure is the points it added to the 100-point composite (weight × sub-score).
- Cash flow +23.8/30.0
- ARV discount +15.0/15.0
- DSCR +7.7/10.0
- 1% rule +6.0/10.0
- Livability +4.0/5.0
- Rent growth +2.9/5.0
- Condition / age +2.5/5.0
- Schools +1.7/10.0
- Appreciation +0.0/10.0
$159,800
🖨 Deal sheet 📄 Offer letter ✓ Due diligence
Listing remarks
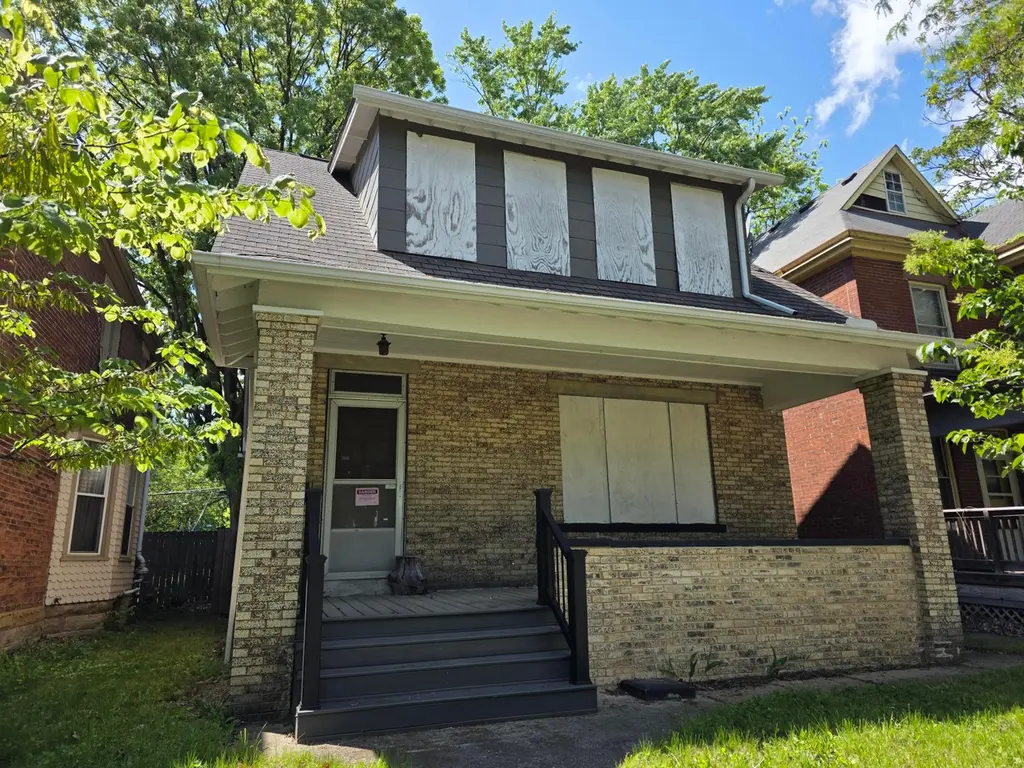
Investor Special in a Rapidly Revitalizing Columbus Neighborhood! Located at 675 Oakwood Ave, this fully gutted historic property presents an exceptional opportunity for investors, flippers, and rehabbers ready to bring new life to a home with incredible potential. With the interior already cleared out, much of the major demo work has been completed, allowing you to jump straight into the renovation process and customize the space to fit your vision. The property also includes a detached garage, offering added storage, workshop potential, or valuable off-street parking -- an attractive feature for future homeowners or tenants. Recognized as a historic property, this home offers timeless
Key facts
- Detached garage
- 4,356 sq ft lot
- 2 garage spots
Tags
Property features AI
Exterior
- Parking: Detached 2-car garage
- Utilities: Public water; Public sewer
- Home design: Single family residence; Two levels; Built in 1914; No common walls
- Construction: Block and stone foundation
- Exterior features: Fenced yard
Interior
- Bathrooms: 1 full bathroom
- Interior features: Insulated partial windows; One fireplace; Basement
Neighborhood map
What this means for you Summary
Snapshot
- This is a 3-bed/1.0-bath single-family listed at $160k.
Deal economics
- At list price, monthly cash flow is $308 ($4k/yr) — positive.
- The deal already cash-flows at list — no discount required.
- Meets the 1% rule at list price ($2k rent vs $160k).
- Cap rate 8.6% vs local median 3.8% in Columbus — top-decile yield for the area; either an underpriced asset or a hidden risk that comps aren't pricing in. Stress-test before assuming the spread holds.
Location & tenants
- Location reads 81/100 on livability (#97 in OH, #1,491 nationally) — a professional / high-income tenant draw. Strengths: commute A+, cost of living A+, housing A+; Watch: employment C-, crime F.
- Columbus City School District (urban): math 15% / reading 26% proficiency, ranked #626 of 656 in OH (top 95%) — low school quality limits family demand, transient renter base, plan for 1-2y turnover; 72% free/reduced lunch — lower-income household profile, screen leases tightly.
- Market conditions: Rents rising (+1.4%/yr); 142 active listings in the ZIP; 40 comparable units currently listed for rent nearby; rentals at typical pace (median 24d on market — plan ~3-4 weeks tenant-placement turnaround); 8,139 units permitted in Franklin County in 2024 (5,940 in 5+ unit buildings).
- This rent runs 35% of the median local income ($60k/yr) — at the standard rent-burdened threshold; future hikes will face affordability resistance.
Forward outlook
- Local home prices are declining (-3.0%/yr); year-one equity from $1k of loan paydown is wiped out by about $5k of value loss. Plan a longer hold.
- Franklin County population projected at +34% by 2050 — long-run rental-demand tailwind backs the buy-and-hold thesis.
Negotiation context
- Only 2 days on market — expect competitive offers; lowballing is unlikely to land.
Risks & watch-outs
- Watch-outs: built in 1914 — expect roof / HVAC / electrical / plumbing capex.
Questions for the listing agent
- Built in 1914 — when were the roof, HVAC, electrical panel, plumbing, and water heater last replaced?
- Is there a deadline driving the sale (1031 exchange, divorce, estate, relocation)? That informs how much negotiation room exists.
- Crime grade is F in this area — have there been break-ins, vandalism, or insurance claims at this property in the last 3 years? What carrier currently insures it and at what premium?
- What's the average days-on-market for RENTAL listings here right now (not sales)? A rising rental-DOM trend means longer vacancies and softer asking-rent achievability than the comps imply.
- What's the recent tenant-quality profile in this submarket — average credit score on applications, eviction rate, late-payment / NSF rate, and stable-employment percentage? A property-management company in the area should have these aggregated.
- How much new for-sale + rental construction is in the pipeline within 1–3 miles? Heavy new supply typically softens prices + rents 12–24 months out; constrained supply supports both.
Investment metrics
- 1% rule
- 1.10% ✓
- Cap rate
- 8.60%
- Cash-on-cash
- 8.25%
- DSCR
- 1.37
- GRM
- 7.6
CMA / ARV
- ARV (on-the-fly)
- $309,890
- Comps found
- 12
Show comp detail 12 sales within ~0.75 mi
| Address | Dist | Beds/Ba | Sqft | Sold | Price | $/sf | Match |
|---|---|---|---|---|---|---|---|
| 675 Oakwood Ave | 0.00mi | 3/1.0 | 1,631 (0%) | 1mo | $153,000 | $94 | 100 |
| 831 Wilson Ave | 0.23mi | 3/2.5 | 1,586 (-3%) | 2mo | $292,500 | $184 | 77 |
| 795 S Ohio Ave | 0.26mi | 3/2.5 | 1,535 (-6%) | 2mo | $340,000 | $221 | 71 |
| 758 S 18th St | 0.50mi | 3/2.5 | 1,646 (+1%) | 1mo | $350,000 | $213 | 68 |
| 1046 E Cherry St | 0.49mi | 3/2.5 | 1,582 (-3%) | 0mo | $302,500 | $191 | 66 |
| 1005 Studer Ave | 0.49mi | 3/2.5 | 1,544 (-5%) | 2mo | $272,900 | $177 | 61 |
| 935 S Ohio Ave | 0.43mi | 4/2.5 (+1) | 1,735 (+6%) | 1mo | $330,000 | $190 | 57 |
| 362 Loeffler Ave | 0.63mi | 3/2.5 | 1,568 (-4%) | 2mo | $420,000 | $268 | 56 |
| 827 S 22nd St | 0.35mi | 4/3.0 (+1) | 1,777 (+9%) | 1mo | $300,000 | $169 | 55 |
| 461 S 22nd St | 0.33mi | 3/2.5 | 1,403 (-14%) | 2mo | $199,000 | $142 | 54 |
| 1129 Oakwood Ave | 0.66mi | 3/2.5 | 1,540 (-6%) | 2mo | $327,500 | $213 | 52 |
| 987 E Whittier St | 0.59mi | 2/2.0 (-1) | 1,798 (+10%) | 0mo | $235,000 | $131 | 46 |
Match score weights: distance 35% · size 25% · config 20% · recency 20%. Top-matched comps best support the ARV.
Projected returns pro-forma
-3.0% appreciation · 1.43% rent growth · sell at horizon
- IRR
- -5.5%
- Equity multiple
- 0.80×
- Total profit
- $-9,027
- Equity at exit
- $23,827
- IRR
- 2.2%
- Equity multiple
- 1.15×
- Total profit
- $6,530
- Equity at exit
- $13,817
Cash invested: $44,744 (down + closing). Projections, not guarantees.
Landlord ↔ Tenant lean methodology
- Overall (STATE)
- 73 Landlord-Friendly
- State Ohio
- 73 Landlord-Friendly · R+6
- County
- — inherits STATE
- City
- — inherits STATE
ZIP-level market 43205
- Rents YoY
- 1.4%
- Active inventory
- 142
- Price-to-rent
- 7.6×
Monthly cashflow live
- Estimated rent
- $1,762 high interval (Pro) →
- Mortgage (P&I)
- −$838
- Tax from tax record
- −$180 /mo · $2,160/yr
- Insurance
- −$67
- HOA
- −$0
- Vacancy / Maint / Mgmt
- −$370
- Net cashflow
- $308
Break-even live
UW: 25.0% down · 7.5% · 30yr · 1.5% tax · 5.0% vac · 8.0% maint · 8.0% mgmt
Financing live
Cash to close
- Down payment
- $39,950
- Closing costs
- $4,794
- Reserves months
- —
- Total cash needed
- —
Loan-product check · same deal, 3 products live
Conventional
25% down · 7.5% · 30yr
- Down + closing
- —
- Monthly P&I
- —
- Monthly cashflow
- —
- DSCR
- —
- Eligible?
- —
Personal DTI + credit; lowest rate.
DSCR
20% down · 8.5% · 30yr
- Down + closing
- —
- Monthly P&I
- —
- Monthly cashflow
- —
- DSCR
- —
- Eligible?
- —
No personal income docs; deal must DSCR.
Hard money
10% down · 12.0% · 12mo
- Down + closing
- —
- Monthly P&I
- —
- Monthly cashflow
- —
- DSCR
- —
- Eligible?
- —
Short-term bridge; refi at stabilization.
Rent comps 40 comps
| Address | Beds | Baths | Sqft | Rent | $/sqft | DOM | Units | Dist |
|---|---|---|---|---|---|---|---|---|
| 627 Oakwood Ave Columbus, OH | 3.0 | 2.5 | 2009 | $2,379 | $1.18 | 12d | 1 | 0.05mi |
| 685 S Champion Ave Unit 683 Columbus, OH | 3.0 | 1.0 | 1364 | $1,575 | $1.15 | 21d | 1 | 0.08mi |
| 730-732 Oakwood Ave Unit 732 Columbus, OH | 3.0 | 1.0 | 1232 | $1,425 | $1.16 | 43d | 1 | 0.10mi |
| 813 Wilson Ave Unit 1 Columbus, OH | 3.0 | 1.5 | 1400 | $1,500 | $1.07 | 7d | 1 | 0.22mi |
| 815 Wilson Ave Columbus, OH | 3.0 | 1.5 | 1400 | $1,500 | $1.07 | 7d | 1 | 0.22mi |
| 1272 Kent St Unit 2 Columbus, OH | 2.0 | 1.0 | 1152 | $1,295 | $1.12 | 21d | 1 | 0.25mi |
| 1272 Kent St Columbus, OH | 2.0 | 1.0 | 1152 | $1,250 | $1.09 | 1d | 1 | 0.25mi |
| 814 S Ohio Ave Columbus, OH | 3.0 | 1.0 | 1380 | $1,600 | $1.16 | 43d | 1 | 0.27mi |
| 857 Wilson Ave #859 Columbus, OH | 3.0 | 2.5 | 1527 | $1,650 | $1.08 | 43d | 1 | 0.28mi |
| 461 Oakwood Ave Columbus, OH | 3.0 | 1.5 | 1386 | $1,845 | $1.33 | 43d | 1 | 0.29mi |
| 648 Carpenter St Unit Nch Columbus, OH | 3.0 | 1.5 | 1392 | $1,475 | $1.06 | 23d | 1 | 0.31mi |
| 648 Carpenter St Unit Nch Columbus, OH | 3.0 | 1.5 | 1392 | $1,475 | $1.06 | 2d | 1 | 0.31mi |
| 555 Kimball Pl Columbus, OH | 3.0 | 2.5 | 1252 | $1,785 | $1.43 | 43d | 1 | 0.34mi |
| 883 Studer Ave Columbus, OH | 4.0 | 2.5 | 2217 | $2,500 | $1.13 | 1d | 1 | 0.36mi |
| 904 Studer Ave Columbus, OH | 3.0 | 1.5 | 1364 | $1,780 | $1.30 | 23d | 1 | 0.40mi |
| 932 Linwood Ave Columbus, OH | 4.0 | 1.5 | 1663 | $2,045 | $1.23 | 43d | 1 | 0.40mi |
| 988 Linwood Ave Columbus, OH | 4.0 | 3.0 | 1800 | $2,750 | $1.53 | 17d | 1 | 0.47mi |
| 997 Oakwood Ave Columbus, OH | 3.0 | 1.5 | 1260 | $1,800 | $1.43 | 12d | 1 | 0.49mi |
| 936 Wagner St Columbus, OH | 3.0 | 3.0 | 1560 | $2,750 | $1.76 | 23d | 1 | 0.51mi |
| 977 S Ohio Ave Columbus, OH | 3.0 | 2.5 | 1650 | $2,500 | $1.52 | 43d | 1 | 0.51mi |
| 908 Ellsworth Ave Columbus, OH | 3.0 | 1.0 | 1154 | $1,325 | $1.15 | 3d | 1 | 0.53mi |
| 963 S 22nd St Columbus, OH | 3.0 | 2.0 | 1188 | $3,200 | $2.69 | 7d | 1 | 0.53mi |
| 282-284 S Ohio Ave Columbus, OH | 3.0 | 2.0 | 1477 | $1,699 | $1.15 | 23d | 1 | 0.53mi |
| 965 E Rich St Unit 965 Columbus, OH | 3.0 | 1.0 | 2184 | $1,600 | $0.73 | 23d | 1 | 0.55mi |
| 1056 Wilson Ave Unit A Columbus, OH | 2.0 | 1.0 | 1100 | $1,225 | $1.11 | 43d | 1 | 0.56mi |
| 1056 Wilson Ave Unit B Columbus, OH | 2.0 | 1.0 | 1100 | $1,195 | $1.09 | 17d | 1 | 0.56mi |
| 877 Heyl Ave Columbus, OH | 2.0 | 1.0 | 1200 | $1,750 | $1.46 | 43d | 1 | 0.56mi |
| 1445 E Main St Unit A Columbus, OH | 2.0 | 1.0 | 1250 | $1,050 | $0.84 | 10d | 1 | 0.59mi |
| 663-665 Ann St Columbus, OH | 3.0 | 1.0 | 1260 | $1,299 | $1.03 | 17d | 1 | 0.61mi |
| 1275-1279 E Kossuth St Columbus, OH | 2.0 | 2.0 | 1160 | $1,350 | $1.16 | 43d | 1 | 0.61mi |
| 880 E Whittier St Columbus, OH | 2.0 | 1.5 | 1064 | $1,100 | $1.03 | 43d | 1 | 0.61mi |
| 361 Loeffler Ave Columbus, OH | 2.0 | 2.5 | 1399 | $2,100 | $1.50 | 17d | 1 | 0.61mi |
| 597 Lilley Ave Columbus, OH | 2.0 | 1.5 | 1300 | $1,550 | $1.19 | 43d | 1 | 0.61mi |
| 850 E Whittier St Columbus, OH | 3.0 | 2.0 | 1200 | $1,949 | $1.62 | 23d | 1 | 0.62mi |
| 522 Kelton Ave Columbus, OH | 2.0 | 2.0 | 1108 | $1,995 | $1.80 | 43d | 1 | 0.62mi |
| 741-743 E Mound St Columbus, OH | 3.0 | 1.5 | 1528 | $1,645 | $1.08 | 7d | 1 | 0.63mi |
| 741-743 E Mound St Columbus, OH | 3.0 | 1.5 | 1528 | $1,645 | $1.08 | 43d | 1 | 0.63mi |
| 614-616 Lilley Ave Columbus, OH | 3.0 | 1.5 | 1232 | $1,700 | $1.38 | 43d | 1 | 0.63mi |
| 773-775 Berkeley Rd Columbus, OH | 3.0 | 1.0 | 1280 | $1,400 | $1.09 | 21d | 1 | 0.63mi |
| 773-775 Berkeley Rd Columbus, OH | 3.0 | 1.0 | 1280 | $1,350 | $1.05 | 2d | 1 | 0.63mi |
Listing history 2 events
-
2026-05-21status Pending
-
2026-05-18$159,800 Active
ⓘ Source: listings_history table (triggers on properties + properties_extension) + one-shot
backfill from property_details.listing_events for pre-trigger history.
Tax reassessment forecast OH · Partial reset (capped growth)
- Current annual tax
- $2,160 · $180/mo
- Projected year-2 tax
- $2,326 · $194/mo
- Expected delta
- +$166/yr (+$14/mo · 7.7%)
ⓘ Screening estimate from a state-policy table — verify with the county assessor before closing.
Climate risk First Street
- Flood 1/10 Low FEMA zone X (unshaded) · 0% chance over 30 yrs
- Wildfire 1/10 Low
- Heat 3/10 Moderate 7 d/yr ≥100°F today · 17 d/yr by 30 yrs out
- Wind 2/10 Low 100% chance of damaging wind over 30 yrs
- Air quality 3/10 Moderate 2 unhealthy d/yr today · 4 by 30 yrs out
Nearby sold comps map
Loading sold comps map…
Walkable amenities ~0.75 mi
Loading nearby amenities…
Taxation est. · year 1
- Rental income
- $21,148
- − Mortgage interest
- −$8,951
- − Property taxes
- −$2,160
- − Insurance
- −$799
- − Repairs & maintenance
- −$1,692
- − Management
- −$1,692
- − Depreciation
- −$4,649
- Taxable income
- $1,205
- Est. tax owed @ 24.0%
- −$289
- After-tax cash flow
- $3,402/yr
For passive investors: Depreciation is non-cash, so a rental often shows a tax loss while cash-flowing — sheltering income. Rental losses are passive: they offset passive income freely, and up to $25,000/yr can offset ordinary (W-2) income if you actively participate and your MAGI is under $100k (phasing out to $0 by $150k); unused losses carry forward. On sale, claimed depreciation is recaptured at up to 25%, and gains may owe capital-gains tax (a 1031 exchange can defer both). Figures are a year-1 estimate at your 24.0% rate — not tax advice; consult a CPA.
Schools (NCES district)
- District
- Columbus City School District
- NCES district ID
- 3904380
- Math proficiency
- 15% ▼ -17.00%
- Reading proficiency
- 26% ▼ -12.00%
- Median HH income
- $38,483
- Composite
- 17.19/100
- National rank
- #9105
- State rank
- #626 of 656 in OH
Livability — Columbus
- Score
- 81/100
- State rank
- #97
- US rank
- #1491
Category grades
Schools grade is shown separately in the Schools card above.
Census & demographics
- Census place
- Columbus, OH
- County
- Franklin County · 1,351,780 people
- City population
- 612,189
- Metro
- Columbus, OH
- Population (ZIP)
- 12,618
- Household income
- $60,181
- Rent vs Own
- Severe rent burden
- 823.0
Population outlook (Franklin County) Hauer SSP2
- Today (2025)
- 1,456,139 people
- By 2030
- 1,556,890 · +6.9%
- By 2040
- 1,757,349 · +20.7%
- By 2050
- 1,950,539 · +34.0%
- By 2075
- 2,376,171 · +63.2%
- By 2100
- 2,636,796 · +81.1%
Race, ethnicity, and origin ACS 2023
- Neighborhood character
- Diverse neighborhood (Simpson 0.60)
- Race & ethnicity
- Black 47% White 42% Two or more races 7% Hispanic / Latino 3% Asian 1%
- Common ancestry
- Lithuanian 2% Slovak 2% Romanian 2%
- Foreign-born
- 3% · Canada
- Languages at home
- 95% English-only · Spanish 1% Other Asian/Pacific 1% Other Indo-European 1%
Political lean MEDSL · Franklin
- 2024 margin
- Strong D (+28.4) · D 63.7% · R 35.3% · Other 1.0%
- 2008→2024 swing
- +7.7pp toward D · 2008: 20.7pp · 2024: 28.4pp
- All cycles
- 2024: D+28.4 2020: D+31.4 2016: D+25.9 2012: D+21.7 2008: D+20.7
Not yet ingested
- Civics
- —
Market trends
- HPI YoY
- ▼ -282.36%
- Current HPI
- 212.5692
- Rent YoY
- ▲ 1.43%
- Metro
- Columbus, OH
- State GDP YoY
- ▲ 1.98%
- F500 in state
- 48
Industry mix (Fortune 500 HQ in OH)
| Industry | F500 HQs | Revenue |
|---|---|---|
| Insurance | 3 | $145B |
|
||
| Industrial Machinery | 3 | $49B |
|
||
| Financial Services | 3 | $24B |
|
||
| Consumer Goods | 2 | $93B |
|
||
| Aerospace / Defense | 2 | $47B |
|
||
| Utilities | 2 | $33B |
|
||
Price history
2 events — show timeline
- 2026-05-21 Pending — CBRMLS
- 2026-05-18 Listed $159,800 CBRMLS
Property tax history
+9.3%/yrLatest (2024): $2,160 · -26.2% YoY. Source: county tax records.
Cash-flow waterfall
monthlySold comps — $/sqft
last 12 mo · ≤1 miLoading sold comps…