 🏷️ Likely Rental
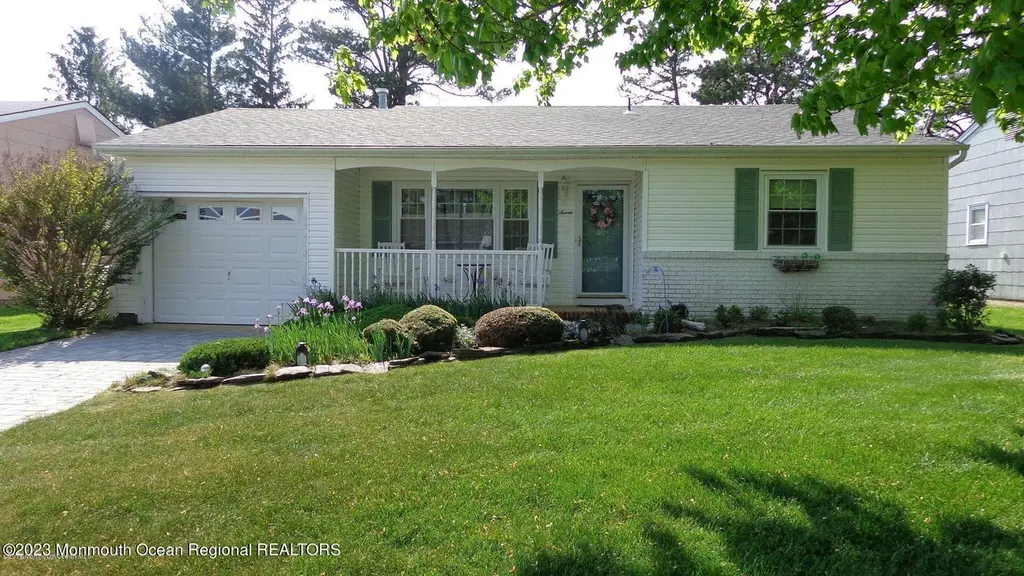
7 Basset Dr · Holiday City-Berkeley, NJ
Flood risk 1/10 · Minimal
- FEMA flood zone
- X (unshaded)
- Chance of flooding over 30 yrs
- 0.0%
- Est. flood insurance / yr
- $507 – $1,088
Fire risk 7/10 · Major
- Est. fire insurance / yr
- $526 – $976
Heat risk 7/10 · Major
- Hot days now (above 103°F)
- 7 days/yr
- Hot days in 30 yrs
- 16 days/yr
Wind risk 6/10 · Moderate
- Chance of severe wind over 30 yrs
- 65.0%
Air-quality risk 3/10 · Minor
- Unhealthy air days now
- 3 days/yr
- Unhealthy air days in 30 yrs
- 4 days/yr
Risk factors via First Street. Map © Google.
Why this score? — see what drove the D grade
The composite is a weighted blend of 9 inputs, each scored 0–100. Each bar is that input's sub-score; the figure is the points it added to the 100-point composite (weight × sub-score).
- Cash flow +15.0/30.0
- ARV discount +7.5/15.0
- 1% rule +5.0/10.0
- DSCR +5.0/10.0
- Schools +2.6/10.0
- Rent growth +2.5/5.0
- Livability +2.5/5.0
- Condition / age +2.5/5.0
- Appreciation +0.0/10.0
$2,500
🖨 Deal sheet (PDF) 📄 Offer letter ✓ Due diligence
Listing remarks
Annual Rental in Silver Ridge Pk. -This beautiful Sussex Model features a Living Room Dining Room-A bright Spacious Den-Eat-in Kitchen with breakfast Bar and Granite Counters-Gas cooking-Two Great size bedrooms- One full bath with walk-in Tub and Stall Shower plus a half Bath-All hardwood floors-Trex Deck with private Back Yard and Patio-Also attached Garage Come and see
Key facts
- Gas cooking
- Walk-in tub
- Stall shower
Tags
Property features AI
Finance
- HOA & community: HOA membership required; Annual association fee; Association amenities include clubhouse, community room, common area; no pool; Association fee covers trash, common area maintenance, and snow removal
Exterior
- Parking: Attached 1-car garage
- Utilities: Public sewer
- Home design: Model: Sussex
- Construction: Crawl space foundation
- Exterior features: Shingle roof
Interior
- Kitchen: Stove; Microwave; Refrigerator; Dishwasher
- Bedrooms: 2 bedrooms (both on the first floor)
- Flooring: Ceramic tile; Wood
- Bathrooms: 1 full bathroom; 1 half bathroom
- Heating & cooling: Baseboard heating; Central air conditioning
- Interior features: Ceiling fan(s); Outdoor lighting; Window treatments; Light fixtures; Screens; Garage door opener; Gas cooking
- Laundry & utility: Washer; Dryer
Neighborhood map
What this means for you Summary
Snapshot
- This is a 2-bed/1.0-bath single-family listed at $2k.
Deal economics
- At list price, monthly cash flow is $2k ($23k/yr) — positive.
- The deal already cash-flows at list — no discount required.
- Meets the 1% rule at list price ($3k rent vs $2k).
- Cap rate 937.8% vs local median 5.2% in Holiday City-Berkeley — top-decile yield for the area; either an underpriced asset or a hidden risk that comps aren't pricing in. Stress-test before assuming the spread holds.
Location & tenants
- Location reads: area grade D — affects rentability + tenant quality, not the cash-flow math above.
- Central Regional School District (suburban): math 17% / reading 43% proficiency, ranked #357 of 472 in NJ (top 76%) — families likely to look elsewhere, expect single-tenant / working-renter base with shorter leases.
- Zoned schools: Central Regional Middle School (math 19% / reading 46%, grade F, #279 of 431 statewide, top 66%, 716 students, 37% FRL); Central Regional High School (math 15% / reading 39%, grade F, #312 of 399 statewide, top 79%, 1,606 students, 36% FRL).
- Market conditions: 509 active listings in the ZIP; 4 comparable units currently listed for rent nearby; rentals leasing fast (median 0d on market — plan ~1-2 weeks tenant-placement turnaround); 4,434 units permitted in Ocean County in 2024 (868 in 5+ unit buildings).
- At $2,508/mo this rent would consume 52% of the median local household income ($58k/yr) (locally 1010% of renters already pay >50% of income on rent) — very limited rent-growth headroom before tenants either downsize or default.
Forward outlook
- Local home prices are declining (-3.0%/yr); year-one equity from $17 of loan paydown is wiped out by about $75 of value loss. Plan a longer hold.
- Ocean County population projected to shrink 8% by 2050 — rents likely to lag national; underwrite the cash flow, not the appreciation.
- At projected returns (-3.0% appreciation + 3.0% rent growth), your $700 cash investment doubles in ~1 year — after that, you're playing with house money.
Negotiation context
- Only 2 days on market — expect competitive offers; lowballing is unlikely to land.
- 11 sale attempts since 27y ago with the ask held roughly flat each time — persistent listings suggest the price (not the market) is what's stuck; bring a comps-based counter.
Risks & watch-outs
- Climate carrying-cost: major wind risk, 65% chance of damaging wind over 30y; major wildfire risk; extreme-heat days projected 7→16/yr by 2055 (HVAC capex compounding) — expect insurance premiums to compound above CPI over the hold.
Questions for the listing agent
- What does the HOA fee cover, when was the last increase, and are there any pending special assessments or reserve-fund shortfalls?
- Is there a deadline driving the sale (1031 exchange, divorce, estate, relocation)? That informs how much negotiation room exists.
- The area grade is low — what's the realistic commute time and amenity access for the typical tenant pool here? Any planned neighborhood developments (good or bad) we should know about?
- What's the average days-on-market for RENTAL listings here right now (not sales)? A rising rental-DOM trend means longer vacancies and softer asking-rent achievability than the comps imply.
- What's the recent tenant-quality profile in this submarket — average credit score on applications, eviction rate, late-payment / NSF rate, and stable-employment percentage? A property-management company in the area should have these aggregated.
- How much new for-sale + rental construction is in the pipeline within 1–3 miles? Heavy new supply typically softens prices + rents 12–24 months out; constrained supply supports both.
Investment metrics
- 1% rule
- 100.30% ✓
- Cap rate
- 937.81%
- Cash-on-cash
- 3326.85%
- DSCR
- 149.03
- GRM
- 0.1
CMA / ARV
- ARV (on-the-fly)
- $316,602
- Comps found
- 12
Show comp detail 12 sales within ~0.75 mi
| Address | Dist | Beds/Ba | Sqft | Sold | Price | $/sf | Match |
|---|---|---|---|---|---|---|---|
| 27 Whitaker Dr | 0.16mi | 2/2.0 | 1,153 (+4%) | 1mo | $390,000 | $338 | 81 |
| 1 Miles Pond Rd | 0.46mi | 2/1.0 | 1,105 (-0%) | 2mo | $164,000 | $148 | 76 |
| 89 Carlisle Rd | 0.38mi | 2/1.5 | 1,121 (+1%) | 3mo | $350,000 | $312 | 76 |
| 1 Hampshire Rd | 0.54mi | 2/1.0 | 1,121 (+1%) | 2mo | $315,000 | $281 | 72 |
| 135 Northumberland Dr | 0.50mi | 2/1.0 | 1,139 (+3%) | 2mo | $335,000 | $294 | 70 |
| 37 Zeeland Dr | 0.54mi | 2/1.0 | 1,153 (+4%) | 1mo | $292,000 | $253 | 67 |
| 12 Norfolk Dr | 0.48mi | 2/1.5 | 1,157 (+4%) | 2mo | $335,000 | $290 | 66 |
| 30 Zeeland Dr | 0.53mi | 2/1.0 | 1,153 (+4%) | 3mo | $330,000 | $286 | 66 |
| 3 Caldwell Dr | 0.25mi | 2/1.0 | 971 (-12%) | 3mo | $279,000 | $287 | 65 |
| 37 Carlisle Rd | 0.68mi | 2/1.5 | 1,121 (+1%) | 1mo | $310,000 | $277 | 64 |
| 162 Castleton Dr | 0.67mi | 2/1.0 | 1,153 (+4%) | 3mo | $263,900 | $229 | 59 |
| 13 Shaw Ct | 0.42mi | 2/2.0 | 1,229 (+11%) | 4mo | $299,000 | $243 | 55 |
Match score weights: distance 35% · size 25% · config 20% · recency 20%. Top-matched comps best support the ARV.
Projected returns pro-forma
-3.0% appreciation · 3.0% rent growth · sell at horizon
- IRR
- —
- Equity multiple
- 177.07×
- Total profit
- $123,249
- Equity at exit
- $373
- IRR
- —
- Equity multiple
- 381.99×
- Total profit
- $266,691
- Equity at exit
- $216
Cash invested: $700 (down + closing). Projections, not guarantees.
Landlord ↔ Tenant lean methodology
- Overall (STATE)
- 21 Tenant-Leaning
- State New Jersey
- 21 Tenant-Leaning · D+6
- County
- — inherits STATE
- City
- — inherits STATE
ZIP-level market 08757
- Active inventory
- 509
- Price-to-rent
- 0.1×
Monthly cashflow live
- Estimated rent
- $2,508 medium interval (Pro) →
- Mortgage (P&I)
- −$13
- Tax est. 1.5%
- −$3 /mo · $38/yr
- Insurance
- −$1
- HOA
- −$23
- Vacancy / Maint / Mgmt
- −$527
- Net cashflow
- $1,941
Break-even live
Sensitivity live
| Price | -10% $1,942 | -5% $1,942 | +0% $1,941 | +5% $1,940 | +10% $1,939 |
|---|---|---|---|---|---|
| Rent | -10% $1,743 | -5% $1,842 | +0% $1,941 | +5% $2,040 | +10% $2,139 |
| Rate | -1.0pp $1,942 | -0.5pp $1,941 | base $1,941 | +0.5pp $1,940 | +1.0pp $1,939 |
UW: 25.0% down · 7.5% · 30yr · 1.5% tax · 5.0% vac · 8.0% maint · 8.0% mgmt
Financing live
Cash to close
- Down payment
- $625
- Closing costs
- $75
- Reserves months
- —
- Total cash needed
- —
Loan-product check · same deal, 3 products live
Conventional
25% down · 7.5% · 30yr
- Down + closing
- —
- Monthly P&I
- —
- Monthly cashflow
- —
- DSCR
- —
- Eligible?
- —
Personal DTI + credit; lowest rate.
DSCR
20% down · 8.5% · 30yr
- Down + closing
- —
- Monthly P&I
- —
- Monthly cashflow
- —
- DSCR
- —
- Eligible?
- —
No personal income docs; deal must DSCR.
Hard money
10% down · 12.0% · 12mo
- Down + closing
- —
- Monthly P&I
- —
- Monthly cashflow
- —
- DSCR
- —
- Eligible?
- —
Short-term bridge; refi at stabilization.
Rent comps 4 comps
| Address | Beds | Baths | Sqft | Rent | $/sqft | DOM | Units | Dist |
|---|---|---|---|---|---|---|---|---|
| 510 Jamaica Blvd Toms River, NJ | 2.0 | 2.0 | 1264 | $2,500 | $1.98 | 0d | 1 | 1.05mi |
| 10 Purnell St Toms River, NJ | 2.0 | 2.0 | 1232 | $2,300 | $1.87 | 0d | 1 | 1.21mi |
| 159 Fort de France Ave Toms River, NJ | 2.0 | 2.0 | 1440 | $2,475 | $1.72 | 8d | 1 | 1.25mi |
| 59 Guadeloupe Dr Toms River, NJ | 2.0 | 2.0 | 1126 | $2,300 | $2.04 | 0d | 1 | 1.30mi |
HOA detail
- Monthly dues
- $23 · $276/yr
- Likely covers
- gas
Listing history 2 events
-
2026-06-21remarks 373-char remark
-
2026-06-21$2,500 Active 2 DOM
ⓘ Source: listings_history table (triggers on properties + properties_extension) + one-shot
backfill from property_details.listing_events for pre-trigger history.
Climate risk First Street
- Flood 1/10 Low FEMA zone X (unshaded) · 0% chance over 30 yrs
- Wildfire 7/10 Severe
- Heat 7/10 Severe 7 d/yr ≥103°F today · 16 d/yr by 30 yrs out
- Wind 6/10 Major 65% chance of damaging wind over 30 yrs
- Air quality 3/10 Moderate 3 unhealthy d/yr today · 4 by 30 yrs out
Nearby sold comps map
Loading sold comps map…
Walkable amenities ~0.75 mi
Loading nearby amenities…
Taxation est. · year 1
- Rental income
- $30,090
- − Mortgage interest
- −$140
- − Property taxes
- −$38
- − Insurance
- −$12
- − Repairs & maintenance
- −$2,407
- − Management
- −$2,407
- − HOA
- −$276
- − Depreciation
- −$73
- Taxable income
- $24,737
- Est. tax owed @ 24.0%
- −$5,937
- After-tax cash flow
- $17,351/yr
For passive investors: Depreciation is non-cash, so a rental often shows a tax loss while cash-flowing — sheltering income. Rental losses are passive: they offset passive income freely, and up to $25,000/yr can offset ordinary (W-2) income if you actively participate and your MAGI is under $100k (phasing out to $0 by $150k); unused losses carry forward. On sale, claimed depreciation is recaptured at up to 25%, and gains may owe capital-gains tax (a 1031 exchange can defer both). Figures are a year-1 estimate at your 24.0% rate — not tax advice; consult a CPA.
Schools (NCES district)
- District
- Central Regional School District
- NCES district ID
- 3402910
- Math proficiency
- 17% ▼ -14.00%
- Reading proficiency
- 43% ▲ 7.00%
- Median HH income
- $44,676
- Composite
- 25.59/100
- National rank
- #7422
- State rank
- #357 of 472 in NJ
Livability — Holiday City-Berkeley
No livability data for this city. (Only ~50 U.S. cities are tracked.)
Census & demographics
- Census place
- Holiday City-Berkeley, NJ
- County
- Ocean County · 439,426 people
- City population
- 35,652
- Metro
- New York-Newark-Jersey City, NY-NJ-PA
- Population (ZIP)
- 36,087
- Household income
- $58,319
- Rent vs Own
- Severe rent burden
- 1010.0
Population outlook (Ocean County) Hauer SSP2
- Today (2025)
- 586,991 people
- By 2030
- 581,403 · -1.0%
- By 2040
- 564,913 · -3.8%
- By 2050
- 538,149 · -8.3%
- By 2075
- 468,845 · -20.1%
- By 2100
- 350,297 · -40.3%
Race, ethnicity, and origin ACS 2023
- Neighborhood character
- Predominantly White (75%)
- Race & ethnicity
- White 75% Hispanic / Latino 15% Two or more races 9% Black 5% Asian 2%
- Hispanic origin (detail)
- Mexican 4% Puerto Rican 6% Dominican 1%
- Common ancestry
- Romanian 9% Slovak 2% Iranian 2%
- Foreign-born
- 11% · Canada, Jamaica
- Languages at home
- 85% English-only · Spanish 7% Other Indo-European 3% Russian/Polish/Slavic 2%
Political lean MEDSL · Ocean
- 2024 margin
- Solid R (+36.0) · D 31.4% · R 67.4% · Other 1.2%
- 2008→2024 swing
- -17.6pp toward R · 2008: -18.4pp · 2024: -36.0pp
- All cycles
- 2024: R+36.0 2020: R+28.7 2016: R+34.0 2012: R+17.7 2008: R+18.4
Not yet ingested
- Civics
- —
Market trends
- HPI YoY
- ▼ -429.32%
- Current HPI
- 305.1341
- Rent YoY
- —
- Metro
- New York-Newark-Jersey City, NY-NJ-PA
- State GDP YoY
- ▲ 2.05%
- F500 in state
- 34
Industry mix (Fortune 500 HQ in NJ)
| Industry | F500 HQs | Revenue |
|---|---|---|
| Consumer Goods | 3 | $31B |
|
||
| Pharmaceuticals | 2 | $153B |
|
||
| Technology | 2 | $21B |
|
||
| Insurance | 2 | $20B |
|
||
| Healthcare | 2 | $19B |
|
||
| Financial Services | 1 | $70B |
|
||
Price history
-96.3% since first listed27 events — show timeline
- 2026-06-19 Listed $2,500 MOMLS
- 2024-08-16 Rental Removed $2,250 MOMLS
- 2024-07-29 Price Changed $275,000 MOMLS
- 2024-06-29 Price Changed $2,250 MOMLS
- 2024-05-31 Listed for Rent $2,375 MOMLS
- 2024-04-07 Price Changed $315,000 MOMLS
- 2024-03-01 Listed $329,000 MOMLS
- 2023-09-03 Listed $299,000 MOMLS
- 2014-07-09 Sold (Public Records) $147,000 Public Records
- 2014-07-03 Sold (MLS) $147,000 BRIGHT MLS
- 2014-07-03 Sold (MLS) $147,000 MOMLS
- 2014-02-03 Listed $149,900 BRIGHT MLS
- 2014-02-03 Listed $149,900 MOMLS
- 2014-02-02 Listing Removed — BRIGHT MLS
- 2013-11-02 Listed $159,900 MOMLS
- 2013-11-02 Listed $159,900 BRIGHT MLS
- 2005-09-09 Sold (Public Records) $172,500 Public Records
- 2005-05-16 Sold (MLS) $172,500 BRIGHT MLS
- 2005-03-15 Listed $172,500 BRIGHT MLS
- 1999-12-23 Sold (Public Records) $88,500 Public Records
- 1999-12-17 Sold (MLS) $88,500 MOMLS
- 1999-11-23 Delisted — MOMLS
- 1999-11-22 Sold (Public Records) $58,000 Public Records
- 1999-11-09 Listed $88,500 MOMLS
- 1999-10-22 Sold (MLS) $58,000 MOMLS
- 1999-09-03 Delisted — MOMLS
- 1999-06-25 Listed $66,900 MOMLS
Property tax history
+1.6%/yrLatest (2025): $2,774 · +7.4% YoY. Source: county tax records.
Cash-flow waterfall
monthlySold comps — $/sqft
last 12 mo · ≤1 miLoading sold comps…