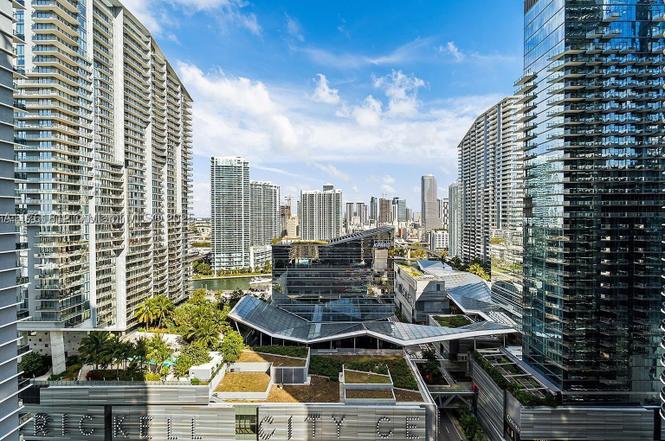
55 SW 9th St #1107 · Miami, FL
Flood risk No data
- FEMA flood zone
- —
- Chance of flooding over 30 yrs
- —
- Est. flood insurance / yr
- —
Fire risk No data
- Est. fire insurance / yr
- —
Heat risk No data
- Hot days now (above threshold)
- —
- Hot days in 30 yrs
- —
Wind risk No data
- Chance of severe wind over 30 yrs
- —
Air-quality risk No data
- Unhealthy air days now
- —
- Unhealthy air days in 30 yrs
- —
Risk factors via First Street. Map © Google.
Why this score? — see what drove the F grade
The composite is a weighted blend of 9 inputs, each scored 0–100. Each bar is that input's sub-score; the figure is the points it added to the 100-point composite (weight × sub-score).
- ARV discount +7.5/15.0
- Cash flow +6.6/30.0
- Schools +4.2/10.0
- Appreciation +4.1/10.0
- Livability +3.9/5.0
- 1% rule +2.9/10.0
- Condition / age +2.5/5.0
- Rent growth +2.4/5.0
- DSCR +0.9/10.0
$435,000
🖨 Deal sheet (PDF) 📄 Offer letter ✓ Due diligence
Listing remarks
Landmark Architect design Brickell Heights West in the best of Brickell. Beautiful 1 Bed 1 Bath. Has 1 parking space driven by valet and 24hr valet for all visitors. Custom made curtains on all unit and blackout curtains in the bedroom, wooden Italian closet, stainless steel of the latest newest appliances. Amenity rich lifestyle including Equinox. Rooftop pool and lounging areas. Spa, Theatre, social room, childrens playroom and much more. .. .. . Steps from Brickell Citi Centre Mall and the exciting lifestyle on Brickell and South Miami Avenue and the Exquisite Restaurants. Leased until March 31, 2026 for $3100 Best price in the building! IT WON'T LAST!!!!
Key facts
- Custom made curtains
- 1 parking space
- 24hr valet
Tags
Property features AI
Finance
- Other: Association-managed pool
- Financial info: Pets allowed with restrictions or possible restrictions (conditional)
- HOA & community: Monthly association fee; Association fee covers amenities, common areas, cable TV, internet, reserve fund, sewer, security and water; Community amenities include billiard room, business center, clubhouse, elevators, fitness center and pool
Exterior
- Parking: Assigned parking; One assigned space; Valet parking available
- Security: Secured lobby
- Utilities: Water included in association fee; Sewer included in association fee; Cable TV and internet included in association fee; Building power available
- Home design: Condominium (attached property); 11th floor entry location
- Construction: Block construction; Resale property; 40-story building
- Exterior features: Balcony; Open balcony/patio
Interior
- Kitchen: Built-in oven; Electric range; Dishwasher; Garbage disposal; Refrigerator
- Bedrooms: Bedroom located on the main level
- Flooring: Vinyl
- Bathrooms: 1 full bathroom
- Heating & cooling: Central heating; Central air conditioning
- Interior features: Unfurnished; Bedroom on main level; First-floor entry
- Laundry & utility: Washer; Dryer
Neighborhood map
What this means for you Summary
Snapshot
- This is a 1-bed/1.0-bath condo listed at $435k.
Deal economics
- At list price, monthly cash flow is $-717 ($-9k/yr) — negative.
- To cash-flow at today's rent, offer at most $308k (29.1% below list).
- To meet the 1% rule (rent ≥ 1% of price), the offer needs to be $342k (21.5% below list).
- Recommended offer: $308k (29.1% below list) — sets the bar for cash-flow.
- Cap rate 4.3% vs local median 1.9% in Miami — top-decile yield for the area; either an underpriced asset or a hidden risk that comps aren't pricing in. Stress-test before assuming the spread holds.
Location & tenants
- Location reads 78/100 on livability (#177 in FL, #2,724 nationally) — a middle-class / working-renter tenant base. Strengths: amenities A+, commute A+, health & safety A+; Watch: employment C-, crime F, cost of living F.
- Miami-Dade (suburban): math 45% / reading 54% proficiency, ranked #40 of 73 in FL (top 55%) — families likely to look elsewhere, expect single-tenant / working-renter base with shorter leases; 64% free/reduced lunch — lower-income household profile, screen leases tightly.
- Zoned schools: Southside Preparatory Academy (math 54% / reading 61%, grade C+, #764 of 2,144 statewide, top 36%, 929 students, 39% FRL); Shenandoah Middle School (math 34% / reading 44%, grade F, #381 of 571 statewide, top 67%, 1,296 students, 72% FRL); Booker T. Washington Senior High (math 12% / reading 19%, grade F, #604 of 667 statewide, top 91%, 1,014 students, 60% FRL).
- Zoned-school proficiency averages 37% at this address vs 50% district-wide (-12 pts) — the specific schools serving this property underperform the Miami-Dade average; the district grade overstates school quality for this exact location.
- Market conditions: Rents soft (-0.5%/yr); 642 active listings in the ZIP; 1 comparable units currently listed for rent nearby; 10,051 units permitted in Miami-Dade County in 2024 (7,758 in 5+ unit buildings).
- At $3,417/mo this rent would consume 67% of the median local household income ($61k/yr) (locally 5231% of renters already pay >50% of income on rent) — very limited rent-growth headroom before tenants either downsize or default.
Forward outlook
- Local home prices are declining (-1.8%/yr); year-one equity from $3k of loan paydown is wiped out by about $8k of value loss. Plan a longer hold.
- Miami-Dade County population projected at +28% by 2050 — long-run rental-demand tailwind backs the buy-and-hold thesis.
Negotiation context
- It's been on market 458 days — a 12% lower offer ($383k) is reasonable based on typical stale-listing flexibility.
- 8 sale attempts since 8y ago; this cycle's ask is 14646% above the opening price — seller raised mid-cycle; expect resistance to lowballs.
- Current owner paid $301k; 45% above their basis — modest negotiation headroom, anchor on the comps not their cost.
Questions for the listing agent
- What do current leases actually rent for vs. the listed asking? Can we see a recent rent roll and the last 12 months of T-12 income?
- It's been on market 458 days. Have you received any prior offers? Is the seller open to a 29% concession, seller financing, or rate buy-down credit?
- What does the HOA fee cover, when was the last increase, and are there any pending special assessments or reserve-fund shortfalls?
- Any open or pending special assessments — roof, HVAC, plumbing, elevator, façade? What's the per-unit balance and payoff schedule, and is the seller paying it off at close or rolling it to the buyer?
- Why hasn't it sold? Are there any deal-killer items the seller is aware of (foundation, flood, title, zoning, code violations)?
- Is there a deadline driving the sale (1031 exchange, divorce, estate, relocation)? That informs how much negotiation room exists.
- Schools are B-rated — typically a magnet for longer-tenancy family renters. What's the average tenant stay here, and is there a school-zone premium baked into asking?
- Crime grade is F in this area — have there been break-ins, vandalism, or insurance claims at this property in the last 3 years? What carrier currently insures it and at what premium?
- The area grade is low — what's the realistic commute time and amenity access for the typical tenant pool here? Any planned neighborhood developments (good or bad) we should know about?
- What's the average days-on-market for RENTAL listings here right now (not sales)? A rising rental-DOM trend means longer vacancies and softer asking-rent achievability than the comps imply.
- What's the recent tenant-quality profile in this submarket — average credit score on applications, eviction rate, late-payment / NSF rate, and stable-employment percentage? A property-management company in the area should have these aggregated.
- How much new apartment / multifamily construction is in the pipeline within 1–3 miles? Heavy new supply (>2% of stock underway) typically softens rents 12–24 months out; light construction supports rent growth.
Investment metrics
- 1% rule
- 0.79% ✗
- Cap rate
- 4.31%
- Cash-on-cash
- -7.07%
- DSCR
- 0.69
- GRM
- 10.6
CMA / ARV
No comps found within radius.
Projected returns pro-forma
-1.79% appreciation · 0.0% rent growth · sell at horizon
- IRR
- -22.3%
- Equity multiple
- 0.15×
- Total profit
- $-103,423
- Equity at exit
- $88,753
- IRR
- -21.2%
- Equity multiple
- -0.36×
- Total profit
- $-166,099
- Equity at exit
- $79,959
Cash invested: $121,800 (down + closing). Projections, not guarantees.
Landlord ↔ Tenant lean methodology
- Overall (STATE)
- 87 Strongly Landlord-Friendly
- State Florida
- 87 Strongly Landlord-Friendly · R+3
- County
- — inherits STATE
- City
- — inherits STATE
ZIP-level market 33130
- Home prices YoY
- -0.5%
- Rents YoY
- -0.5%
- Active inventory
- 642
- Price-to-rent
- 10.6×
Monthly cashflow live
- Estimated rent
- $3,417 medium interval (Pro) →
- Mortgage (P&I)
- −$2,281
- Tax from tax record
- −$515 /mo · $6,181/yr
- Insurance
- −$181
- HOA
- −$439
- Vacancy / Maint / Mgmt
- −$718
- Net cashflow
- $-717
Break-even live
Sensitivity live
| Price | -10% $-471 | -5% $-594 | +0% $-717 | +5% $-840 | +10% $-964 |
|---|---|---|---|---|---|
| Rent | -10% $-987 | -5% $-852 | +0% $-717 | +5% $-582 | +10% $-447 |
| Rate | -1.0pp $-498 | -0.5pp $-607 | base $-717 | +0.5pp $-830 | +1.0pp $-945 |
UW: 25.0% down · 7.5% · 30yr · 1.5% tax · 5.0% vac · 8.0% maint · 8.0% mgmt
Financing live
Cash to close
- Down payment
- $108,750
- Closing costs
- $13,050
- Reserves months
- —
- Total cash needed
- —
Loan-product check · same deal, 3 products live
Conventional
25% down · 7.5% · 30yr
- Down + closing
- —
- Monthly P&I
- —
- Monthly cashflow
- —
- DSCR
- —
- Eligible?
- —
Personal DTI + credit; lowest rate.
DSCR
20% down · 8.5% · 30yr
- Down + closing
- —
- Monthly P&I
- —
- Monthly cashflow
- —
- DSCR
- —
- Eligible?
- —
No personal income docs; deal must DSCR.
Hard money
10% down · 12.0% · 12mo
- Down + closing
- —
- Monthly P&I
- —
- Monthly cashflow
- —
- DSCR
- —
- Eligible?
- —
Short-term bridge; refi at stabilization.
Rent comps 1 comps
| Address | Beds | Baths | Sqft | Rent | $/sqft | DOM | Units | Dist |
|---|---|---|---|---|---|---|---|---|
| 601 NE 1st Ave Unit 1227496P Miami, FL | 3.0 | 1.0–3.0 | 904 | $8,354 | $9.24 | 1d | 4 | 1.02mi |
HOA detail condo
- Monthly dues
- $439 · $5,268/yr
- Likely covers
- pool
- Assessments
- None detected in remarks — confirm with the listing agent.
Listing history 29 events
-
2026-06-22days on market $435,000 Active 458 DOM
-
2026-06-18days on market $435,000 Active 455 DOM
-
2026-06-17days on market $435,000 Active 454 DOM
-
2026-06-16days on market $435,000 Active 453 DOM
-
2026-06-15days on market $435,000 Active 452 DOM
-
2026-06-13days on market $435,000 Active 450 DOM
-
2026-06-09days on market $435,000 Active 446 DOM
-
2026-06-08days on market $435,000 Active 445 DOM
-
2026-06-08days on market $435,000 Active 444 DOM
-
2026-06-04days on market $435,000 Active 441 DOM
-
2026-06-03days on market $435,000 Active 440 DOM
-
2026-06-02days on market $435,000 Active 439 DOM
-
2026-06-01days on market $435,000 Active 438 DOM
-
2026-05-31days on market $435,000 Active 437 DOM
-
2026-04-28price $435,000
-
2026-04-21historical $2,950
-
2026-02-26$2,950
-
2025-07-28price $459,000
-
2025-07-10price $475,000
-
2025-03-12$495,000 Active
-
2022-01-27historical
-
2022-01-27status Active
-
2021-12-18status Active
-
2021-11-18status Active
-
2021-09-01status Active
-
2021-06-01status Active
-
2020-03-04price $330,000
-
2018-03-13$370,000 Active
-
2017-07-03soldstatus $300,900
ⓘ Source: listings_history table (triggers on properties + properties_extension) + one-shot
backfill from property_details.listing_events for pre-trigger history.
Tax reassessment forecast FL · Resets to sale price
- Current annual tax
- $6,181 · $515/mo
- Projected year-2 tax
- $6,181 · $515/mo
- Expected delta
- $0/yr ($0/mo · 0.0%)
ⓘ Screening estimate from a state-policy table — verify with the county assessor before closing.
Nearby sold comps map
Loading sold comps map…
Walkable amenities ~0.75 mi
Loading nearby amenities…
Taxation est. · year 1
- Rental income
- $41,001
- − Mortgage interest
- −$24,367
- − Property taxes
- −$6,181
- − Insurance
- −$2,175
- − Repairs & maintenance
- −$3,280
- − Management
- −$3,280
- − HOA
- −$5,268
- − Depreciation
- −$12,655
- Taxable loss
- −$16,205
- Est. tax savings @ 24.0%
- +$3,889
- After-tax cash flow
- $-4,718/yr
For passive investors: Depreciation is non-cash, so a rental often shows a tax loss while cash-flowing — sheltering income. Rental losses are passive: they offset passive income freely, and up to $25,000/yr can offset ordinary (W-2) income if you actively participate and your MAGI is under $100k (phasing out to $0 by $150k); unused losses carry forward. On sale, claimed depreciation is recaptured at up to 25%, and gains may owe capital-gains tax (a 1031 exchange can defer both). Figures are a year-1 estimate at your 24.0% rate — not tax advice; consult a CPA.
Schools (NCES district)
- District
- Miami-Dade
- NCES district ID
- 1200390
- Math proficiency
- 45% ▼ -16.00%
- Reading proficiency
- 54% ▼ -5.00%
- Median HH income
- $43,928
- Composite
- 41.76/100
- National rank
- #3397
- State rank
- #40 of 73 in FL
Livability — Miami
- Score
- 78/100
- State rank
- #177
- US rank
- #2724
Category grades
Schools grade is shown separately in the Schools card above.
Census & demographics
- Census place
- Miami, FL
- County
- Miami-Dade County · 2,697,751 people
- City population
- 827,308
- Metro
- Miami-Fort Lauderdale-Pompano Beach, FL
- Population (ZIP)
- 34,964
- Household income
- $61,009
- Rent vs Own
- Severe rent burden
- 5231.0
Population outlook (Miami-Dade County) Hauer SSP2
- Today (2025)
- 3,126,439 people
- By 2030
- 3,325,765 · +6.4%
- By 2040
- 3,697,561 · +18.3%
- By 2050
- 4,012,134 · +28.3%
- By 2075
- 4,605,612 · +47.3%
- By 2100
- 4,866,598 · +55.7%
Race, ethnicity, and origin ACS 2023
- Neighborhood character
- Predominantly Hispanic (73%)
- Race & ethnicity
- Hispanic / Latino 73% Two or more races 44% White 17% Black 4% Asian 3%
- Hispanic origin (detail)
- Mexican 3% Puerto Rican 3% Cuban 24% Dominican 4%
- Common ancestry
- Romanian 2% Estonian 1% Lithuanian 1%
- Foreign-born
- 60% · Canada, Jamaica, Guatemala
- Languages at home
- 23% English-only · Spanish 70% Other Indo-European 2% Russian/Polish/Slavic 1%
Political lean MEDSL · Miami-Dade
- 2024 margin
- R (+11.4) · D 43.9% · R 55.4%
- 2008→2024 swing
- -27.6pp toward R · 2008: 16.1pp · 2024: -11.4pp
- All cycles
- 2024: R+11.4 2020: D+7.3 2016: D+29.6 2012: D+23.7 2008: D+16.1
Not yet ingested
- Civics
- —
Market trends
- HPI YoY
- ▼ -1.79%
- Current HPI
- 344.7752
- Rent YoY
- ▼ -0.53%
- Metro
- Miami-Fort Lauderdale-Pompano Beach, FL
- State GDP YoY
- ▲ 3.28%
- F500 in state
- 36
Industry mix (Fortune 500 HQ in FL)
| Industry | F500 HQs | Revenue |
|---|---|---|
| Industrial Technology | 2 | $29B |
|
||
| Insurance | 2 | $17B |
|
||
| Retail | 1 | $60B |
|
||
| Technology Distribution | 1 | $58B |
|
||
| Homebuilding | 1 | $35B |
|
||
| Technology Manufacturing | 1 | $35B |
|
||
Price history
+44.6% since first listed15 events — show timeline
- 2026-04-28 Price Changed $435,000 MARMLS
- 2026-04-21 Rental Removed $2,950 MARMLS
- 2026-02-26 Listed for Rent $2,950 MARMLS
- 2025-07-28 Price Changed $459,000 MARMLS
- 2025-07-10 Price Changed $475,000 MARMLS
- 2025-03-12 Listed $495,000 MARMLS
- 2022-01-27 Listing Removed — MARMLS
- 2022-01-27 Relisted — MARMLS
- 2021-12-18 Relisted — MARMLS
- 2021-11-18 Relisted — MARMLS
- 2021-09-01 Relisted — MARMLS
- 2021-06-01 Relisted — MARMLS
- 2020-03-04 Price Changed $330,000 MARMLS
- 2018-03-13 Listed $370,000 MARMLS
- 2017-07-03 Sold (Public Records) $300,900 Public Records
Property tax history
+30.7%/yrLatest (2025): $6,181 · +3.2% YoY. Source: county tax records.
Cash-flow waterfall
monthlySold comps — $/sqft
last 12 mo · ≤1 miLoading sold comps…