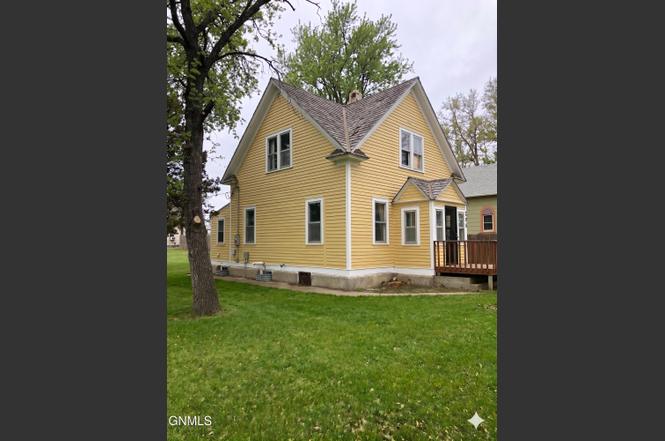
206 2nd Ave E · Zap, ND
Flood risk No data
- FEMA flood zone
- —
- Chance of flooding over 30 yrs
- —
- Est. flood insurance / yr
- —
Fire risk No data
- Est. fire insurance / yr
- —
Heat risk No data
- Hot days now (above threshold)
- —
- Hot days in 30 yrs
- —
Wind risk No data
- Chance of severe wind over 30 yrs
- —
Air-quality risk No data
- Unhealthy air days now
- —
- Unhealthy air days in 30 yrs
- —
Risk factors via First Street. Map © Google.
Why this score? — see what drove the B grade
The composite is a weighted blend of 9 inputs, each scored 0–100. Each bar is that input's sub-score; the figure is the points it added to the 100-point composite (weight × sub-score).
- Cash flow +30.0/30.0
- 1% rule +10.0/10.0
- DSCR +10.0/10.0
- ARV discount +9.2/15.0
- Appreciation +5.0/10.0
- Livability +3.0/5.0
- Schools +2.9/10.0
- Rent growth +2.5/5.0
- Condition / age +2.2/5.0
$60,000
🖨 Deal sheet 📄 Offer letter ✓ Due diligence
Key facts
- Generous lot
- 0.24 acre lot
- Built 1920
Tags
Property features AI
Exterior
- Parking: Driveway
- Utilities: Public water; Public sewer
- Home design: Single-family residence; Two levels
- Construction: Wood siding; Wood and composition roof; Unfinished basement
- Exterior features: Partial fencing; Level lot; Lot dimensions approximately 75 x 140
Interior
- Kitchen: Electric range; Refrigerator
- Flooring: Vinyl flooring
- Bathrooms: One full bathroom
- Heating & cooling: Baseboard heating; Natural gas heating; No central cooling
- Interior features: See remarks
Neighborhood map
What this means for you Summary
Snapshot
- This is a 3-bed/1.0-bath single-family listed at $60k. Condition is rated fair.
Deal economics
- At list price, monthly cash flow is $428 ($5k/yr) — positive.
- The deal already cash-flows at list — no discount required.
- Meets the 1% rule at list price ($1k rent vs $60k).
Location & tenants
- Location reads 60/100 on livability (#267 in ND) — a middle-class / working-renter tenant base. Strengths: cost of living A+; Watch: crime D+, health & safety D+, schools F.
- Beulah 27 (town): math 31% / reading 33% proficiency, ranked #37 of 53 in ND (top 70%) — families likely to look elsewhere, expect single-tenant / working-renter base with shorter leases; only 17% free/reduced lunch — higher-income household profile.
- Market conditions: 1 active listings in the ZIP; 15 units permitted in Mercer County in 2024 (0 in 5+ unit buildings).
Forward outlook
- In year one you build about $2k of equity ($415 loan paydown + $2k appreciation (3.0% local appreciation)).
- Mercer County population projected at +38% by 2050 — long-run rental-demand tailwind backs the buy-and-hold thesis.
- At projected returns (3.0% appreciation + 3.0% rent growth), your $17k cash investment doubles in ~3 years — after that, you're playing with house money.
Negotiation context
- Only 4 days on market — expect competitive offers; lowballing is unlikely to land.
Risks & watch-outs
- Watch-outs: built in 1920 — expect roof / HVAC / electrical / plumbing capex.
Questions for the listing agent
- Have any recent inspections been done? Can we get a copy of the seller's disclosures and any deferred-maintenance estimates?
- Built in 1920 — when were the roof, HVAC, electrical panel, plumbing, and water heater last replaced?
- Is there a deadline driving the sale (1031 exchange, divorce, estate, relocation)? That informs how much negotiation room exists.
- Schools are F-rated, which usually means shorter tenancies and higher turnover. Who's the typical renter profile here, and what's been the actual vacancy rate?
- Crime grade is D in this area — have there been break-ins, vandalism, or insurance claims at this property in the last 3 years? What carrier currently insures it and at what premium?
- What's the average days-on-market for RENTAL listings here right now (not sales)? A rising rental-DOM trend means longer vacancies and softer asking-rent achievability than the comps imply.
- What's the recent tenant-quality profile in this submarket — average credit score on applications, eviction rate, late-payment / NSF rate, and stable-employment percentage? A property-management company in the area should have these aggregated.
- How much new for-sale + rental construction is in the pipeline within 1–3 miles? Heavy new supply typically softens prices + rents 12–24 months out; constrained supply supports both.
Investment metrics
- 1% rule
- 1.78% ✓
- Cap rate
- 14.84%
- Cash-on-cash
- 30.54%
- DSCR
- 2.36
- GRM
- 4.7
CMA / ARV
- ARV (on-the-fly)
- $62,400
- Comps found
- 3
Show comp detail 3 sales within ~0.75 mi
| Address | Dist | Beds/Ba | Sqft | Sold | Price | $/sf | Match |
|---|---|---|---|---|---|---|---|
| 103 1st Ave E | 0.10mi | 3/1.0 | 1,134 (-6%) | 5mo | $59,000 | $52 | 82 |
| 103 1st Ave E | 0.10mi | 3/1.0 | 1,134 (-6%) | 23mo | $48,000 | $42 | 67 |
| 100 1st Ave W | 0.15mi | 2/1.0 (-1) | 1,120 (-7%) | 14mo | $84,000 | $75 | 66 |
Match score weights: distance 35% · size 25% · config 20% · recency 20%. Top-matched comps best support the ARV.
Projected returns pro-forma
3.0% appreciation · 3.0% rent growth · sell at horizon
- IRR
- 36.4%
- Equity multiple
- 3.05×
- Total profit
- $34,474
- Equity at exit
- $26,979
- IRR
- 36.5%
- Equity multiple
- 6.04×
- Total profit
- $84,593
- Equity at exit
- $41,577
Cash invested: $16,800 (down + closing). Projections, not guarantees.
Landlord ↔ Tenant lean methodology
- Overall (STATE)
- 82 Strongly Landlord-Friendly
- State North Dakota
- 82 Strongly Landlord-Friendly · R+20
- County
- — inherits STATE
- City
- — inherits STATE
ZIP-level market 58580
- Active inventory
- 1
- Price-to-rent
- 4.7×
Monthly cashflow live
- Estimated rent
- $1,066 medium interval (Pro) →
- Mortgage (P&I)
- −$315
- Tax est. 1.5%
- −$75 /mo · $900/yr
- Insurance
- −$25
- HOA
- −$0
- Vacancy / Maint / Mgmt
- −$224
- Net cashflow
- $428
Break-even live
UW: 25.0% down · 7.5% · 30yr · 1.5% tax · 5.0% vac · 8.0% maint · 8.0% mgmt
Financing live
Cash to close
- Down payment
- $15,000
- Closing costs
- $1,800
- Reserves months
- —
- Total cash needed
- —
Loan-product check · same deal, 3 products live
Conventional
25% down · 7.5% · 30yr
- Down + closing
- —
- Monthly P&I
- —
- Monthly cashflow
- —
- DSCR
- —
- Eligible?
- —
Personal DTI + credit; lowest rate.
DSCR
20% down · 8.5% · 30yr
- Down + closing
- —
- Monthly P&I
- —
- Monthly cashflow
- —
- DSCR
- —
- Eligible?
- —
No personal income docs; deal must DSCR.
Hard money
10% down · 12.0% · 12mo
- Down + closing
- —
- Monthly P&I
- —
- Monthly cashflow
- —
- DSCR
- —
- Eligible?
- —
Short-term bridge; refi at stabilization.
Listing history 4 events
-
2026-06-18days on market $60,000 Active 4 DOM
-
2026-06-17days on market $60,000 Active 3 DOM
-
2026-06-16days on market $60,000 Active 2 DOM
-
2026-06-15$60,000 Active 1 DOM
ⓘ Source: listings_history table (triggers on properties + properties_extension) + one-shot
backfill from property_details.listing_events for pre-trigger history.
Nearby sold comps map
Loading sold comps map…
Walkable amenities ~0.75 mi
Loading nearby amenities…
Taxation est. · year 1
- Rental income
- $12,793
- − Mortgage interest
- −$3,361
- − Property taxes
- −$900
- − Insurance
- −$300
- − Repairs & maintenance
- −$1,023
- − Management
- −$1,023
- − Depreciation
- −$1,745
- Taxable income
- $4,439
- Est. tax owed @ 24.0%
- −$1,065
- After-tax cash flow
- $4,065/yr
For passive investors: Depreciation is non-cash, so a rental often shows a tax loss while cash-flowing — sheltering income. Rental losses are passive: they offset passive income freely, and up to $25,000/yr can offset ordinary (W-2) income if you actively participate and your MAGI is under $100k (phasing out to $0 by $150k); unused losses carry forward. On sale, claimed depreciation is recaptured at up to 25%, and gains may owe capital-gains tax (a 1031 exchange can defer both). Figures are a year-1 estimate at your 24.0% rate — not tax advice; consult a CPA.
Condition & rehab AI · 8 photos
The home requires moderate renovations to improve its condition and increase its value. Key areas for improvement include the kitchen, bathroom, and flooring.
Repairs flagged
- Major Kitchen cabinets — Older cabinets in need of replacement
- Major Bathroom tile — Dated tile in need of replacement
- Major Flooring — Carpeted floors in need of replacement
Value-add opportunities
- Resale Paint interior walls — Fresh paint enhances curb appeal
- Resale Replace kitchen cabinets — Modern cabinets improve functionality and aesthetics
- Resale Replace bathroom tile — Fresh tile enhances curb appeal and functionality
- Resale Replace flooring — Fresh flooring improves functionality and aesthetics
Renovation cost estimate screening
| Repair item | Severity | Est. cost |
|---|---|---|
| Kitchen cabinets · Older cabinets in need of replacement | Major | $15,000–50,000 |
| Bathroom tile · Dated tile in need of replacement | Major | $15,000–50,000 |
| Flooring · Carpeted floors in need of replacement | Major | $15,000–50,000 |
| Total estimated repair cost · 3 items | $45,000–150,000 |
Value-add ROI direction
- Resale Paint interior walls — Fresh paint enhances curb appeal ↑
- Resale Replace kitchen cabinets — Modern cabinets improve functionality and aesthetics ↑
- Resale Replace bathroom tile — Fresh tile enhances curb appeal and functionality ↑
- Resale Replace flooring — Fresh flooring improves functionality and aesthetics ↑
ⓘ Cost ranges are severity-bucket heuristics (US national rule-of-thumb). Get contractor quotes + a written scope before underwriting a rehab budget.
Schools (NCES district)
- District
- Beulah 27
- NCES district ID
- 3800032
- Math proficiency
- 31% ▼ -13.00%
- Reading proficiency
- 33% ▼ -6.00%
- Median HH income
- $65,415
- Composite
- 29.33/100
- National rank
- #6547
- State rank
- #37 of 53 in ND
Livability — Zap
- Score
- 60/100
- State rank
- #267
- US rank
- #19203
Category grades
Schools grade is shown separately in the Schools card above.
Census & demographics
- Census place
- Zap, ND
- Population (ZIP)
- 508
Population outlook (Mercer County) Hauer SSP2
- Today (2025)
- 9,891 people
- By 2030
- 10,506 · +6.2%
- By 2040
- 11,872 · +20.0%
- By 2050
- 13,612 · +37.6%
- By 2075
- 19,871 · +100.9%
- By 2100
- 25,938 · +162.2%
Race, ethnicity, and origin ACS 2023
- Neighborhood character
- Predominantly White (91%)
- Race & ethnicity
- White 91% Native American 6% Two or more races 3%
- Common ancestry
- Scotch-Irish 18% Portuguese 9% Norwegian 4%
- Languages at home
- 86% English-only · German/W. Germanic 14%
Political lean MEDSL · Mercer
- 2024 margin
- Solid R (+69.0) · D 14.8% · R 83.8% · Other 1.3%
- 2008→2024 swing
- -39.2pp toward R · 2008: -29.9pp · 2024: -69.0pp
- All cycles
- 2024: R+69.0 2020: R+67.4 2016: R+67.9 2012: R+44.9 2008: R+29.9
Not yet ingested
- Civics
- —
Market trends
- HPI YoY
- —
- Current HPI
- —
- Rent YoY
- —
- Metro
- —
- State GDP YoY
- ▲ 2.09%
- F500 in state
- 2
Industry mix (Fortune 500 HQ in ND)
| Industry | F500 HQs | Revenue |
|---|---|---|
| Utilities / Construction | 1 | $6B |
|
||
Price history
1 event — show timeline
- 2026-06-14 Listed $60,000 GNMLS
Cash-flow waterfall
monthlySold comps — $/sqft
last 12 mo · ≤1 miLoading sold comps…