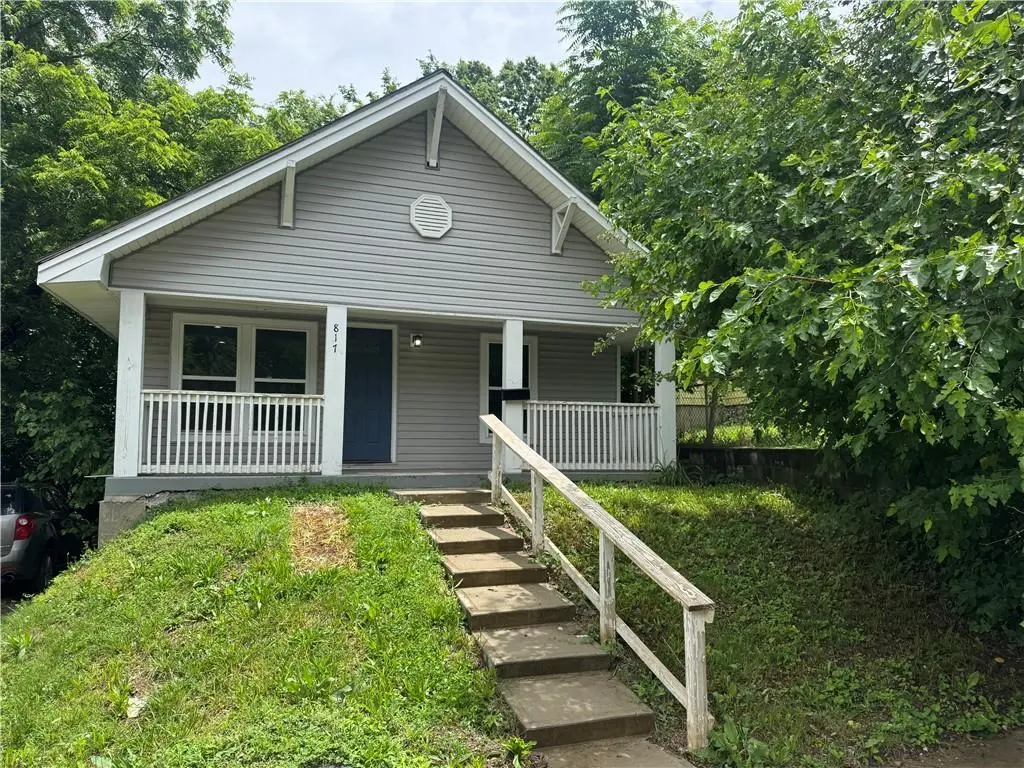
817 White Ave · Kansas City, MO
Flood risk 1/10 · Minimal
- FEMA flood zone
- X (unshaded)
- Chance of flooding over 30 yrs
- 0.0%
- Est. flood insurance / yr
- $473 – $860
Fire risk 1/10 · Minimal
- Est. fire insurance / yr
- $1,054 – $1,958
Heat risk 4/10 · Minor
- Hot days now (above 106°F)
- 7 days/yr
- Hot days in 30 yrs
- 17 days/yr
Wind risk 2/10 · Minimal
- Chance of severe wind over 30 yrs
- —
Air-quality risk 3/10 · Minor
- Unhealthy air days now
- 2 days/yr
- Unhealthy air days in 30 yrs
- 3 days/yr
Risk factors via First Street. Map © Google.
Why this score? — see what drove the B grade
The composite is a weighted blend of 9 inputs, each scored 0–100. Each bar is that input's sub-score; the figure is the points it added to the 100-point composite (weight × sub-score).
- Cash flow +27.5/30.0
- Appreciation +10.0/10.0
- DSCR +9.6/10.0
- ARV discount +7.0/15.0
- 1% rule +6.3/10.0
- Livability +3.9/5.0
- Rent growth +2.5/5.0
- Condition / age +2.5/5.0
- Schools +1.5/10.0
$105,000
🖨 Deal sheet (PDF) 📄 Offer letter ✓ Due diligence
Listing remarks MLS
Welcome Home! This recently renovated home is a must-see. Nestled in the Fairview neighborhood, this 2 bedroom, 1 bath home boasts a wonderful blend of modern design and functionality. As you step inside, you'll immediately notice the spaciousness of the open floor plan, seamlessly connecting the kitchen and living room. This thoughtful layout creates an inviting ambiance, per for both entertaining guests and enjoy quality time with loved ones. The kitchen is tastefully updated with White cabinets and granite countertops. The living room is flooded with natural light, thanks to the large windows off the large front porch. The included additional convenience of off-street parking along with plenty of space in the backyard to create your own serene oasis. Additionally, there will be a new Gas Range installed prior to closing. Do not hesitate, schedule your showing today!
Key facts
- 3,528 sq ft lot
- Built 1920
- Listed 10 days
Property features AI
Finance
- Financial info: Annual tax amount listed (excluded per instructions)
- HOA & community: No association fees; No community maintenance provided
Exterior
- Parking: Off-street parking
- Utilities: Public water; Public sewer
- Home design: Single family residence; Bungalow floor plan; Faces west
- Construction: Frame construction; Composition roof
- Exterior features: Lot approximately 3,528 square feet; Not in a flood plain
Interior
- Kitchen: Kitchen on the main level (vinyl)
- Bedrooms: 2 bedrooms on the main level (both carpeted)
- Flooring: Carpet in bedrooms; Vinyl in kitchen, living room, and bathroom
- Bathrooms: 1 full bathroom on the main level (vinyl)
- Heating & cooling: Natural gas heating; Cooling present (no central/other cooling specified)
- Interior features: Living/dining combo; Has basement with concrete, partial, and stone/rock construction
Neighborhood map
What this means for you Summary
Snapshot
- This is a 3-bed/1.0-bath single-family listed at $105k.
Deal economics
- At list price, monthly cash flow is $309 ($4k/yr) — positive.
- The deal already cash-flows at list — no discount required.
- Meets the 1% rule at list price ($1k rent vs $105k).
- Cap rate 9.8% vs local median 3.9% in Kansas City — top-decile yield for the area; either an underpriced asset or a hidden risk that comps aren't pricing in. Stress-test before assuming the spread holds.
Location & tenants
- Location reads 78/100 on livability (#28 in MO, #2,671 nationally) — a middle-class / working-renter tenant base. Strengths: amenities A+, commute A+, cost of living A+; Watch: crime F.
- Kansas City 33 (urban): math 12% / reading 24% proficiency, ranked #308 of 324 in MO (top 95%) — low school quality limits family demand, transient renter base, plan for 1-2y turnover; 75% free/reduced lunch — lower-income household profile, screen leases tightly.
- Zoned schools: Rogers Elementary (math 8% / reading 16%, grade F, #1,016 of 1,115 statewide, top 92%, 543 students, 99% FRL); Northeast Middle School (math 4% / reading 9%, grade F, #384 of 391 statewide, top 98%, 555 students, 100% FRL); East High School (math 0% / reading 13%, grade F, #516 of 521 statewide, top 99%, 1,112 students, 100% FRL) — zoned schools average 100% FRL vs 75% district-wide (25 pts higher); higher-poverty schools than district average — tighter screening recommended.
- Market conditions: 12 active listings in the ZIP; 6 comparable units currently listed for rent nearby; rentals at typical pace (median 18d on market — plan ~3-4 weeks tenant-placement turnaround); 4,002 units permitted in Jackson County in 2024 (2,271 in 5+ unit buildings).
Forward outlook
- In year one you build about $11k of equity ($726 loan paydown + $10k appreciation (10.0% local appreciation)).
- Jackson County population projected at +4% by 2050 — modest demand growth; plan on rents tracking national, not racing it.
- At projected returns (10.0% appreciation + 3.0% rent growth), your $29k cash investment doubles in ~2 years — after that, you're playing with house money.
- By year 4, paydown + projected appreciation supports a ~$40k cash-out refi (75% LTV) — recoverable capital for the next deal without selling this one.
Negotiation context
- Only 11 days on market — expect competitive offers; lowballing is unlikely to land.
- 2 sale attempts since 3y ago with the ask held roughly flat each time — persistent listings suggest the price (not the market) is what's stuck; bring a comps-based counter.
Risks & watch-outs
- Watch-outs: built in 1920 — expect roof / HVAC / electrical / plumbing capex.
Questions for the listing agent
- Built in 1920 — when were the roof, HVAC, electrical panel, plumbing, and water heater last replaced?
- Is there a deadline driving the sale (1031 exchange, divorce, estate, relocation)? That informs how much negotiation room exists.
- Crime grade is F in this area — have there been break-ins, vandalism, or insurance claims at this property in the last 3 years? What carrier currently insures it and at what premium?
- What's the average days-on-market for RENTAL listings here right now (not sales)? A rising rental-DOM trend means longer vacancies and softer asking-rent achievability than the comps imply.
- What's the recent tenant-quality profile in this submarket — average credit score on applications, eviction rate, late-payment / NSF rate, and stable-employment percentage? A property-management company in the area should have these aggregated.
- How much new for-sale + rental construction is in the pipeline within 1–3 miles? Heavy new supply typically softens prices + rents 12–24 months out; constrained supply supports both.
Investment metrics
- 1% rule
- 1.13% ✓
- Cap rate
- 9.83%
- Cash-on-cash
- 12.62%
- DSCR
- 1.56
- GRM
- 7.4
CMA / ARV
- ARV (on-the-fly)
- $103,896
- Comps found
- 12
Show comp detail 12 sales within ~0.75 mi
| Address | Dist | Beds/Ba | Sqft | Sold | Price | $/sf | Match |
|---|---|---|---|---|---|---|---|
| 5209 E 6th St | 0.53mi | 3/1.0 | 952 (+2%) | 0mo | $179,900 | $189 | 72 |
| 807 Beacon Ave | 0.15mi | 2/1.0 (-1) | 872 (-7%) | 7mo | $140,000 | $161 | 71 |
| 515 Oakley Ave | 0.42mi | 2/1.0 (-1) | 909 (-3%) | 4mo | $90,000 | $99 | 68 |
| 423 Hardesty Ave | 0.58mi | 3/1.0 | 936 (0%) | 7mo | $34,900 | $37 | 67 |
| 1120 Oakley Ave | 0.42mi | 2/1.0 (-1) | 900 (-4%) | 4mo | $125,000 | $139 | 66 |
| 436 Lawndale Ave | 0.45mi | 2/1.0 (-1) | 878 (-6%) | 2mo | $85,000 | $97 | 62 |
| 1220 Topping Ave | 0.41mi | 2/1.5 (-1) | 900 (-4%) | 8mo | $80,900 | $90 | 61 |
| 5229 E 8th St | 0.47mi | 3/1.0 | 1,056 (+13%) | 10mo | $79,000 | $75 | 48 |
| 318 Barat Ave | 0.53mi | 2/1.0 (-1) | 805 (-14%) | 1mo | $89,500 | $111 | 46 |
| 6228 E 15 Ter | 0.63mi | 2/2.0 (-1) | 1,047 (+12%) | 1mo | $89,000 | $85 | 41 |
| 317 Topping Ave | 0.55mi | 3/2.0 | 1,064 (+14%) | 8mo | $174,900 | $164 | 41 |
| 323 Lawndale Ave | 0.58mi | 2/1.0 (-1) | 1,053 (+12%) | 11mo | $125,000 | $119 | 38 |
Match score weights: distance 35% · size 25% · config 20% · recency 20%. Top-matched comps best support the ARV.
Projected returns pro-forma
10.0% appreciation · 3.0% rent growth · sell at horizon
- IRR
- 33.5%
- Equity multiple
- 3.61×
- Total profit
- $76,830
- Equity at exit
- $94,592
- IRR
- 28.9%
- Equity multiple
- 8.17×
- Total profit
- $210,693
- Equity at exit
- $203,992
Cash invested: $29,400 (down + closing). Projections, not guarantees.
Landlord ↔ Tenant lean methodology
- Overall (STATE)
- 81 Strongly Landlord-Friendly
- State Missouri
- 81 Strongly Landlord-Friendly · R+10
- County
- — inherits STATE
- City
- — inherits STATE
ZIP-level market 64125
- Home prices YoY
- 3.1%
- Active inventory
- 12
- Price-to-rent
- 7.4×
Monthly cashflow live
- Estimated rent
- $1,190 high interval (Pro) →
- Mortgage (P&I)
- −$551
- Tax from tax record
- −$36 /mo · $437/yr
- Insurance
- −$44
- HOA
- −$0
- Vacancy / Maint / Mgmt
- −$250
- Net cashflow
- $309
Break-even live
Sensitivity live
| Price | -10% $369 | -5% $339 | +0% $309 | +5% $279 | +10% $250 |
|---|---|---|---|---|---|
| Rent | -10% $215 | -5% $262 | +0% $309 | +5% $356 | +10% $403 |
| Rate | -1.0pp $362 | -0.5pp $336 | base $309 | +0.5pp $282 | +1.0pp $254 |
UW: 25.0% down · 7.5% · 30yr · 1.5% tax · 5.0% vac · 8.0% maint · 8.0% mgmt
Financing live
Cash to close
- Down payment
- $26,250
- Closing costs
- $3,150
- Reserves months
- —
- Total cash needed
- —
Loan-product check · same deal, 3 products live
Conventional
25% down · 7.5% · 30yr
- Down + closing
- —
- Monthly P&I
- —
- Monthly cashflow
- —
- DSCR
- —
- Eligible?
- —
Personal DTI + credit; lowest rate.
DSCR
20% down · 8.5% · 30yr
- Down + closing
- —
- Monthly P&I
- —
- Monthly cashflow
- —
- DSCR
- —
- Eligible?
- —
No personal income docs; deal must DSCR.
Hard money
10% down · 12.0% · 12mo
- Down + closing
- —
- Monthly P&I
- —
- Monthly cashflow
- —
- DSCR
- —
- Eligible?
- —
Short-term bridge; refi at stabilization.
Rent comps 6 comps
| Address | Beds | Baths | Sqft | Rent | $/sqft | DOM | Units | Dist |
|---|---|---|---|---|---|---|---|---|
| 6011 E 11th St Kansas City, MO | 3.0 | 1.0 | 900 | $1,200 | $1.33 | 18d | 1 | 0.20mi |
| 303 White Ave Unit 2 Kansas City, MO | 2.0 | 1.0 | 1060 | $950 | $0.90 | 12d | 1 | 0.56mi |
| 135 Lawndale Ave Kansas City, MO | 3.0 | 2.0 | 920 | $1,500 | $1.63 | 9d | 1 | 0.66mi |
| 445 N Lawndale Ave Kansas City, MO | 2.0 | 1.0 | 700 | $1,200 | $1.71 | 25d | 1 | 1.09mi |
| 1603 Elmwood Ave Kansas City, MO | 2.0 | 1.0 | 1064 | $1,031 | $0.97 | 14d | 1 | 1.16mi |
| 1904 Elmwood Ave Kansas City, MO | 4.0 | 2.0 | 864 | $1,152 | $1.33 | 45d | 1 | 1.37mi |
Listing history 9 events
-
2026-06-09days on market $105,000 Active 11 DOM
-
2026-06-08days on market $105,000 Active 10 DOM
-
2026-06-07days on market $105,000 Active 9 DOM
-
2026-06-05remarks 472-char remark
-
2026-06-05days on market $105,000 Active 6 DOM
-
2026-06-03days on market $105,000 Active 5 DOM
-
2026-06-02days on market $105,000 Active 4 DOM
-
2026-06-01days on market $105,000 Active 3 DOM
-
2026-05-31days on market $105,000 Active 2 DOM
ⓘ Source: listings_history table (triggers on properties + properties_extension) + one-shot
backfill from property_details.listing_events for pre-trigger history.
Tax reassessment forecast MO · Resets to sale price
- Current annual tax
- $437 · $36/mo
- Projected year-2 tax
- $1,018 · $85/mo
- Expected delta
- +$581/yr (+$48/mo · 133.0%)
ⓘ Screening estimate from a state-policy table — verify with the county assessor before closing.
Climate risk First Street
- Flood 1/10 Low FEMA zone X (unshaded) · 0% chance over 30 yrs
- Wildfire 1/10 Low
- Heat 4/10 Moderate 7 d/yr ≥106°F today · 17 d/yr by 30 yrs out
- Wind 2/10 Low
- Air quality 3/10 Moderate 2 unhealthy d/yr today · 3 by 30 yrs out
Nearby sold comps map
Loading sold comps map…
Walkable amenities ~0.75 mi
Loading nearby amenities…
Taxation est. · year 1
- Rental income
- $14,277
- − Mortgage interest
- −$5,882
- − Property taxes
- −$437
- − Insurance
- −$525
- − Repairs & maintenance
- −$1,142
- − Management
- −$1,142
- − Depreciation
- −$3,055
- Taxable income
- $2,094
- Est. tax owed @ 24.0%
- −$503
- After-tax cash flow
- $3,206/yr
For passive investors: Depreciation is non-cash, so a rental often shows a tax loss while cash-flowing — sheltering income. Rental losses are passive: they offset passive income freely, and up to $25,000/yr can offset ordinary (W-2) income if you actively participate and your MAGI is under $100k (phasing out to $0 by $150k); unused losses carry forward. On sale, claimed depreciation is recaptured at up to 25%, and gains may owe capital-gains tax (a 1031 exchange can defer both). Figures are a year-1 estimate at your 24.0% rate — not tax advice; consult a CPA.
Schools (NCES district)
- District
- Kansas City 33
- NCES district ID
- 2916400
- Math proficiency
- 12% ▼ -8.00%
- Reading proficiency
- 24% ▬ 0.00%
- Median HH income
- $35,227
- Composite
- 14.8/100
- National rank
- #9387
- State rank
- #308 of 324 in MO
Livability — Kansas City
- Score
- 78/100
- State rank
- #28
- US rank
- #2671
Category grades
Schools grade is shown separately in the Schools card above.
Census & demographics
- Census place
- Kansas City, MO
- City population
- 439,467
- Population (ZIP)
- 2,723
Population outlook (Jackson County) Hauer SSP2
- Today (2025)
- 719,589 people
- By 2030
- 731,456 · +1.6%
- By 2040
- 746,689 · +3.8%
- By 2050
- 749,289 · +4.1%
- By 2075
- 736,227 · +2.3%
- By 2100
- 668,210 · -7.1%
Race, ethnicity, and origin ACS 2023
- Neighborhood character
- Majority Hispanic (61%)
- Race & ethnicity
- Hispanic / Latino 61% White 26% Black 10% Two or more races 7%
- Hispanic origin (detail)
- Mexican 50% Puerto Rican 1%
- Common ancestry
- Serbian 1% Slovak 1%
- Foreign-born
- 15% · Canada, South Korea
- Languages at home
- 52% English-only · Spanish 48%
Political lean MEDSL · Jackson
- 2024 margin
- D (+19.3) · D 58.9% · R 39.5% · Other 1.6%
- 2008→2024 swing
- -6.1pp toward R · 2008: 25.4pp · 2024: 19.3pp
- All cycles
- 2024: D+19.3 2020: D+22.0 2016: D+16.6 2012: D+19.0 2008: D+25.4
Not yet ingested
- Civics
- —
Market trends
- HPI YoY
- ▲ 14.18%
- Current HPI
- 471.552
- Rent YoY
- —
- Metro
- —
- State GDP YoY
- ▲ 1.84%
- F500 in state
- 20
Industry mix (Fortune 500 HQ in MO)
| Industry | F500 HQs | Revenue |
|---|---|---|
| Healthcare | 1 | $163B |
|
||
| Insurance | 1 | $21B |
|
||
| Industrial Technology | 1 | $17B |
|
||
| Retail | 1 | $16B |
|
||
| Industrial Distribution | 1 | $10B |
|
||
| Utilities | 1 | $9B |
|
||
Price history
-12.4% since first listed9 events — show timeline
- 2026-05-29 Listed $105,000 Heartland MLS as Distributed by MLS Grid
- 2023-09-15 Sold (MLS) — Heartland MLS as Distributed by MLS Grid
- 2023-08-14 Contingent — Heartland MLS as Distributed by MLS Grid
- 2023-07-25 Price Changed $114,900 Heartland MLS as Distributed by MLS Grid
- 2023-07-15 Listed $119,900 Heartland MLS as Distributed by MLS Grid
- 2021-09-22 Sold (Public Records) — Public Records
- 2019-08-19 Sold (Public Records) — Public Records
- 2019-06-19 Sold (Public Records) — Public Records
- 1986-01-27 Sold (Public Records) — Public Records
Property tax history
+3.7%/yrLatest (2025): $437 · +22.2% YoY. Source: county tax records.
Cash-flow waterfall
monthlySold comps — $/sqft
last 12 mo · ≤1 miLoading sold comps…