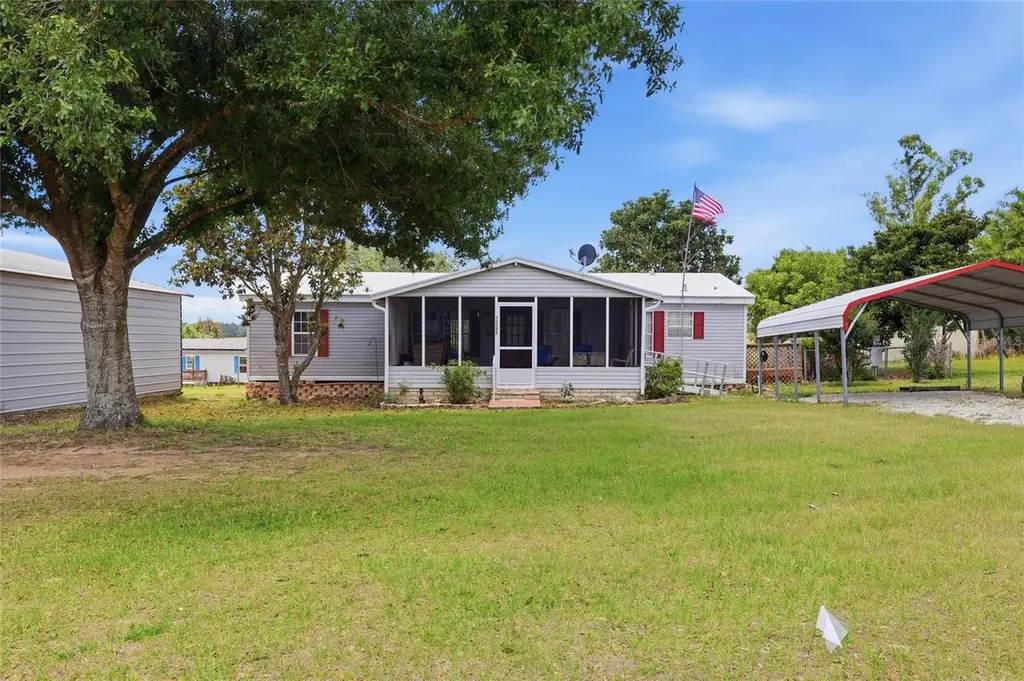
14647 Billie Ln · Dade City, FL
Flood risk 1/10 · Minimal
- FEMA flood zone
- X (unshaded)
- Chance of flooding over 30 yrs
- 0.0%
- Est. flood insurance / yr
- $507 – $1,088
Fire risk 5/10 · Moderate
- Est. fire insurance / yr
- $947 – $1,759
Heat risk 9/10 · Severe
- Hot days now (above 108°F)
- 7 days/yr
- Hot days in 30 yrs
- 25 days/yr
Wind risk 9/10 · Severe
- Chance of severe wind over 30 yrs
- 99.0%
Air-quality risk 1/10 · Minimal
- Unhealthy air days now
- 0 days/yr
- Unhealthy air days in 30 yrs
- 0 days/yr
Risk factors via First Street. Map © Google.
Why this score? — see what drove the C- grade
The composite is a weighted blend of 9 inputs, each scored 0–100. Each bar is that input's sub-score; the figure is the points it added to the 100-point composite (weight × sub-score).
- Cash flow +21.5/30.0
- ARV discount +7.5/15.0
- DSCR +6.8/10.0
- 1% rule +4.4/10.0
- Schools +4.3/10.0
- Livability +3.7/5.0
- Rent growth +3.3/5.0
- Condition / age +2.5/5.0
- Appreciation +0.0/10.0
$215,000
🖨 Deal sheet (PDF) 📄 Offer letter ✓ Due diligence
Listing remarks MLS
DADE CITY - 3 BEDROOM/2 BATH WITH OVER ALMOST 1300SQFT OF LIVING AREA ON LARGE LOT. CASH ONLY.
Key facts
- Refreshed interior
- New flooring
- New water heater
Tags
Property features AI
Finance
- Other: Approximately 0.85 acre lot (about 1/2 to less than 1 acre)
- Financial info: No lease restrictions
- HOA & community: No association
Exterior
- Parking: Oversized carport; 2-car carport spaces
- Utilities: Private water supply; Septic tank; Electricity connected; Water connected
- Home design: Manufactured double-wide home; Single-story (one level); Facing north; Residential property
- Construction: Vinyl siding; Membrane/metal/other roof; Crawlspace foundation; Built as a manufactured home
- Exterior features: Covered front and rear porches; Screened porch; Porch; Outdoor storage and shed(s); Storage building(s); Cleared, oversized lot; Paved road access
Interior
- Kitchen: Range; Dishwasher; Electric water heater
- Bedrooms: 3 bedrooms
- Flooring: Vinyl; Other flooring
- Bathrooms: 2 full bathrooms
- Heating & cooling: Central heating; Central air conditioning
- Interior features: Split bedroom floorplan; 5 total rooms
- Laundry & utility: Washer; Dryer; Laundry inside
Neighborhood map
What this means for you Summary
Snapshot
- This is a 3-bed/2.0-bath manufactured listed at $215k.
Deal economics
- At list price, monthly cash flow is $321 ($4k/yr) — positive.
- The deal already cash-flows at list — no discount required.
- To meet the 1% rule (rent ≥ 1% of price), the offer needs to be $201k (6.3% below list).
- Recommended offer: $201k (6.3% below list) — sets the bar for 1% rule.
- Cap rate 8.1% vs local median 4.6% in Dade City — top-decile yield for the area; either an underpriced asset or a hidden risk that comps aren't pricing in. Stress-test before assuming the spread holds.
Location & tenants
- Location reads 73/100 on livability (#307 in FL) — a middle-class / working-renter tenant base. Strengths: cost of living A+, housing A+, health & safety A+; Watch: employment C-, amenities F, commute F.
- Pasco (suburban): math 50% / reading 52% proficiency, ranked #32 of 73 in FL (top 44%) — acceptable for families but not a draw, mixed tenant base, ~2y average lease.
- Zoned schools: Pasco Elementary School (math 29% / reading 30%, grade F, #1,896 of 2,144 statewide, top 90%, 586 students, 89% FRL); Centennial Middle School (math 39% / reading 41%, grade F, #368 of 571 statewide, top 65%, 648 students, 72% FRL); Pasco High School (math 40% / reading 40%, grade F, #296 of 667 statewide, top 45%, 1,639 students, 66% FRL) — zoned schools average 75% FRL vs 48% district-wide (27 pts higher); higher-poverty schools than district average — tighter screening recommended.
- Zoned-school proficiency averages 36% at this address vs 51% district-wide (-14 pts) — the specific schools serving this property underperform the Pasco average; the district grade overstates school quality for this exact location.
- Market conditions: Rents rising (+3.0%/yr); 674 active listings in the ZIP; 6,765 units permitted in Pasco County in 2024 (1,250 in 5+ unit buildings).
- This rent runs 35% of the median local income ($69k/yr) — at the standard rent-burdened threshold; future hikes will face affordability resistance.
Forward outlook
- Local home prices are declining (-3.0%/yr); year-one equity from $1k of loan paydown is wiped out by about $6k of value loss. Plan a longer hold.
- Pasco County population projected at +29% by 2050 — long-run rental-demand tailwind backs the buy-and-hold thesis.
Negotiation context
- Only 10 days on market — expect competitive offers; lowballing is unlikely to land.
- 2 sale attempts since 16y ago with the ask held roughly flat each time — persistent listings suggest the price (not the market) is what's stuck; bring a comps-based counter.
- Current owner paid $32k; list at $215k implies a 572% gain — meaningful room to come down on a strong offer.
Risks & watch-outs
- Climate carrying-cost: severe wind risk, 99% chance of damaging wind over 30y; moderate wildfire risk; extreme-heat days projected 7→25/yr by 2055 (HVAC capex compounding) — expect insurance premiums to compound above CPI over the hold.
Questions for the listing agent
- Is there a deadline driving the sale (1031 exchange, divorce, estate, relocation)? That informs how much negotiation room exists.
- Schools are D-rated, which usually means shorter tenancies and higher turnover. Who's the typical renter profile here, and what's been the actual vacancy rate?
- What's the average days-on-market for RENTAL listings here right now (not sales)? A rising rental-DOM trend means longer vacancies and softer asking-rent achievability than the comps imply.
- What's the recent tenant-quality profile in this submarket — average credit score on applications, eviction rate, late-payment / NSF rate, and stable-employment percentage? A property-management company in the area should have these aggregated.
- How much new for-sale + rental construction is in the pipeline within 1–3 miles? Heavy new supply typically softens prices + rents 12–24 months out; constrained supply supports both.
Investment metrics
- 1% rule
- 0.94% ✗
- Cap rate
- 8.09%
- Cash-on-cash
- 6.40%
- DSCR
- 1.28
- GRM
- 8.9
CMA / ARV
No comps found within radius.
Projected returns pro-forma
-3.0% appreciation · 3.02% rent growth · sell at horizon
- IRR
- -6.5%
- Equity multiple
- 0.76×
- Total profit
- $-14,437
- Equity at exit
- $32,057
- IRR
- 3.1%
- Equity multiple
- 1.22×
- Total profit
- $13,531
- Equity at exit
- $18,589
Cash invested: $60,200 (down + closing). Projections, not guarantees.
Landlord ↔ Tenant lean methodology
- Overall (STATE)
- 87 Strongly Landlord-Friendly
- State Florida
- 87 Strongly Landlord-Friendly · R+3
- County
- — inherits STATE
- City
- — inherits STATE
ZIP-level market 33525
- Home prices YoY
- -15.4%
- Rents YoY
- 3.0%
- Active inventory
- 674
- Price-to-rent
- 8.9×
Monthly cashflow live
- Estimated rent
- $2,014 medium interval (Pro) →
- Mortgage (P&I)
- −$1,127
- Tax from tax record
- −$53 /mo · $637/yr
- Insurance
- −$90
- HOA
- −$0
- Vacancy / Maint / Mgmt
- −$423
- Net cashflow
- $321
Break-even live
Sensitivity live
| Price | -10% $443 | -5% $382 | +0% $321 | +5% $260 | +10% $200 |
|---|---|---|---|---|---|
| Rent | -10% $162 | -5% $242 | +0% $321 | +5% $401 | +10% $480 |
| Rate | -1.0pp $430 | -0.5pp $376 | base $321 | +0.5pp $266 | +1.0pp $209 |
UW: 25.0% down · 7.5% · 30yr · 1.5% tax · 5.0% vac · 8.0% maint · 8.0% mgmt
Financing live
Cash to close
- Down payment
- $53,750
- Closing costs
- $6,450
- Reserves months
- —
- Total cash needed
- —
Loan-product check · same deal, 3 products live
Conventional
25% down · 7.5% · 30yr
- Down + closing
- —
- Monthly P&I
- —
- Monthly cashflow
- —
- DSCR
- —
- Eligible?
- —
Personal DTI + credit; lowest rate.
DSCR
20% down · 8.5% · 30yr
- Down + closing
- —
- Monthly P&I
- —
- Monthly cashflow
- —
- DSCR
- —
- Eligible?
- —
No personal income docs; deal must DSCR.
Hard money
10% down · 12.0% · 12mo
- Down + closing
- —
- Monthly P&I
- —
- Monthly cashflow
- —
- DSCR
- —
- Eligible?
- —
Short-term bridge; refi at stabilization.
Listing history 4 events
-
2026-05-11status Pending
-
2026-05-01$215,000 Active
-
2011-03-07soldstatus $32,000 94-char remark
Show marketing remark (94 chars)
DADE CITY - 3 BEDROOM/2 BATH WITH OVER ALMOST 1300SQFT OF LIVING AREA ON LARGE LOT. CASH ONLY.
-
2010-10-14$34,000 94-char remark
Show marketing remark (94 chars)
DADE CITY - 3 BEDROOM/2 BATH WITH OVER ALMOST 1300SQFT OF LIVING AREA ON LARGE LOT. CASH ONLY.
ⓘ Source: listings_history table (triggers on properties + properties_extension) + one-shot
backfill from property_details.listing_events for pre-trigger history.
Tax reassessment forecast FL · Resets to sale price
- Current annual tax
- $637 · $53/mo
- Projected year-2 tax
- $1,784 · $149/mo
- Expected delta
- +$1,148/yr (+$96/mo · 180.1%)
ⓘ Screening estimate from a state-policy table — verify with the county assessor before closing.
Climate risk First Street
- Flood 1/10 Low FEMA zone X (unshaded) · 0% chance over 30 yrs
- Wildfire 5/10 Major
- Heat 9/10 Extreme 7 d/yr ≥108°F today · 25 d/yr by 30 yrs out
- Wind 9/10 Extreme 99% chance of damaging wind over 30 yrs
- Air quality 1/10 Low 0 unhealthy d/yr today · 0 by 30 yrs out
Nearby sold comps map
Loading sold comps map…
Walkable amenities ~0.75 mi
Loading nearby amenities…
Taxation est. · year 1
- Rental income
- $24,174
- − Mortgage interest
- −$12,043
- − Property taxes
- −$637
- − Insurance
- −$1,075
- − Repairs & maintenance
- −$1,934
- − Management
- −$1,934
- − Depreciation
- −$6,255
- Taxable income
- $296
- Est. tax owed @ 24.0%
- −$71
- After-tax cash flow
- $3,785/yr
For passive investors: Depreciation is non-cash, so a rental often shows a tax loss while cash-flowing — sheltering income. Rental losses are passive: they offset passive income freely, and up to $25,000/yr can offset ordinary (W-2) income if you actively participate and your MAGI is under $100k (phasing out to $0 by $150k); unused losses carry forward. On sale, claimed depreciation is recaptured at up to 25%, and gains may owe capital-gains tax (a 1031 exchange can defer both). Figures are a year-1 estimate at your 24.0% rate — not tax advice; consult a CPA.
Schools (NCES district)
- District
- Pasco
- NCES district ID
- 1201530
- Math proficiency
- 50% ▼ -10.00%
- Reading proficiency
- 52% ▼ -5.00%
- Median HH income
- $45,039
- Composite
- 43.14/100
- National rank
- #3074
- State rank
- #32 of 73 in FL
Livability — Dade City
- Score
- 73/100
- State rank
- #307
- US rank
- #5215
Category grades
Schools grade is shown separately in the Schools card above.
Census & demographics
- County
- Pasco County · 524,098 people
- City population
- 21,077
- Metro
- Tampa-St. Petersburg-Clearwater, FL
- Population (ZIP)
- 21,077
- Household income
- $69,068
- Rent vs Own
- Severe rent burden
- 322.0
Population outlook (Pasco County) Hauer SSP2
- Today (2025)
- 570,045 people
- By 2030
- 605,844 · +6.3%
- By 2040
- 674,806 · +18.4%
- By 2050
- 736,022 · +29.1%
- By 2075
- 862,900 · +51.4%
- By 2100
- 906,364 · +59.0%
Race, ethnicity, and origin ACS 2023
- Neighborhood character
- Predominantly White (76%)
- Race & ethnicity
- White 76% Hispanic / Latino 16% Two or more races 7% Black 3%
- Hispanic origin (detail)
- Mexican 9% Puerto Rican 3%
- Common ancestry
- Lithuanian 2% Romanian 2% Serbian 2%
- Foreign-born
- 6% · Canada, Jamaica
- Languages at home
- 87% English-only · Spanish 11% Other Asian/Pacific 1% Other Indo-European 1%
Political lean MEDSL · Pasco
- 2024 margin
- Strong R (+25.2) · D 36.9% · R 62.1% · Other 1.0%
- 2008→2024 swing
- -21.6pp toward R · 2008: -3.6pp · 2024: -25.2pp
- All cycles
- 2024: R+25.2 2020: R+20.1 2016: R+21.6 2012: R+6.7 2008: R+3.6
Not yet ingested
- Civics
- —
Market trends
- HPI YoY
- ▼ -65.48%
- Current HPI
- 358.2149
- Rent YoY
- ▲ 3.02%
- Metro
- Tampa-St. Petersburg-Clearwater, FL
- State GDP YoY
- ▲ 3.28%
- F500 in state
- 36
Industry mix (Fortune 500 HQ in FL)
| Industry | F500 HQs | Revenue |
|---|---|---|
| Industrial Technology | 2 | $29B |
|
||
| Insurance | 2 | $17B |
|
||
| Retail | 1 | $60B |
|
||
| Technology Distribution | 1 | $58B |
|
||
| Homebuilding | 1 | $35B |
|
||
| Technology Manufacturing | 1 | $35B |
|
||
Price history
+532.4% since first listed4 events — show timeline
- 2026-05-11 Pending — Stellar MLS as Distributed by MLS Grid
- 2026-05-01 Listed $215,000 Stellar MLS as Distributed by MLS Grid
- 2011-03-07 Sold (MLS) $32,000 Stellar MLS as Distributed by MLS Grid
- 2010-10-14 Listed $34,000 Stellar MLS as Distributed by MLS Grid
Property tax history
-1.7%/yrLatest (2025): $637 · +2.4% YoY. Source: county tax records.
Cash-flow waterfall
monthlySold comps — $/sqft
last 12 mo · ≤1 miLoading sold comps…