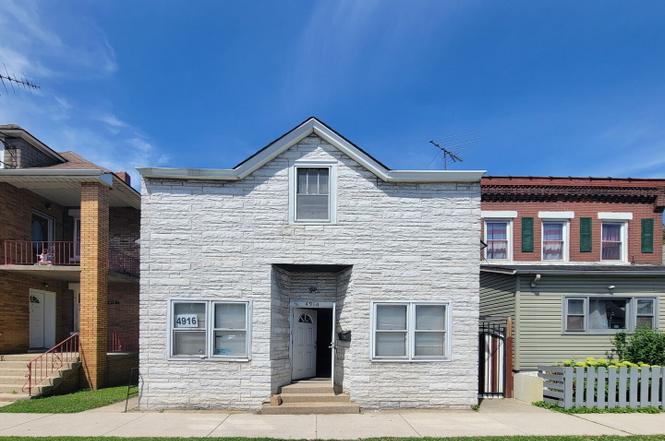
4916 Northcote Ave · East Chicago, IN
Flood risk 4/10 · Minor
- FEMA flood zone
- X (unshaded)
- Chance of flooding over 30 yrs
- 0.2%
- Est. flood insurance / yr
- $507 – $1,088
Fire risk 1/10 · Minimal
- Est. fire insurance / yr
- $717 – $1,331
Heat risk 3/10 · Minor
- Hot days now (above 101°F)
- 7 days/yr
- Hot days in 30 yrs
- 15 days/yr
Wind risk 2/10 · Minimal
- Chance of severe wind over 30 yrs
- 1.0%
Air-quality risk 4/10 · Minor
- Unhealthy air days now
- 5 days/yr
- Unhealthy air days in 30 yrs
- 6 days/yr
Risk factors via First Street. Map © Google.
Why this score? — see what drove the B grade
The composite is a weighted blend of 9 inputs, each scored 0–100. Each bar is that input's sub-score; the figure is the points it added to the 100-point composite (weight × sub-score).
- Cash flow +25.6/30.0
- ARV discount +15.0/15.0
- DSCR +8.5/10.0
- 1% rule +5.8/10.0
- Appreciation +4.8/10.0
- Rent growth +4.5/5.0
- Livability +3.2/5.0
- Condition / age +2.5/5.0
- Schools +0.8/10.0
$139,900
🖨 Deal sheet (PDF) 📄 Offer letter ✓ Due diligence
Listing remarks
This East Chicago property offers a solid layout with strong potential for a buyer ready to add personal touches and updates. The home features comfortable living space, functional room flow, and an opportunity to build value over time. Cosmetic improvements may be desired, allowing the next owner to customize finishes to their preference. The property is eligible for FHA financing and may qualify for local down payment assistance programs for eligible buyers. A great option for buyers seeking affordability, flexible financing options, and the chance to create equity. Schedule your showing today to explore the possibilities this home has to offer.
Key facts
- 3,484 sq ft lot
- 2 garage spots
- Built 1906
Property features AI
Exterior
- Parking: On-street parking; 2-car garage
- Utilities: Public water; Public sewer; 100 Amp electric service
- Home design: Two-story property; Built in 1906
- Construction: Year built: 1906
- Exterior features: Neighborhood view; Public lot size recorded by assessor
Interior
- Kitchen: Range; Refrigerator
- Bedrooms: Multiple bedrooms including a primary bedroom (total rooms: 8)
- Bathrooms: One three-quarter bathroom
- Heating & cooling: Forced air heating (natural gas); Central air conditioning
- Interior features: Eat-in kitchen; Walk-in closets; Pantry; Full unfinished walk-out basement
- Laundry & utility: Basement utility area
Neighborhood map
What this means for you Summary
Snapshot
- This is a 4-bed/1.0-bath single-family listed at $140k.
Deal economics
- At list price, monthly cash flow is $331 ($4k/yr) — positive.
- The deal already cash-flows at list — no discount required.
- Meets the 1% rule at list price ($2k rent vs $140k).
Location & tenants
- Location reads 64/100 on livability (#371 in IN) — a middle-class / working-renter tenant base. Strengths: commute A+, cost of living A+, housing A; Watch: health & safety D+, crime F, amenities F.
- School City Of East Chicago (suburban): math 7% / reading 15% proficiency, ranked #293 of 301 in IN (top 97%) — low school quality limits family demand, transient renter base, plan for 1-2y turnover; 89% free/reduced lunch — lower-income household profile, screen leases tightly.
- Zoned schools: William Mckinley Elementary School (math 8% / reading 9%, grade F, #939 of 994 statewide, top 95%, 488 students, 80% FRL); Joseph Block Middle School (math 3% / reading 13%, grade F, #317 of 330 statewide, top 96%, 487 students, 82% FRL); East Chicago Central High School (math 23% / reading 56%, grade F, #221 of 369 statewide, top 63%, 1,079 students, 77% FRL).
- Market conditions: Rents rising fast (+8.1%/yr); 79 active listings in the ZIP; 1 comparable units currently listed for rent nearby; lower-income renter base — watch delinquency; 1,642 units permitted in Lake County in 2024 (14 in 5+ unit buildings).
- This rent runs 43% of the median local income ($42k/yr) — at the standard rent-burdened threshold; future hikes will face affordability resistance.
Forward outlook
- In year one you build about $542 of equity ($967 loan paydown + $-425 appreciation (-0.3% local appreciation)).
- Lake County population projected to shrink 7% by 2050 — rents likely to lag national; underwrite the cash flow, not the appreciation.
- At projected returns (-0.3% appreciation + 8.0% rent growth), your $39k cash investment doubles in ~6 years — after that, you're playing with house money.
Negotiation context
- Only 6 days on market — expect competitive offers; lowballing is unlikely to land.
- 7 sale attempts since 8y ago with the ask held roughly flat each time — persistent listings suggest the price (not the market) is what's stuck; bring a comps-based counter.
- Current owner paid $80k; list at $140k implies a 75% gain — meaningful room to come down on a strong offer.
Risks & watch-outs
- Watch-outs: built in 1906 — expect roof / HVAC / electrical / plumbing capex.
Questions for the listing agent
- Built in 1906 — when were the roof, HVAC, electrical panel, plumbing, and water heater last replaced?
- Is there a deadline driving the sale (1031 exchange, divorce, estate, relocation)? That informs how much negotiation room exists.
- Schools are F-rated, which usually means shorter tenancies and higher turnover. Who's the typical renter profile here, and what's been the actual vacancy rate?
- Crime grade is F in this area — have there been break-ins, vandalism, or insurance claims at this property in the last 3 years? What carrier currently insures it and at what premium?
- What's the average days-on-market for RENTAL listings here right now (not sales)? A rising rental-DOM trend means longer vacancies and softer asking-rent achievability than the comps imply.
- What's the recent tenant-quality profile in this submarket — average credit score on applications, eviction rate, late-payment / NSF rate, and stable-employment percentage? A property-management company in the area should have these aggregated.
- How much new for-sale + rental construction is in the pipeline within 1–3 miles? Heavy new supply typically softens prices + rents 12–24 months out; constrained supply supports both.
Investment metrics
- 1% rule
- 1.08% ✓
- Cap rate
- 9.14%
- Cash-on-cash
- 10.15%
- DSCR
- 1.45
- GRM
- 7.7
CMA / ARV
- ARV (on-the-fly)
- $191,406
- Comps found
- 10
Show comp detail 10 sales within ~0.75 mi
| Address | Dist | Beds/Ba | Sqft | Sold | Price | $/sf | Match |
|---|---|---|---|---|---|---|---|
| 4855 Walsh Ave | 0.20mi | 4/2.0 | 2,598 (-1%) | 14mo | $128,000 | $49 | 73 |
| 4847 Homerlee Ave | 0.09mi | 4/2.0 | 2,288 (-13%) | 2mo | $130,000 | $57 | 68 |
| 4848 Baring Ave | 0.11mi | 4/2.0 | 3,014 (+15%) | 1mo | $239,900 | $80 | 65 |
| 4928 Reading Ave | 0.16mi | 3/2.0 (-1) | 2,380 (-9%) | 12mo | $115,000 | $48 | 58 |
| 5015 Homerlee Ave | 0.13mi | 3/2.0 (-1) | 2,256 (-14%) | 7mo | $165,000 | $73 | 56 |
| 4909 Walsh Ave | 0.20mi | 4/2.0 | 2,348 (-10%) | 18mo | $219,000 | $93 | 54 |
| 4722 Tod Ave | 0.45mi | 4/2.0 | 2,300 (-12%) | 3mo | $210,000 | $91 | 52 |
| 5029 Wegg Ave | 0.19mi | 4/3.5 | 2,298 (-12%) | 19mo | $270,000 | $117 | 45 |
| 909 W 145th St | 0.54mi | 3/2.0 (-1) | 3,000 (+14%) | 9mo | $64,000 | $21 | 34 |
| 4821 Chestnut Ave | 0.52mi | 3/3.0 (-1) | 2,358 (-10%) | 19mo | $160,000 | $68 | 30 |
Match score weights: distance 35% · size 25% · config 20% · recency 20%. Top-matched comps best support the ARV.
Projected returns pro-forma
-0.3% appreciation · 8.0% rent growth · sell at horizon
- IRR
- 12.0%
- Equity multiple
- 1.59×
- Total profit
- $23,016
- Equity at exit
- $38,513
- IRR
- 20.3%
- Equity multiple
- 3.55×
- Total profit
- $99,710
- Equity at exit
- $44,642
Cash invested: $39,172 (down + closing). Projections, not guarantees.
Landlord ↔ Tenant lean methodology
- Overall (STATE)
- 90 Strongly Landlord-Friendly
- State Indiana
- 90 Strongly Landlord-Friendly · R+11
- County
- — inherits STATE
- City
- — inherits STATE
ZIP-level market 46312
- Home prices YoY
- -0.1%
- Rents YoY
- 8.1%
- Active inventory
- 79
- Price-to-rent
- 7.7×
Monthly cashflow live
- Estimated rent
- $1,517 medium interval (Pro) →
- Mortgage (P&I)
- −$734
- Tax from tax record
- −$75 /mo · $903/yr
- Insurance
- −$58
- HOA
- −$0
- Vacancy / Maint / Mgmt
- −$319
- Net cashflow
- $331
Break-even live
Sensitivity live
| Price | -10% $411 | -5% $371 | +0% $331 | +5% $292 | +10% $252 |
|---|---|---|---|---|---|
| Rent | -10% $212 | -5% $272 | +0% $331 | +5% $391 | +10% $451 |
| Rate | -1.0pp $402 | -0.5pp $367 | base $331 | +0.5pp $295 | +1.0pp $258 |
UW: 25.0% down · 7.5% · 30yr · 1.5% tax · 5.0% vac · 8.0% maint · 8.0% mgmt
Financing live
Cash to close
- Down payment
- $34,975
- Closing costs
- $4,197
- Reserves months
- —
- Total cash needed
- —
Loan-product check · same deal, 3 products live
Conventional
25% down · 7.5% · 30yr
- Down + closing
- —
- Monthly P&I
- —
- Monthly cashflow
- —
- DSCR
- —
- Eligible?
- —
Personal DTI + credit; lowest rate.
DSCR
20% down · 8.5% · 30yr
- Down + closing
- —
- Monthly P&I
- —
- Monthly cashflow
- —
- DSCR
- —
- Eligible?
- —
No personal income docs; deal must DSCR.
Hard money
10% down · 12.0% · 12mo
- Down + closing
- —
- Monthly P&I
- —
- Monthly cashflow
- —
- DSCR
- —
- Eligible?
- —
Short-term bridge; refi at stabilization.
Rent comps 1 comps
| Address | Beds | Baths | Sqft | Rent | $/sqft | DOM | Units | Dist |
|---|---|---|---|---|---|---|---|---|
| 4228 # E Unit Magoun Ave unit 2 East Chicago, IN | 5.0 | 2.5 | 1800 | $1,800 | $1.00 | 0d | 1 | 0.88mi |
Listing history 32 events
-
2026-06-21days on market $139,900 Active 6 DOM
-
2026-06-18days on market $139,900 Active 3 DOM
-
2026-06-17days on market $139,900 Active 2 DOM
-
2026-06-15pricedays on market $139,900 Active 1 DOM
-
2026-05-31days on market $134,900 Active 107 DOM
-
2026-05-11price $134,900
-
2026-03-09price $139,900
-
2026-02-13$144,900 Active
-
2026-01-27historical
-
2026-01-20price $145,000
-
2026-01-09price $149,900
-
2025-11-12price $150,000
-
2025-10-19price $153,000
-
2025-10-03price $154,000
-
2025-09-19price $155,000
-
2025-09-01price $156,900
-
2025-08-25price $157,000
-
2025-07-25$159,900 Active
-
2025-07-01historical
-
2025-04-21price $159,500
-
2024-12-23price $162,500
-
2024-12-03$164,900 Active
-
2024-12-01historical
-
2024-09-16price $165,000
-
2024-07-17$169,900 Active
-
2024-07-02historical
-
2024-05-31price $172,669
-
2024-04-17$175,000 Active
-
2019-04-22soldstatus $79,900
-
2019-01-07$79,900
-
2018-12-05historical
-
2018-10-26$84,900
ⓘ Source: listings_history table (triggers on properties + properties_extension) + one-shot
backfill from property_details.listing_events for pre-trigger history.
Tax reassessment forecast IN · Partial reset (capped growth)
- Current annual tax
- $903 · $75/mo
- Projected year-2 tax
- $1,046 · $87/mo
- Expected delta
- +$143/yr (+$12/mo · 15.8%)
ⓘ Screening estimate from a state-policy table — verify with the county assessor before closing.
Climate risk First Street
- Flood 4/10 Moderate FEMA zone X (unshaded) · 20% chance over 30 yrs
- Wildfire 1/10 Low
- Heat 3/10 Moderate 7 d/yr ≥101°F today · 15 d/yr by 30 yrs out
- Wind 2/10 Low 100% chance of damaging wind over 30 yrs
- Air quality 4/10 Moderate 5 unhealthy d/yr today · 6 by 30 yrs out
Nearby sold comps map
Loading sold comps map…
Walkable amenities ~0.75 mi
Loading nearby amenities…
Taxation est. · year 1
- Rental income
- $18,208
- − Mortgage interest
- −$7,837
- − Property taxes
- −$903
- − Insurance
- −$700
- − Repairs & maintenance
- −$1,457
- − Management
- −$1,457
- − Depreciation
- −$4,070
- Taxable income
- $1,785
- Est. tax owed @ 24.0%
- −$429
- After-tax cash flow
- $3,549/yr
For passive investors: Depreciation is non-cash, so a rental often shows a tax loss while cash-flowing — sheltering income. Rental losses are passive: they offset passive income freely, and up to $25,000/yr can offset ordinary (W-2) income if you actively participate and your MAGI is under $100k (phasing out to $0 by $150k); unused losses carry forward. On sale, claimed depreciation is recaptured at up to 25%, and gains may owe capital-gains tax (a 1031 exchange can defer both). Figures are a year-1 estimate at your 24.0% rate — not tax advice; consult a CPA.
Schools (NCES district)
- District
- School City Of East Chicago
- NCES district ID
- 1802880
- Math proficiency
- 7% ▼ -10.00%
- Reading proficiency
- 15% ▼ -7.00%
- Median HH income
- $28,423
- Composite
- 8.36/100
- National rank
- #9909
- State rank
- #293 of 301 in IN
Livability — East Chicago
- Score
- 64/100
- State rank
- #371
- US rank
- #13869
Category grades
Schools grade is shown separately in the Schools card above.
Census & demographics
- Census place
- East Chicago, IN
- County
- Lake County · 422,878 people
- City population
- 26,022
- Metro
- Chicago-Naperville-Elgin, IL-IN-WI
- Population (ZIP)
- 26,022
- Household income
- $42,125
- Rent vs Own
- Severe rent burden
- 1227.0
Population outlook (Lake County) Hauer SSP2
- Today (2025)
- 484,026 people
- By 2030
- 478,091 · -1.2%
- By 2040
- 462,974 · -4.3%
- By 2050
- 449,894 · -7.1%
- By 2075
- 436,169 · -9.9%
- By 2100
- 426,607 · -11.9%
Race, ethnicity, and origin ACS 2023
- Neighborhood character
- Majority Hispanic (56%)
- Race & ethnicity
- Hispanic / Latino 56% Black 36% Two or more races 11% White 7%
- Hispanic origin (detail)
- Mexican 45% Puerto Rican 6%
- Common ancestry
- Romanian 2%
- Foreign-born
- 16% · Canada
- Languages at home
- 59% English-only · Spanish 40%
Political lean MEDSL · Lake
- 2024 margin
- Lean D (+5.6) · D 52.1% · R 46.5% · Other 1.5%
- 2008→2024 swing
- -28.6pp toward R · 2008: 34.3pp · 2024: 5.6pp
- All cycles
- 2024: D+5.6 2020: D+15.1 2016: D+20.6 2012: D+31.0 2008: D+34.3
Not yet ingested
- Civics
- —
Market trends
- HPI YoY
- ▼ -0.30%
- Current HPI
- 267.9232
- Rent YoY
- ▲ 8.06%
- Metro
- Chicago-Naperville-Elgin, IL-IN-WI
- State GDP YoY
- ▲ 2.90%
- F500 in state
- 18
Industry mix (Fortune 500 HQ in IN)
| Industry | F500 HQs | Revenue |
|---|---|---|
| Industrial Machinery | 2 | $37B |
|
||
| Healthcare | 1 | $177B |
|
||
| Pharmaceuticals | 1 | $45B |
|
||
| Metals / Steel | 1 | $18B |
|
||
| Agriculture | 1 | $17B |
|
||
| Packaging | 1 | $12B |
|
||
Price history
+58.9% since first listed27 events — show timeline
- 2026-05-11 Price Changed $134,900 NIRA MLS as Distributed by MLS Grid
- 2026-03-09 Price Changed $139,900 NIRA MLS as Distributed by MLS Grid
- 2026-02-13 Listed $144,900 NIRA MLS as Distributed by MLS Grid
- 2026-01-27 Listing Removed — NIRA MLS as Distributed by MLS Grid
- 2026-01-20 Price Changed $145,000 NIRA MLS as Distributed by MLS Grid
- 2026-01-09 Price Changed $149,900 NIRA MLS as Distributed by MLS Grid
- 2025-11-12 Price Changed $150,000 NIRA MLS as Distributed by MLS Grid
- 2025-10-19 Price Changed $153,000 NIRA MLS as Distributed by MLS Grid
- 2025-10-03 Price Changed $154,000 NIRA MLS as Distributed by MLS Grid
- 2025-09-19 Price Changed $155,000 NIRA MLS as Distributed by MLS Grid
- 2025-09-01 Price Changed $156,900 NIRA MLS as Distributed by MLS Grid
- 2025-08-25 Price Changed $157,000 NIRA MLS as Distributed by MLS Grid
- 2025-07-25 Listed $159,900 NIRA MLS as Distributed by MLS Grid
- 2025-07-01 Listing Removed — NIRA MLS as Distributed by MLS Grid
- 2025-04-21 Price Changed $159,500 NIRA MLS as Distributed by MLS Grid
- 2024-12-23 Price Changed $162,500 NIRA MLS as Distributed by MLS Grid
- 2024-12-03 Listed $164,900 NIRA MLS as Distributed by MLS Grid
- 2024-12-01 Listing Removed — NIRA MLS as Distributed by MLS Grid
- 2024-09-16 Price Changed $165,000 NIRA MLS as Distributed by MLS Grid
- 2024-07-17 Listed $169,900 NIRA MLS as Distributed by MLS Grid
- 2024-07-02 Listing Removed — NIRA MLS as Distributed by MLS Grid
- 2024-05-31 Price Changed $172,669 NIRA MLS as Distributed by MLS Grid
- 2024-04-17 Listed $175,000 NIRA MLS as Distributed by MLS Grid
- 2019-04-22 Sold (MLS) $79,900 NIRA MLS as Distributed by MLS Grid
- 2019-01-07 Listed $79,900 NIRA MLS as Distributed by MLS Grid
- 2018-12-05 Listing Removed — NIRA MLS as Distributed by MLS Grid
- 2018-10-26 Listed $84,900 NIRA MLS as Distributed by MLS Grid
Property tax history
+7.3%/yrLatest (2024): $903 · +9.6% YoY. Source: county tax records.
Cash-flow waterfall
monthlySold comps — $/sqft
last 12 mo · ≤1 miLoading sold comps…