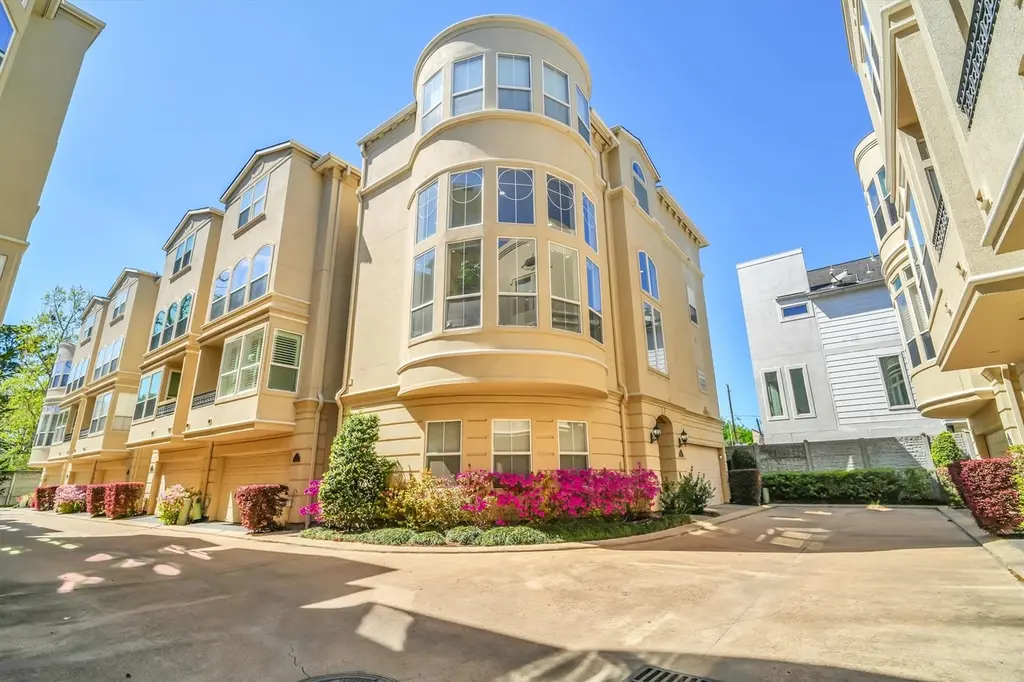
1515 Hyde Park Blvd Blvd #6 · Houston, TX
Flood risk 4/10 · Minor
- FEMA flood zone
- X (unshaded)
- Chance of flooding over 30 yrs
- 0.22%
- Est. flood insurance / yr
- $507 – $1,088
Fire risk 1/10 · Minimal
- Est. fire insurance / yr
- $1,222 – $2,270
Heat risk 9/10 · Severe
- Hot days now (above 109°F)
- 7 days/yr
- Hot days in 30 yrs
- 24 days/yr
Wind risk 9/10 · Severe
- Chance of severe wind over 30 yrs
- 99.0%
Air-quality risk 2/10 · Minimal
- Unhealthy air days now
- 2 days/yr
- Unhealthy air days in 30 yrs
- 2 days/yr
Risk factors via First Street. Map © Google.
Why this score? — see what drove the C- grade
The composite is a weighted blend of 9 inputs, each scored 0–100. Each bar is that input's sub-score; the figure is the points it added to the 100-point composite (weight × sub-score).
- Cash flow +19.1/30.0
- ARV discount +9.5/15.0
- 1% rule +6.3/10.0
- DSCR +6.0/10.0
- Livability +3.7/5.0
- Schools +2.7/10.0
- Condition / age +2.5/5.0
- Rent growth +2.2/5.0
- Appreciation +0.0/10.0
$567,200
🖨 Deal sheet 📄 Offer letter ✓ Due diligence
Listing remarks
Location, location, location! This NEW listing has it all! Within 5 miles you will discover Downtown, Medical Center, Museum District, Hermann Park and Zoo, Coffee Shops, Restaurants, Parks you can walk to. Every possibleconvenience is available to you. This amazing single family home has 3 floors and a loft (3.5 floors), with 3 bedrooms. Each bedroom has its own bathroom, plus a half bath on the second floor. Open floor plan with windows that provide natural light to all the rooms. Loft on the 3rd floor is being used as a study, but can become whatever you want it to be ( TV room, play/game room or library) and overlooks the living area. Kitchen is opened to dining room and living room an
Key facts
- Open floor plan
- Large island
- Wine fridge
Tags
Property features AI
Finance
- HOA & community: Association: Genesis Community Management; Annual association fee of $3,300 (includes common areas and grounds maintenance); Controlled access; Curbs in community
Exterior
- Parking: Attached 2-car garage with garage door opener
- Security: Security gate; Owned security system; Smoke detector(s)
- Utilities: Public water; Public sewer
- Home design: Residential property; Full ownership; 2,813 living area; Concrete road surface
- Construction: Stucco exterior; Composition roof; Slab foundation; Built in 1999
- Exterior features: Balcony; Corner lot; Subdivision
Interior
- Kitchen: Dishwasher; Electric oven; Gas cooktop; Disposal; Microwave; Oven; Wine refrigerator
- Bedrooms: Primary bedroom (Fourth level) — 19.2 x 15; Bedroom (Fourth level) — 13.5 x 12.6; Bedroom (First level) — 16 x 13.4; Library (Third level) — 19.2 x 15.2; Living room (Second level) — 19 x 15.10; Dining room (Second level) — 16.6 x 14.4; Total rooms: 6
- Flooring: Carpet; Wood
- Bathrooms: 3 full bathrooms; 1 half bathroom
- Heating & cooling: Central heating (Gas); Central air (Electric)
- Interior features: Breakfast bar; Balcony; Double vanity; High ceilings; Jetted tub; Kitchen island; Kitchen/family room combo; Primary bedroom with bath; Multiple staircases; Pantry; Separate shower; Tub/shower; Vanity; Wired for sound; Window treatments; Ceiling fan(s); Loft; Living/dining room; Adaptable for elevator; Window coverings; 1 fireplace
- Laundry & utility: Washer hookup; Gas dryer hookup
Neighborhood map
What this means for you Summary
Snapshot
- This is a 3-bed/3.5-bath townhouse listed at $567k.
Deal economics
- At list price, monthly cash flow is $603 ($7k/yr) — positive.
- The deal already cash-flows at list — no discount required.
- Meets the 1% rule at list price ($6k rent vs $567k).
- Recommended offer: $550k (3.0% below list) — sets the bar for market timing.
- Cap rate 7.6% vs local median 3.2% in Houston — top-decile yield for the area; either an underpriced asset or a hidden risk that comps aren't pricing in. Stress-test before assuming the spread holds.
Location & tenants
- Location reads 74/100 on livability (#184 in TX, #4,771 nationally) — a middle-class / working-renter tenant base. Strengths: amenities A+, cost of living A+, housing A+; Watch: crime F.
- Houston ISD (urban): math 27% / reading 35% proficiency, ranked #593 of 826 in TX (top 72%) — families likely to look elsewhere, expect single-tenant / working-renter base with shorter leases; 71% free/reduced lunch — lower-income household profile, screen leases tightly.
- Zoned schools: Ella J Baker Montessori School (math 32% / reading 47%, grade F, #1,545 of 4,322 statewide, top 38%, 607 students, 37% FRL); Lanier Middle (math 73% / reading 82%, grade A+, #27 of 1,662 statewide, top 2%, 1,434 students, 29% FRL); Lamar H S (math 38% / reading 65%, grade D+, #478 of 1,632 statewide, top 29%, 3,125 students, 49% FRL) — zoned schools average 38% FRL vs 71% district-wide (33 pts lower); this property's tenant base skews higher-income than the district average.
- Zoned-school proficiency averages 56% at this address vs 31% district-wide (+25 pts) — the actual schools serving this property are materially stronger than the Houston ISD average implies; a family-tenant draw the district grade alone would hide.
- Market conditions: Rents soft (-1.3%/yr); 264 active listings in the ZIP; 35 comparable units currently listed for rent nearby; rentals at typical pace (median 14d on market — plan ~3-4 weeks tenant-placement turnaround); 43% of comp listings sitting > 30 days — soft ceiling on asking rent; solid renter incomes; 29,883 units permitted in Harris County in 2024 (8,621 in 5+ unit buildings).
- At $6,433/mo this rent would consume 72% of the median local household income ($107k/yr) (locally 1688% of renters already pay >50% of income on rent) — very limited rent-growth headroom before tenants either downsize or default.
Forward outlook
- Local home prices are declining (-3.0%/yr); year-one equity from $4k of loan paydown is wiped out by about $17k of value loss. Plan a longer hold.
- Harris County population projected at +47% by 2050 — long-run rental-demand tailwind backs the buy-and-hold thesis.
Negotiation context
- It's been on market 49 days — a 3% lower offer ($550k) is reasonable based on typical stale-listing flexibility.
- 2 sale attempts since 23y ago with the ask held roughly flat each time — persistent listings suggest the price (not the market) is what's stuck; bring a comps-based counter.
- Current owner paid $390k; 45% above their basis — modest negotiation headroom, anchor on the comps not their cost.
Risks & watch-outs
- Climate carrying-cost: severe wind risk, 99% chance of damaging wind over 30y; extreme-heat days projected 7→24/yr by 2055 (HVAC capex compounding) — expect insurance premiums to compound above CPI over the hold.
Questions for the listing agent
- It's been on market 49 days. Have you received any prior offers? Is the seller open to a 3% concession, seller financing, or rate buy-down credit?
- What does the HOA fee cover, when was the last increase, and are there any pending special assessments or reserve-fund shortfalls?
- Is there a deadline driving the sale (1031 exchange, divorce, estate, relocation)? That informs how much negotiation room exists.
- Schools are D-rated, which usually means shorter tenancies and higher turnover. Who's the typical renter profile here, and what's been the actual vacancy rate?
- Crime grade is F in this area — have there been break-ins, vandalism, or insurance claims at this property in the last 3 years? What carrier currently insures it and at what premium?
- What's the average days-on-market for RENTAL listings here right now (not sales)? A rising rental-DOM trend means longer vacancies and softer asking-rent achievability than the comps imply.
- What's the recent tenant-quality profile in this submarket — average credit score on applications, eviction rate, late-payment / NSF rate, and stable-employment percentage? A property-management company in the area should have these aggregated.
- How much new for-sale + rental construction is in the pipeline within 1–3 miles? Heavy new supply typically softens prices + rents 12–24 months out; constrained supply supports both.
Investment metrics
- 1% rule
- 1.13% ✓
- Cap rate
- 7.57%
- Cash-on-cash
- 4.55%
- DSCR
- 1.20
- GRM
- 7.3
CMA / ARV
- ARV (on-the-fly)
- $593,543
- Comps found
- 12
Show comp detail 12 sales within ~0.75 mi
| Address | Dist | Beds/Ba | Sqft | Sold | Price | $/sf | Match |
|---|---|---|---|---|---|---|---|
| 2611 Commonwealth St | 0.13mi | 3/3.0 | 2,673 (-5%) | 2mo | $525,000 | $196 | 82 |
| 2403 Commonwealth St | 0.08mi | 3/4.0 | 3,015 (+7%) | 3mo | $622,000 | $206 | 80 |
| 2003 Morse St | 0.52mi | 3/3.5 | 2,820 (+0%) | 1mo | $599,000 | $212 | 75 |
| 717 Welch St | 0.51mi | 3/3.5 | 2,719 (-3%) | 1mo | $540,000 | $199 | 70 |
| 1705 Park St | 0.45mi | 3/3.5 | 2,980 (+6%) | 0mo | $630,000 | $211 | 68 |
| 2001 Vermont St | 0.70mi | 3/3.5 | 2,804 (-0%) | 1mo | $729,000 | $260 | 66 |
| 2507 Montrose Blvd #36 | 0.32mi | 3/3.5 | 2,470 (-12%) | 0mo | $250,000 | $101 | 64 |
| 1824 Vermont St | 0.37mi | 3/3.5 | 2,434 (-14%) | 1mo | $499,000 | $205 | 60 |
| 3300 Taft St Unit B | 0.65mi | 3/3.5 | 3,150 (+12%) | 1mo | $649,000 | $206 | 49 |
| 615 W Bell St | 0.74mi | 3/3.5 | 2,548 (-9%) | 2mo | $665,000 | $261 | 48 |
| 1212 W Alabama St | 0.54mi | 3/2.5 | 2,407 (-14%) | 1mo | $650,000 | $270 | 46 |
| 1712 Mcduffie St | 0.73mi | 3/3.5 | 3,184 (+13%) | 3mo | $765,000 | $240 | 42 |
Match score weights: distance 35% · size 25% · config 20% · recency 20%. Top-matched comps best support the ARV.
Projected returns pro-forma
-3.0% appreciation · 0.0% rent growth · sell at horizon
- IRR
- -13.0%
- Equity multiple
- 0.55×
- Total profit
- $-71,935
- Equity at exit
- $84,571
- IRR
- -10.3%
- Equity multiple
- 0.47×
- Total profit
- $-84,278
- Equity at exit
- $49,041
Cash invested: $158,816 (down + closing). Projections, not guarantees.
Landlord ↔ Tenant lean methodology
- Overall (STATE)
- 87 Strongly Landlord-Friendly
- State Texas
- 87 Strongly Landlord-Friendly · R+5
- County
- — inherits STATE
- City
- — inherits STATE
ZIP-level market 77006
- Rents YoY
- -1.3%
- Active inventory
- 264
- Price-to-rent
- 7.3×
Monthly cashflow live
- Estimated rent
- $6,433 high interval (Pro) →
- Mortgage (P&I)
- −$2,974
- Tax from tax record
- −$994 /mo · $11,925/yr
- Insurance
- −$236
- HOA
- −$275
- Vacancy / Maint / Mgmt
- −$1,351
- Net cashflow
- $603
Break-even live
UW: 25.0% down · 7.5% · 30yr · 1.5% tax · 5.0% vac · 8.0% maint · 8.0% mgmt
Financing live
Cash to close
- Down payment
- $141,800
- Closing costs
- $17,016
- Reserves months
- —
- Total cash needed
- —
Loan-product check · same deal, 3 products live
Conventional
25% down · 7.5% · 30yr
- Down + closing
- —
- Monthly P&I
- —
- Monthly cashflow
- —
- DSCR
- —
- Eligible?
- —
Personal DTI + credit; lowest rate.
DSCR
20% down · 8.5% · 30yr
- Down + closing
- —
- Monthly P&I
- —
- Monthly cashflow
- —
- DSCR
- —
- Eligible?
- —
No personal income docs; deal must DSCR.
Hard money
10% down · 12.0% · 12mo
- Down + closing
- —
- Monthly P&I
- —
- Monthly cashflow
- —
- DSCR
- —
- Eligible?
- —
Short-term bridge; refi at stabilization.
Rent comps 35 comps
| Address | Beds | Baths | Sqft | Rent | $/sqft | DOM | Units | Dist |
|---|---|---|---|---|---|---|---|---|
| 2205 Commonwealth St Houston, TX | 4.0 | 4.0 | 2513 | $3,300 | $1.31 | 43d | 1 | 0.17mi |
| 1326 Fairview Ave Houston, TX | 3.0 | 3.0 | 2176 | $3,250 | $1.49 | 43d | 1 | 0.20mi |
| 1501 Hawthorne St Houston, TX | 2.0 | 1.0 | 3341 | $1,525 | $0.46 | 43d | 1 | 0.29mi |
| 3411 Yoakum Blvd Unit 3165 Houston, TX | 3.0 | 2.0 | 3110 | $12,272 | $3.95 | 3d | 1 | 0.42mi |
| 3411 Yoakum Blvd Unit 510 Houston, TX | 3.0 | 2.0 | 3110 | $12,304 | $3.96 | 11d | 1 | 0.42mi |
| 1924 Fairview Ave Houston, TX | 3.0 | 3.5 | 2830 | $9,750 | $3.45 | 43d | 1 | 0.45mi |
| 2323 Woodhead St Unit 1019542P Houston, TX | 3.0 | 3.5 | 2820 | $15,722 | $5.58 | 24d | 1 | 0.45mi |
| 414 Hyde Park Blvd Houston, TX | 3.0 | 3.5 | 2300 | $5,400 | $2.35 | 5d | 1 | 0.61mi |
| 1211 Marconi St Houston, TX | 4.0 | 3.5 | 3020 | $4,500 | $1.49 | 43d | 1 | 0.73mi |
| 328 Bomar St Houston, TX | 3.0 | 3.5 | 2688 | $5,300 | $1.97 | 22d | 1 | 0.76mi |
| 2024 Welch St Houston, TX | 3.0 | 4.0 | 2294 | $2,800 | $1.22 | 43d | 1 | 0.76mi |
| 420 Hawthorne St Houston, TX | 4.0 | 2.0 | 2230 | $3,373 | $1.51 | 43d | 1 | 0.77mi |
| 1118 Columbus St Unit A Houston, TX | 3.0 | 3.5 | 2338 | $3,000 | $1.28 | 43d | 1 | 0.78mi |
| 1958 W Gray St Unit 3165 Houston, TX | 3.0 | 2.0 | 3206 | $15,018 | $4.68 | 3d | 1 | 0.79mi |
| 1958 W Gray St Unit 1991 Houston, TX | 3.0 | 2.0 | 3206 | $15,050 | $4.69 | 10d | 1 | 0.79mi |
| 1027 Gross St Houston, TX | 4.0 | 3.5 | 3035 | $5,800 | $1.91 | 43d | 1 | 0.91mi |
| 811 Buffalo Park Dr Unit 510 Houston, TX | 3.0 | 2.0 | 3632 | $15,424 | $4.25 | 11d | 1 | 0.97mi |
| 811 Buffalo Park Dr Unit 844 Houston, TX | 3.0 | 2.0 | 3632 | $14,913 | $4.11 | 14d | 1 | 0.97mi |
| 811 Buffalo Park Dr Unit 3187 Houston, TX | 3.0 | 2.0 | 3632 | $15,392 | $4.24 | 3d | 1 | 0.97mi |
| 710 Stanford St Houston, TX | 3.0 | 4.0 | 2438 | $3,490 | $1.43 | 43d | 1 | 1.00mi |
| 2025 Colquitt St Unit 1257741P Houston, TX | 3.0 | 3.5 | 2594 | $7,405 | $2.85 | 43d | 1 | 1.05mi |
| 707 Marston St Unit 510 Houston, TX | 3.0 | 2.0 | 2310 | $12,482 | $5.40 | 3d | 1 | 1.07mi |
| 2311 Westheimer Rd Houston, TX | 1.0–3.0 | 1.0–3.0 | 1489 | $13,862 | $9.31 | 1d | 14 | 1.16mi |
| 3300 Main St Unit 3333 Houston, TX | 3.0 | 2.0 | 2861 | $7,493 | $2.62 | 11d | 1 | 1.18mi |
| 3300 Main St Unit 3165 Houston, TX | 3.0 | 2.0 | 2861 | $7,461 | $2.61 | 3d | 1 | 1.18mi |
| 4899 Montrose Blvd Houston, TX | 1.0–3.0 | 1.0–2.5 | 2704 | $10,080 | $3.73 | 43d | 10 | 1.18mi |
| 2243 W Alabama St Houston, TX | 3.0 | 3.0 | 1998 | $2,440 | $1.22 | 43d | 1 | 1.19mi |
| 4001 Fannin St Houston, TX | 3.0 | 1.0–3.0 | 1536 | $3,158 | $2.06 | 3d | 16 | 1.26mi |
| 3131 Memorial Ct Houston, TX | 2.0 | 1.0–2.5 | 1336 | $3,418 | $2.56 | 2d | 32 | 1.27mi |
| 1216 Rosedale St Houston, TX | 3.0 | 3.5 | 2584 | $3,250 | $1.26 | 12d | 1 | 1.42mi |
| 1216 Rosedale St Houston, TX | 3.0 | 3.5 | 2584 | $3,250 | $1.26 | 14d | 1 | 1.42mi |
| 2651 Kipling St Unit 3165 Houston, TX | 3.0 | 2.0 | 2739 | $11,460 | $4.18 | 3d | 1 | 1.43mi |
| 4606 Austin St Houston, TX | 3.0 | 3.5 | 2950 | $3,000 | $1.02 | 43d | 1 | 1.43mi |
| 2651 Kipling St Unit 510 Houston, TX | 3.0 | 2.0 | 2739 | $11,492 | $4.20 | 11d | 1 | 1.44mi |
| 2719 Kipling St Unit B Houston, TX | 3.0 | 3.5 | 2184 | $4,400 | $2.01 | 43d | 1 | 1.48mi |
HOA detail
- Monthly dues
- $275 · $3,300/yr
Listing history 6 events
-
2026-05-09status Pending
-
2026-04-28status Pending
-
2026-03-20$567,200 Active
-
2003-07-15historical
-
2003-04-09$389,000
-
2000-07-19soldstatus $389,900
ⓘ Source: listings_history table (triggers on properties + properties_extension) + one-shot
backfill from property_details.listing_events for pre-trigger history.
Tax reassessment forecast TX · Resets to sale price
- Current annual tax
- $11,925 · $994/mo
- Projected year-2 tax
- $11,925 · $994/mo
- Expected delta
- $0/yr ($0/mo · 0.0%)
ⓘ Screening estimate from a state-policy table — verify with the county assessor before closing.
Climate risk First Street
- Flood 4/10 Moderate FEMA zone X (unshaded) · 22% chance over 30 yrs
- Wildfire 1/10 Low
- Heat 9/10 Extreme 7 d/yr ≥109°F today · 24 d/yr by 30 yrs out
- Wind 9/10 Extreme 99% chance of damaging wind over 30 yrs
- Air quality 2/10 Low 2 unhealthy d/yr today · 2 by 30 yrs out
Nearby sold comps map
Loading sold comps map…
Walkable amenities ~0.75 mi
Loading nearby amenities…
Taxation est. · year 1
- Rental income
- $77,199
- − Mortgage interest
- −$31,772
- − Property taxes
- −$11,925
- − Insurance
- −$2,836
- − Repairs & maintenance
- −$6,176
- − Management
- −$6,176
- − HOA
- −$3,300
- − Depreciation
- −$16,500
- Taxable loss
- −$1,486
- Est. tax savings @ 24.0%
- +$357
- After-tax cash flow
- $7,589/yr
For passive investors: Depreciation is non-cash, so a rental often shows a tax loss while cash-flowing — sheltering income. Rental losses are passive: they offset passive income freely, and up to $25,000/yr can offset ordinary (W-2) income if you actively participate and your MAGI is under $100k (phasing out to $0 by $150k); unused losses carry forward. On sale, claimed depreciation is recaptured at up to 25%, and gains may owe capital-gains tax (a 1031 exchange can defer both). Figures are a year-1 estimate at your 24.0% rate — not tax advice; consult a CPA.
Schools (NCES district)
- District
- Houston ISD
- NCES district ID
- 4823640
- Math proficiency
- 27% ▼ -18.00%
- Reading proficiency
- 35% ▼ -6.00%
- Median HH income
- $46,054
- Composite
- 26.63/100
- National rank
- #7173
- State rank
- #593 of 826 in TX
Livability — Houston
- Score
- 74/100
- State rank
- #184
- US rank
- #4771
Category grades
Schools grade is shown separately in the Schools card above.
Census & demographics
- Census place
- Houston, TX
- County
- Harris County · 4,702,590 people
- City population
- 3,226,434
- Metro
- Houston-The Woodlands-Sugar Land, TX
- Population (ZIP)
- 24,892
- Household income
- $106,533
- Rent vs Own
- Severe rent burden
- 1688.0
Population outlook (Harris County) Hauer SSP2
- Today (2025)
- 5,571,493 people
- By 2030
- 6,089,821 · +9.3%
- By 2040
- 7,142,806 · +28.2%
- By 2050
- 8,185,864 · +46.9%
- By 2075
- 10,574,329 · +89.8%
- By 2100
- 12,109,958 · +117.4%
Race, ethnicity, and origin ACS 2023
- Neighborhood character
- Diverse neighborhood (Simpson 0.59)
- Race & ethnicity
- White 61% Hispanic / Latino 16% Two or more races 12% Asian 9% Black 8%
- Hispanic origin (detail)
- Mexican 9% Puerto Rican 1%
- Common ancestry
- Romanian 4% Slovak 4% Lithuanian 3%
- Foreign-born
- 16% · Canada, China, Jamaica
- Languages at home
- 77% English-only · Spanish 12% Other Indo-European 3% Chinese 2%
Political lean MEDSL · Harris
- 2024 margin
- Lean D (+5.5) · D 52.0% · R 46.4% · Other 1.6%
- 2008→2024 swing
- +3.9pp toward D · 2008: 1.6pp · 2024: 5.5pp
- All cycles
- 2024: D+5.5 2020: D+13.3 2016: D+12.4 2012: D+0.1 2008: D+1.6
Not yet ingested
- Civics
- —
Market trends
- HPI YoY
- ▼ -273.34%
- Current HPI
- 204.0321
- Rent YoY
- ▼ -1.29%
- Metro
- Houston-The Woodlands-Sugar Land, TX
- State GDP YoY
- ▲ 3.95%
- F500 in state
- 110
Industry mix (Fortune 500 HQ in TX)
| Industry | F500 HQs | Revenue |
|---|---|---|
| Energy | 16 | $1,198B |
|
||
| Technology | 5 | $198B |
|
||
| Engineering / Construction | 4 | $72B |
|
||
| Energy Services | 3 | $60B |
|
||
| Utilities | 3 | $41B |
|
||
| Healthcare | 2 | $330B |
|
||
Price history
+45.5% since first listed6 events — show timeline
- 2026-05-09 Pending — HARMLS
- 2026-04-28 Pending — HARMLS
- 2026-03-20 Listed $567,200 HARMLS
- 2003-07-15 Listing Removed — HARMLS
- 2003-04-09 Listed $389,000 HARMLS
- 2000-07-19 Sold (Public Records) $389,900 Public Records
Property tax history
+1.1%/yrLatest (2025): $11,925 · -3.6% YoY. Source: county tax records.
Cash-flow waterfall
monthlySold comps — $/sqft
last 12 mo · ≤1 miLoading sold comps…