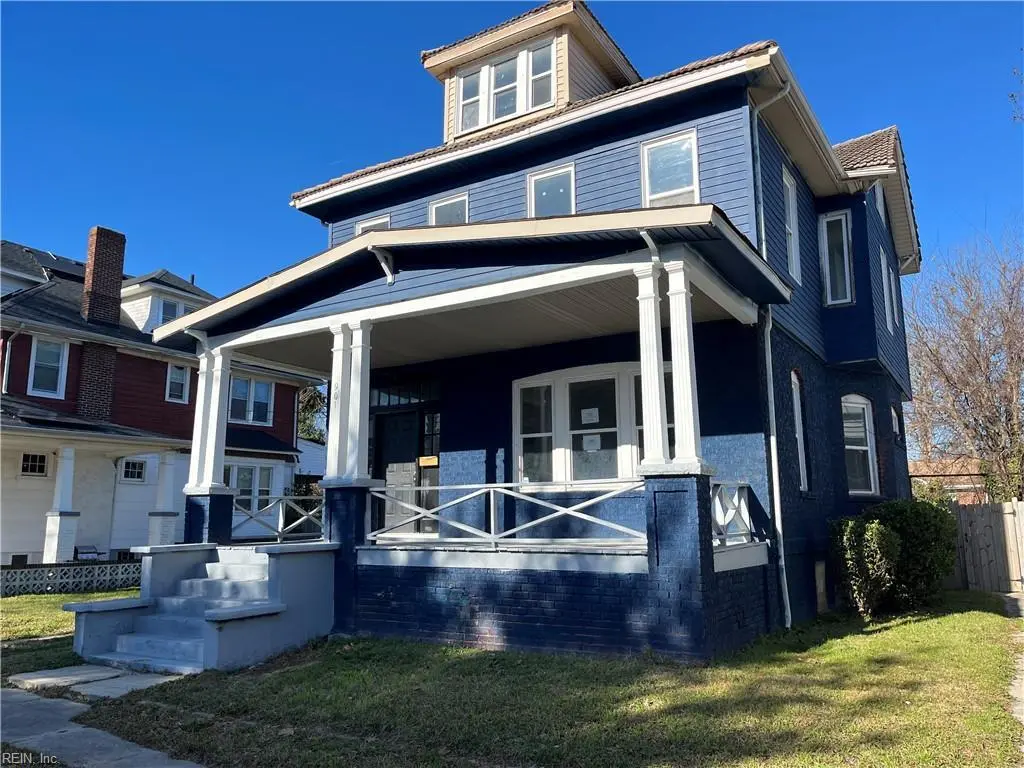
901 Grayson St · Norfolk, VA
Flood risk 4/10 · Minor
- FEMA flood zone
- X (unshaded)
- Chance of flooding over 30 yrs
- 0.13%
- Est. flood insurance / yr
- $507 – $1,088
Fire risk 1/10 · Minimal
- Est. fire insurance / yr
- $666 – $1,236
Heat risk 9/10 · Severe
- Hot days now (above 106°F)
- 7 days/yr
- Hot days in 30 yrs
- 16 days/yr
Wind risk 8/10 · Major
- Chance of severe wind over 30 yrs
- 80.0%
Air-quality risk 5/10 · Moderate
- Unhealthy air days now
- 6 days/yr
- Unhealthy air days in 30 yrs
- 7 days/yr
Risk factors via First Street. Map © Google.
Why this score? — see what drove the C grade
The composite is a weighted blend of 9 inputs, each scored 0–100. Each bar is that input's sub-score; the figure is the points it added to the 100-point composite (weight × sub-score).
- Cash flow +19.1/30.0
- ARV discount +15.0/15.0
- DSCR +6.0/10.0
- 1% rule +5.0/10.0
- Livability +4.2/5.0
- Schools +3.5/10.0
- Rent growth +2.5/5.0
- Condition / age +2.5/5.0
- Appreciation +0.0/10.0
$230,000
🖨 Deal sheet 📄 Offer letter ✓ Due diligence
Listing remarks MLS
Charming Victorian style home in Berkley neighborhood of Norfolk boasting a grand stairway and wide open foyer. Ready for you to make your own by finishing the renovations. Five bedrooms. Hardwood floors, finished attic is third floor suitable for bedroom, office, exercise, crafts or flex room. Wide welcoming front porch.
Key facts
- Built 1915
- Listed 103 days
Neighborhood map
What this means for you Summary
Snapshot
- This is a 3-bed/1.5-bath single-family listed at $230k.
Deal economics
- At list price, monthly cash flow is $245 ($3k/yr) — positive.
- The deal already cash-flows at list — no discount required.
- To meet the 1% rule (rent ≥ 1% of price), the offer needs to be $230k (0.2% below list).
- Recommended offer: $209k (9.0% below list) — sets the bar for market timing.
- Cap rate 7.6% vs local median 4.0% in Norfolk — top-decile yield for the area; either an underpriced asset or a hidden risk that comps aren't pricing in. Stress-test before assuming the spread holds.
Location & tenants
- Location reads 83/100 on livability (#43 in VA, #1,026 nationally) — a professional / high-income tenant draw. Strengths: amenities A+, commute A+, health & safety A+; Watch: employment C-, crime F.
- Norfolk City Public School District (urban): math 27% / reading 56% proficiency, ranked #118 of 131 in VA (top 90%) — families likely to look elsewhere, expect single-tenant / working-renter base with shorter leases.
- Market conditions: 24 active listings in the ZIP; 22 comparable units currently listed for rent nearby; rentals at typical pace (median 21d on market — plan ~3-4 weeks tenant-placement turnaround); 438 units permitted in Norfolk city in 2024 (273 in 5+ unit buildings).
Forward outlook
- Local home prices are declining (-3.0%/yr); year-one equity from $2k of loan paydown is wiped out by about $7k of value loss. Plan a longer hold.
Negotiation context
- It's been on market 103 days — a 9% lower offer ($209k) is reasonable based on typical stale-listing flexibility.
- 7 sale attempts since 3y ago with the ask held roughly flat each time — persistent listings suggest the price (not the market) is what's stuck; bring a comps-based counter.
- Current owner paid $118k; list at $230k implies a 96% gain — meaningful room to come down on a strong offer.
Risks & watch-outs
- Watch-outs: built in 1915 — expect roof / HVAC / electrical / plumbing capex.
- Climate carrying-cost: severe wind risk, 80% chance of damaging wind over 30y; extreme-heat days projected 7→16/yr by 2055 (HVAC capex compounding) — expect insurance premiums to compound above CPI over the hold.
Questions for the listing agent
- It's been on market 103 days. Have you received any prior offers? Is the seller open to a 9% concession, seller financing, or rate buy-down credit?
- Built in 1915 — when were the roof, HVAC, electrical panel, plumbing, and water heater last replaced?
- Why hasn't it sold? Are there any deal-killer items the seller is aware of (foundation, flood, title, zoning, code violations)?
- Is there a deadline driving the sale (1031 exchange, divorce, estate, relocation)? That informs how much negotiation room exists.
- Schools are A-rated — typically a magnet for longer-tenancy family renters. What's the average tenant stay here, and is there a school-zone premium baked into asking?
- Crime grade is F in this area — have there been break-ins, vandalism, or insurance claims at this property in the last 3 years? What carrier currently insures it and at what premium?
- What's the average days-on-market for RENTAL listings here right now (not sales)? A rising rental-DOM trend means longer vacancies and softer asking-rent achievability than the comps imply.
- What's the recent tenant-quality profile in this submarket — average credit score on applications, eviction rate, late-payment / NSF rate, and stable-employment percentage? A property-management company in the area should have these aggregated.
- How much new for-sale + rental construction is in the pipeline within 1–3 miles? Heavy new supply typically softens prices + rents 12–24 months out; constrained supply supports both.
Investment metrics
- 1% rule
- 1.00% ✗
- Cap rate
- 7.57%
- Cash-on-cash
- 4.56%
- DSCR
- 1.20
- GRM
- 8.3
CMA / ARV
- ARV (median comp)
- $337,500
- List price
- $230,000
- Delta
- -31.85%
- Verdict
- UNDERPRICED
- Comps
- 16 within 1.0 mi
Show comp detail 10 sales within ~0.75 mi
| Address | Dist | Beds/Ba | Sqft | Sold | Price | $/sf | Match |
|---|---|---|---|---|---|---|---|
| 912 S Main St | 0.10mi | 3/2.5 | 1,732 (-2%) | 8mo | $342,000 | $197 | 82 |
| 520 Nelson St | 0.12mi | 3/2.0 | 1,900 (+8%) | 1mo | $303,000 | $159 | 79 |
| 125 Irving St | 0.07mi | 3/2.5 | 1,710 (-3%) | 11mo | $300,000 | $175 | 78 |
| 304 E Liberty St | 0.07mi | 4/2.5 (+1) | 1,600 (-10%) | 4mo | $260,000 | $163 | 69 |
| 123 Hardy Ave | 0.33mi | 4/1.5 (+1) | 1,556 (-12%) | 4mo | $260,000 | $167 | 56 |
| 229 E Indian River Rd | 0.38mi | 3/2.5 | 1,628 (-8%) | 13mo | $305,000 | $187 | 54 |
| 204 Patrick St | 0.33mi | 3/2.5 | 1,560 (-12%) | 11mo | $257,500 | $165 | 52 |
| 808 Joyce St | 0.63mi | 3/2.5 | 1,656 (-6%) | 7mo | $275,000 | $166 | 50 |
| 1009 Joyce St | 0.73mi | 3/2.5 | 1,992 (+13%) | 2mo | $359,900 | $181 | 39 |
| 1219 Hibie St | 0.65mi | 4/3.0 (+1) | 2,005 (+14%) | 5mo | $420,000 | $209 | 32 |
Match score weights: distance 35% · size 25% · config 20% · recency 20%. Top-matched comps best support the ARV.
Projected returns pro-forma
-3.0% appreciation · 3.0% rent growth · sell at horizon
- IRR
- -9.2%
- Equity multiple
- 0.66×
- Total profit
- $-21,645
- Equity at exit
- $34,294
- IRR
- 0.3%
- Equity multiple
- 1.02×
- Total profit
- $1,332
- Equity at exit
- $19,886
Cash invested: $64,400 (down + closing). Projections, not guarantees.
Landlord ↔ Tenant lean methodology
- Overall (STATE)
- 55 Moderately Landlord-Leaning
- State Virginia
- 55 Moderately Landlord-Leaning · D+2
- County
- — inherits STATE
- City
- — inherits STATE
ZIP-level market 23523
- Home prices YoY
- -16.6%
- Active inventory
- 24
- Price-to-rent
- 8.3×
Monthly cashflow live
- Estimated rent
- $2,296 high interval (Pro) →
- Mortgage (P&I)
- −$1,206
- Tax from tax record
- −$267 /mo · $3,202/yr
- Insurance
- −$96
- HOA
- −$0
- Vacancy / Maint / Mgmt
- −$482
- Net cashflow
- $245
Break-even live
UW: 25.0% down · 7.5% · 30yr · 1.5% tax · 5.0% vac · 8.0% maint · 8.0% mgmt
Financing live
Cash to close
- Down payment
- $57,500
- Closing costs
- $6,900
- Reserves months
- —
- Total cash needed
- —
Loan-product check · same deal, 3 products live
Conventional
25% down · 7.5% · 30yr
- Down + closing
- —
- Monthly P&I
- —
- Monthly cashflow
- —
- DSCR
- —
- Eligible?
- —
Personal DTI + credit; lowest rate.
DSCR
20% down · 8.5% · 30yr
- Down + closing
- —
- Monthly P&I
- —
- Monthly cashflow
- —
- DSCR
- —
- Eligible?
- —
No personal income docs; deal must DSCR.
Hard money
10% down · 12.0% · 12mo
- Down + closing
- —
- Monthly P&I
- —
- Monthly cashflow
- —
- DSCR
- —
- Eligible?
- —
Short-term bridge; refi at stabilization.
Rent comps 22 comps
| Address | Beds | Baths | Sqft | Rent | $/sqft | DOM | Units | Dist |
|---|---|---|---|---|---|---|---|---|
| 1008 Grayson St Norfolk, VA | 3.0 | 2.0 | 2200 | $2,495 | $1.13 | 44d | 1 | 0.12mi |
| 127 Poplar Ave Unit 1 Norfolk, VA | 3.0 | 2.0 | 1700 | $2,199 | $1.29 | 23d | 1 | 0.24mi |
| 329 S Main St Norfolk, VA | 3.0 | 3.0 | 1652 | $3,000 | $1.82 | 44d | 1 | 0.40mi |
| 1512 Marsh St Norfolk, VA | 3.0 | 2.5 | 1727 | $2,195 | $1.27 | 44d | 1 | 0.56mi |
| 1729 Todd St Norfolk, VA | 3.0 | 2.5 | 2000 | $2,450 | $1.23 | 23d | 1 | 0.68mi |
| 1510 Wilson Rd Unit 3 Norfolk, VA | 3.0 | 1.0 | 1273 | $1,200 | $0.94 | 44d | 1 | 0.88mi |
| 1510 Wilson Rd #4 Norfolk, VA | 3.0 | 1.0 | 1273 | $1,400 | $1.10 | 20d | 1 | 0.88mi |
| 1108 Jackson Ave Chesapeake, VA | 3.0 | 2.0 | 1784 | $2,100 | $1.18 | 4d | 1 | 1.02mi |
| 1009 Elkin St Norfolk, VA | 4.0 | 2.5 | 1914 | $2,500 | $1.31 | 12d | 1 | 1.04mi |
| 1151 Perry St Chesapeake, VA | 3.0 | 1.0 | 1296 | $2,000 | $1.54 | 17d | 1 | 1.04mi |
| 321 E Main St Norfolk, VA | 3.0 | 1.0–2.0 | 1147 | $4,929 | $4.30 | 2d | 15 | 1.14mi |
| 1231 Stewart St Chesapeake, VA | 4.0 | 2.5 | 2159 | $2,550 | $1.18 | 3d | 1 | 1.15mi |
| 403 Court St Portsmouth, VA | 3.0 | 1.5 | 2380 | $1,950 | $0.82 | 23d | 1 | 1.16mi |
| 414 London St Unit 3 Portsmouth, VA | 3.0 | 2.0 | 1600 | $1,595 | $1.00 | 23d | 1 | 1.20mi |
| 1110 Park Ave Unit 23324 Chesapeake, VA | 3.0 | 2.0 | 1749 | $2,200 | $1.26 | 23d | 1 | 1.29mi |
| 1110 Park Ave Chesapeake, VA | 3.0 | 2.0 | 1749 | $2,100 | $1.20 | 15d | 1 | 1.29mi |
| 511 Hampton Pl Unit A Portsmouth, VA | 3.0 | 2.0 | 2100 | $2,950 | $1.40 | 44d | 1 | 1.31mi |
| 415 Saint Pauls Blvd Norfolk, VA | 1.0–2.0 | 2.0 | 1186 | $2,200 | $1.85 | 4d | 3 | 1.33mi |
| 415 Saint Pauls Blvd Norfolk, VA | 2.0 | 2.0 | 1185 | $2,348 | $1.98 | 12d | 4 | 1.33mi |
| 528 Hampton Pl Unit 3 Portsmouth, VA | 3.0 | 2.0 | 1650 | $2,000 | $1.21 | 17d | 1 | 1.35mi |
| 219 Granby St #20 Norfolk, VA | 2.0 | 2.0 | 1233 | $2,050 | $1.66 | 7d | 1 | 1.39mi |
| 111 W Tazewell St #303 Norfolk, VA | 2.0 | 2.5 | 1651 | $2,200 | $1.33 | 17d | 1 | 1.43mi |
Listing history 23 events
-
2026-05-06status Under Contract 328-char remark
Show marketing remark (328 chars)
Charming Victorian style home in Berkley neighborhood of Norfolk boasting a grand stairway and wide open foyer. Ready for you to make your own by finishing the renovations. Five bedrooms. Hardwood floors, finished attic is third floor suitable for bedroom, office, exercise, crafts or flex room. Wide welcoming front porch.
-
2026-01-22$230,000 Active 328-char remark
Show marketing remark (328 chars)
Charming Victorian style home in Berkley neighborhood of Norfolk boasting a grand stairway and wide open foyer. Ready for you to make your own by finishing the renovations. Five bedrooms. Hardwood floors, finished attic is third floor suitable for bedroom, office, exercise, crafts or flex room. Wide welcoming front porch.
-
2025-11-21historical
-
2025-10-19price $268,000
-
2025-10-17price $265,000
-
2025-10-04price $250,000
-
2025-09-29price $350,000
-
2025-09-21$375,000 Active
-
2025-05-12historical
-
2025-02-13$265,000 Active
-
2025-01-15historical
-
2024-11-20price $269,900
-
2024-10-15$279,900 Active
-
2024-10-15historical
-
2024-08-15historical
-
2024-08-15$295,000 Active
-
2024-08-06price $299,900
-
2024-06-07$310,000 Active
-
2023-06-04status Under Contract
-
2023-06-02$225,000 Active
-
2004-10-01soldstatus $117,500
-
2004-03-30soldstatus $50,000
-
1994-12-20soldstatus $25,000
ⓘ Source: listings_history table (triggers on properties + properties_extension) + one-shot
backfill from property_details.listing_events for pre-trigger history.
Tax reassessment forecast VA · Resets to sale price
- Current annual tax
- $3,202 · $267/mo
- Projected year-2 tax
- $3,202 · $267/mo
- Expected delta
- $0/yr ($0/mo · 0.0%)
ⓘ Screening estimate from a state-policy table — verify with the county assessor before closing.
Climate risk First Street
- Flood 4/10 Moderate FEMA zone X (unshaded) · 13% chance over 30 yrs
- Wildfire 1/10 Low
- Heat 9/10 Extreme 7 d/yr ≥106°F today · 16 d/yr by 30 yrs out
- Wind 8/10 Severe 80% chance of damaging wind over 30 yrs
- Air quality 5/10 Major 6 unhealthy d/yr today · 7 by 30 yrs out
Nearby sold comps map
Loading sold comps map…
Walkable amenities ~0.75 mi
Loading nearby amenities…
Taxation est. · year 1
- Rental income
- $27,551
- − Mortgage interest
- −$12,884
- − Property taxes
- −$3,202
- − Insurance
- −$1,150
- − Repairs & maintenance
- −$2,204
- − Management
- −$2,204
- − Depreciation
- −$6,691
- Taxable loss
- −$783
- Est. tax savings @ 24.0%
- +$188
- After-tax cash flow
- $3,128/yr
For passive investors: Depreciation is non-cash, so a rental often shows a tax loss while cash-flowing — sheltering income. Rental losses are passive: they offset passive income freely, and up to $25,000/yr can offset ordinary (W-2) income if you actively participate and your MAGI is under $100k (phasing out to $0 by $150k); unused losses carry forward. On sale, claimed depreciation is recaptured at up to 25%, and gains may owe capital-gains tax (a 1031 exchange can defer both). Figures are a year-1 estimate at your 24.0% rate — not tax advice; consult a CPA.
Schools (NCES district)
- District
- Norfolk City Public School District
- NCES district ID
- 5102670
- Math proficiency
- 27% ▼ -44.00%
- Reading proficiency
- 56% ▼ -10.00%
- Median HH income
- $44,358
- Composite
- 35.08/100
- National rank
- #5026
- State rank
- #118 of 131 in VA
Livability — Norfolk
- Score
- 83/100
- State rank
- #43
- US rank
- #1026
Category grades
Schools grade is shown separately in the Schools card above.
Census & demographics
- Census place
- Norfolk, VA
- City population
- 214,042
- Population (ZIP)
- 7,698
Population outlook (Norfolk County) Hauer SSP2
- Today (2025)
- 249,032 people
- By 2030
- 252,347 · +1.3%
- By 2040
- 253,644 · +1.9%
- By 2050
- 251,913 · +1.2%
- By 2075
- 245,281 · -1.5%
- By 2100
- 219,548 · -11.8%
Race, ethnicity, and origin ACS 2023
- Neighborhood character
- Predominantly Black (87%)
- Race & ethnicity
- Black 87% White 7% Two or more races 5% Hispanic / Latino 2%
- Common ancestry
- Romanian 1%
- Foreign-born
- 2% · Canada
- Languages at home
- 94% English-only · Spanish 3% Other Indo-European 1%
Political lean MEDSL · Norfolk
- 2024 margin
- Solid D (+41.5) · D 70.0% · R 28.5% · Other 1.6%
- 2008→2024 swing
- -1.4pp toward R · 2008: 43.0pp · 2024: 41.5pp
- All cycles
- 2024: D+41.5 2020: D+45.6 2016: D+42.0 2012: D+44.0 2008: D+43.0
Not yet ingested
- Civics
- —
Market trends
- HPI YoY
- ▼ -53.73%
- Current HPI
- 269.0309
- Rent YoY
- —
- Metro
- —
- State GDP YoY
- ▲ 2.40%
- F500 in state
- 50
Industry mix (Fortune 500 HQ in VA)
| Industry | F500 HQs | Revenue |
|---|---|---|
| Aerospace / Defense | 4 | $236B |
|
||
| Technology / Defense | 3 | $32B |
|
||
| Financial Services | 2 | $176B |
|
||
| Utilities | 2 | $27B |
|
||
| Insurance | 2 | $25B |
|
||
| Technology | 2 | $15B |
|
||
Price history
+820.0% since first listed23 events — show timeline
- 2026-05-06 Pending — REINMLS
- 2026-01-22 Listed $230,000 REINMLS
- 2025-11-21 Listing Removed — REINMLS
- 2025-10-19 Price Changed $268,000 REINMLS
- 2025-10-17 Price Changed $265,000 REINMLS
- 2025-10-04 Price Changed $250,000 REINMLS
- 2025-09-29 Price Changed $350,000 REINMLS
- 2025-09-21 Listed $375,000 REINMLS
- 2025-05-12 Listing Removed — REINMLS
- 2025-02-13 Listed $265,000 REINMLS
- 2025-01-15 Listing Removed — REINMLS
- 2024-11-20 Price Changed $269,900 REINMLS
- 2024-10-15 Listing Removed — REINMLS
- 2024-10-15 Listed $279,900 REINMLS
- 2024-08-15 Listing Removed — REINMLS
- 2024-08-15 Listed $295,000 REINMLS
- 2024-08-06 Price Changed $299,900 REINMLS
- 2024-06-07 Listed $310,000 REINMLS
- 2023-06-04 Pending — REINMLS
- 2023-06-02 Listed $225,000 REINMLS
- 2004-10-01 Sold (Public Records) $117,500 Public Records
- 2004-03-30 Sold (Public Records) $50,000 Public Records
- 1994-12-20 Sold (Public Records) $25,000 Public Records
Property tax history
+4.2%/yrLatest (2025): $3,202 · +0.6% YoY. Source: county tax records.
Cash-flow waterfall
monthlySold comps — $/sqft
last 12 mo · ≤1 miLoading sold comps…